↗ OpenReview ↗ NeurIPS Homepage ↗ Chat
TL;DR#
Many machine learning models struggle to generalize well due to subpopulation shifts in real-world data, which often involve spurious correlations between features and labels, as well as imbalanced representation of different groups. This is a significant challenge, as models trained on biased data may perform poorly on unseen data that have a different distribution of subpopulations. Addressing this requires innovative techniques to make models more robust and less susceptible to these biases.
This paper proposes a new approach called CODA (Correlation-Oriented Disentanglement and Augmentation) to address this issue. CODA uses a two-stage process. First, it disentangles spurious and causal correlations through a bi-branch encoding and a decoy classifier. Second, it strategically augments the training data with synthetic samples generated using the disentangled features and a novel reweighted consistency loss. Experiments on ColoredMNIST and CelebA datasets demonstrate that CODA significantly improves model robustness to subpopulation shifts, leading to better generalization performance and reducing the performance gap between different subgroups.
Key Takeaways#
Why does it matter?#
This paper is crucial for researchers grappling with subpopulation shifts in machine learning. It introduces a novel framework, offering a new approach to handle spurious correlations and group imbalances, significantly improving model robustness and generalization. The CODA framework and its accompanying techniques open exciting new avenues for research in robust machine learning, particularly in tackling the challenges of real-world data with inherent biases.
Visual Insights#

This figure illustrates the concept of Correlation-Oriented Disentanglement (COD). The first three subfigures (a-c) show the same bird in different backgrounds, highlighting the challenge of distinguishing true object features from spurious correlations in the background. Subfigures (d-f) visually explain the COD process: (d) shows initialization, (e) demonstrates how spurious correlations (Z) are ’trapped’, and (f) shows how causal features (T) are disentangled from these spurious correlations. This disentanglement is crucial for creating a robust model less susceptible to subpopulation shifts.

This table presents a summary of the key statistics for the ColoredMNIST and CelebA datasets used in the paper. It shows the number of samples in each group (Group 1-4) for the training, validation, and testing sets of each dataset. The presence of spurious correlations (SC), group imbalance (GI), and the degree of group proportion shifts (DGPS) between the training and testing sets are also indicated.
In-depth insights#
CODA Framework#
The CODA framework, designed for robust machine learning models against subpopulation shifts, cleverly combines correlation-oriented disentanglement and strategic sample augmentation. Its bi-branch encoding process disentangles spurious and causal correlations, while a novel reweighted consistency loss reinforces training on synthesized samples. This approach, unlike prior methods, directly leverages spurious correlations to enhance model generalization, instead of simply avoiding them. CODA’s effectiveness is validated across ColoredMNIST and CelebA datasets, demonstrating improved worst-group accuracy and reduced group accuracy gaps. This framework offers a promising pathway towards more robust AI, particularly in scenarios with imbalanced or shifting data distributions.
Disentanglement#
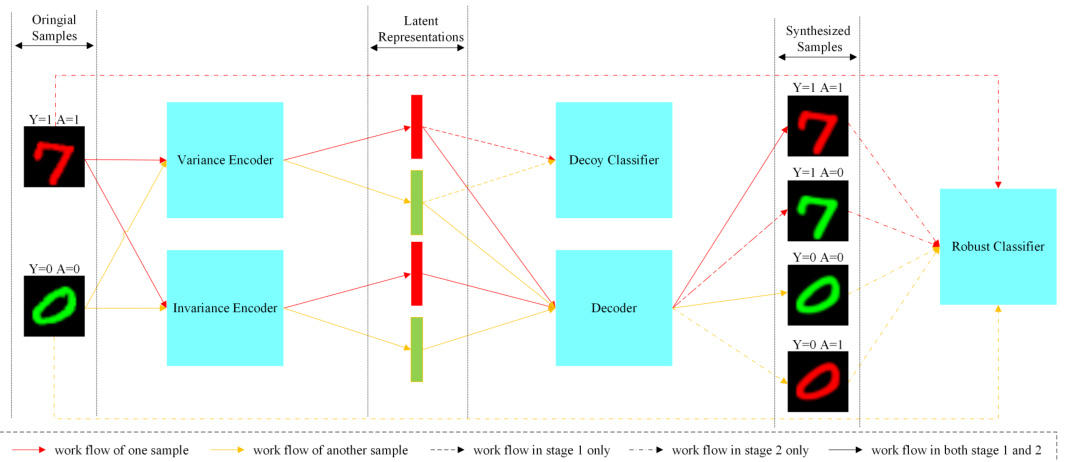
Disentanglement, in the context of this research paper, is a crucial technique for improving the robustness of machine learning models, particularly when faced with subpopulation shifts. The core idea revolves around separating causal features from spurious correlations within the data. This is achieved through a novel bi-branch encoding process where a variance encoder extracts information pertaining to spurious attributes and an invariance encoder focuses on capturing causal relationships. The effectiveness of this approach stems from the ability to generate synthetic samples that retain class information while varying in spurious attributes. This strategy enables the model to learn more generalized representations, reducing overreliance on incidental correlations present in the training data but absent in real-world scenarios. The method directly addresses the challenges posed by spurious correlations and group imbalance, which often lead to poor generalization. CODA’s disentanglement module stands out due to its coordination with a decoy classifier and a reconstruction loss, thus further strengthening its robustness. The use of both original and synthesized samples in training further enhances the models ability to generalize and improve its resilience to subpopulation shifts.
Sample Augmentation#
Sample augmentation, a crucial aspect of many machine learning models, is explored in this research. The paper details a novel strategic augmentation technique which enhances model robustness against subpopulation shifts. Instead of simply generating more data, the method leverages a correlation-oriented disentanglement process, separating causal features from spurious correlations. By recombining disentangled features from different original samples, the model generates synthetic samples with varied spurious attributes but maintains accurate class information. This process significantly improves model generalization, reducing overfitting to spurious correlations present in the training data. The reweighted consistency loss further enhances the effectiveness of the augmentation by encouraging consistent predictions across both real and synthetic samples. This innovative approach demonstrates that spurious attributes can be productively used, improving model robustness instead of merely being a hindrance to effective training.
Robustness Analysis#
A robust model should generalize well across various conditions. A robustness analysis section would explore how well the proposed model performs under different perturbations or variations in the input data and training process. This could include evaluating performance with noisy data, data with missing values, or adversarial examples. Sensitivity analysis would assess how model outputs change with variations in hyperparameters. Ablation studies would systematically remove components to determine their individual contributions to overall robustness. Comparison with existing methods on various datasets under different conditions is critical to demonstrating the model’s resilience to real-world complexities. The analysis should quantitatively measure the model’s robustness using metrics that are meaningful in the context of the application, such as worst-group accuracy or average accuracy gap, and thoroughly discuss the results.
Future Work#
Future research could explore extending CODA’s capabilities to handle more complex scenarios, such as those involving multiple spurious correlations or highly imbalanced datasets. Investigating the impact of different augmentation strategies on CODA’s performance would also be valuable. Additionally, exploring alternative disentanglement techniques beyond the bi-branch encoding approach used in CODA could lead to improved robustness and efficiency. Finally, a thorough comparative analysis with other state-of-the-art methods on a wider range of datasets is needed to fully validate CODA’s generalizability and effectiveness. Further work might involve investigating the theoretical guarantees of CODA under more relaxed assumptions.
More visual insights#
More on figures

This figure illustrates the CODA (Correlation-Oriented Disentanglement and Augmentation) framework applied to the ColoredMNIST dataset. It details the two-stage process: (1) disentanglement of causal and spurious correlations using a bi-branch encoder (variance and invariance encoders), a decoder, and a decoy classifier; and (2) sample augmentation with reweighted consistency loss to improve model robustness. The framework aims to create a classifier resilient to spurious correlations by learning to separate causal features from irrelevant ones.

This figure visualizes the synthesized samples generated by the CODA model. The top row and leftmost column show real samples from the ColoredMNIST and CelebA datasets. The remaining images are reconstructions created by combining latent features (z and t) from different real samples. The diagonal shows reconstructions of the same sample, highlighting the model’s ability to generate variations while preserving the original sample’s identity. This demonstrates CODA’s disentanglement and synthesis capabilities, showing its ability to generate samples that vary in spurious attributes while preserving the core information.

The figure shows the sensitivity analysis of the reweighted consistency loss (λ) on the worst-group accuracy. It demonstrates how different values of λ impact the performance of three methods: CODA+ERM, CODA+RWG, and CODA+GDRO. When λ is 0, the methods revert to their standard (non-CODA) counterparts. The graph shows that an optimal value for λ exists that maximizes performance; values too high or too low reduce performance.

This figure visualizes the ability of CODA to generate synthesized samples by combining latent features from different samples. The top row shows real samples, while the leftmost column are also real samples. The remaining images are reconstructed samples generated by CODA using the latent representations (z and t) extracted from the corresponding top-row and leftmost column samples. The main diagonal shows reconstructions of the same sample, illustrating CODA’s ability to reconstruct samples from their latent representations.
More on tables

This table presents the performance of variance and invariance classifiers on the ColoredMNIST dataset. The variance classifier uses the latent variable ‘z’ representing spurious correlations (color), while the invariance classifier uses ’t’ representing causal correlations (digit). The table shows average accuracy, worst-group accuracy (lowest accuracy across all groups), and the maximum accuracy gap (difference between best and worst performing groups). The results are averaged over three independent trials.

This table presents a comparison of the performance of various methods on two datasets: ColoredMNIST and CelebA. The metrics used are average accuracy, worst-group accuracy (the lowest accuracy across all subgroups), and the maximum accuracy gap (the difference between the highest and lowest subgroup accuracies). Three baseline methods are compared: ERM, RWG, and GDRO. For each baseline, the table also shows results when combined with the CODA method. The up arrow (↑) indicates cases where CODA improved the worst-group accuracy and maximum accuracy gap compared to the baseline method.

This table presents the performance of different methods on three variations of the ColoredMNIST dataset (v2, v3, and v4), each with increasing degrees of subpopulation shifts. The metrics shown are average accuracy, worst-group accuracy, and the maximum accuracy gap across groups. The variations in ColoredMNIST datasets are designed to test model robustness under different levels of spurious correlations and group imbalances. The results demonstrate the performance of several baseline methods and the proposed CODA framework in handling such subpopulation shifts.

This table shows the results of a sensitivity analysis performed on the MultipleColoredMNIST dataset to determine the optimal number of synthesized samples per instance (L) for the CODA framework. The analysis compares three different robust classification methods (ERM, RWG, and GDRO) enhanced with CODA, each tested with varying values of L, from 0 (no synthesized samples) to 4. The table presents the average test accuracy and the worst-group test accuracy for each configuration. The results demonstrate how the number of synthesized samples impacts the performance of the CODA-enhanced methods, showcasing the effects on overall accuracy and robustness to subpopulation shifts.

This table presents the average accuracy achieved by different methods (LFF, JTT, ERM, RWG, GDRO, CODA+ERM, CODA+RWG, CODA+GDRO) on three variations of the ColoredMNIST dataset (ColoredMNIST v2, v3, and v4). Each version of the dataset introduces a different degree of spurious correlation and group imbalance, making it a comprehensive test of the methods’ robustness. The results demonstrate the performance of each method across different levels of dataset difficulty.

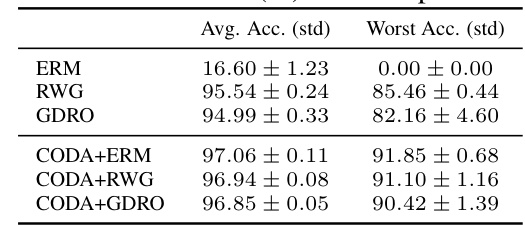
This table presents the average test accuracy and worst-group test accuracy for different methods on the MultipleColoredMNIST dataset. MultipleColoredMNIST is a more challenging dataset with 10 digits and 10 colors, resulting in 100 groups, and a higher level of imbalance and spurious correlation than ColoredMNIST. The results show that CODA consistently outperforms baseline methods (ERM, RWG, GDRO) in both average and worst-group accuracy, highlighting its robustness and scalability to more complex scenarios.

This table compares the average and worst-group accuracy of CODA when using two different types of encoders: 3-CNN-layer encoders and Resnet18 encoders. The results are presented for three different robust classification methods combined with CODA: ERM, RWG, and GDRO. It demonstrates the impact of encoder choice on the overall performance and robustness of the CODA framework.
Full paper#


