↗ OpenReview ↗ NeurIPS Homepage ↗ Chat
TL;DR#
Many AI systems, especially audio classifiers, lack transparency. Zero-shot classifiers, which classify audio based on textual descriptions, pose an even greater challenge. Existing explanation methods are inadequate, failing to effectively convey the decision-making process of these models.
This research introduces LMAC-ZS, a novel approach to explaining zero-shot audio classifiers. LMAC-ZS uses a decoder to generate “listenable” explanations, highlighting the audio segments that influence the model’s prediction. The method employs a new loss function that prioritizes maintaining the original relationships between audio and text. Evaluations demonstrate that LMAC-ZS is faithful to the classifier’s decisions and produces meaningful explanations.
Key Takeaways#
Why does it matter?#
This paper is highly relevant to the growing field of explainable AI (XAI), particularly for multi-modal models. It addresses the challenge of interpreting zero-shot audio classifiers, a complex problem with significant implications for trust and transparency in AI systems. The proposed method, LMAC-ZS, opens new avenues for research in XAI, particularly for developing more effective and user-friendly explainability techniques for emerging AI technologies. Its contribution to the field of zero-shot audio classification is significant, as it paves the way for a better understanding of these powerful yet opaque systems.
Visual Insights#

This figure illustrates the training and inference processes of the CLAP model. The left panel shows the training phase where the text encoder processes text prompts, the audio encoder processes audio waveforms, and a contrastive loss function learns a joint embedding space for text and audio. The right panel shows the zero-shot classification process, where a new text prompt is encoded, and its similarity to the embeddings of different audio waveforms determines the classification result.

This table presents a quantitative comparison of LMAC-ZS (trained on Clotho dataset only and on the full CLAP dataset) against other baseline methods (GradCam, GradCam++, SmoothGrad, and IG) for in-domain zero-shot audio classification on ESC50 and UrbanSound8K datasets. Metrics used to assess the quality of explanations include Average Increase (AI), Average Drop (AD), Average Gain (AG), Faithfulness on Spectra (FF), Input Fidelity (Fid-In), Sparseness (SPS), Complexity (COMP), and Mask-Mean (MM). Higher AI, AG, and FF scores, and lower AD scores indicate better faithfulness of the explanations.
In-depth insights#
Zero-Shot Audio Explainer#
A zero-shot audio explainer is a system that can explain the decisions of an audio classifier without needing to be trained on labeled examples of the audio classes. This is a significant advance because it allows the explainer to be applied to new audio classes without retraining. The approach is particularly relevant for tasks like environmental sound classification where labeled datasets are often scarce and expensive to create. A key advantage is the ability to explain zero-shot classifiers’ decisions using only text prompts, bypassing the need for labeled audio data. This is crucial since zero-shot models’ reliance on semantic similarities rather than explicit class boundaries complicates interpretation. Faithfulness is a critical design challenge, ensuring the explanations truly reflect the classifier’s decision-making process. This requires robust evaluation metrics assessing the accuracy and clarity of the explanations. Finally, the generalizability of such an explainer is critical. A successful explainer should not be limited to a specific classifier architecture or audio representation, but rather be applicable to a broader range of zero-shot audio classification models.
LMAC-ZS Methodology#
The core of LMAC-ZS lies in its innovative decoder-based approach to generating listenable saliency maps for zero-shot audio classification. Unlike previous methods, LMAC-ZS directly addresses the challenge of interpreting the multi-modal nature of zero-shot classifiers by jointly considering audio and text representations within a novel loss function. This function incentivizes the decoder to faithfully reproduce the original similarity patterns between audio and text pairs, thereby ensuring that the generated explanations directly reflect the model’s decision-making process. The use of a decoder allows for the creation of listenable saliency maps, providing a more intuitive and accessible means of understanding the model’s predictions. LMAC-ZS’s architecture, incorporating both linear and non-linear frequency-scale transformations, further enhances its flexibility and applicability to various audio representations. This adaptable design is a key strength, allowing LMAC-ZS to operate effectively on diverse audio datasets and input types. The method also incorporates a diversity term to generate more varied masks for the same audio input, making the explanations even more comprehensive and informative.
Faithfulness Metrics#
In evaluating explainable AI models for audio classification, faithfulness metrics are crucial for assessing how well the explanations align with the model’s actual decision-making process. These metrics don’t directly measure the accuracy of the classifier but instead focus on the relationship between the explanation and the model’s prediction. A high-faithfulness score indicates that the explanation accurately reflects the model’s reasoning, highlighting the parts of the input audio that were most influential in generating the prediction. Conversely, low faithfulness suggests the explanation may be misleading or arbitrary. Different faithfulness metrics can capture different aspects of this relationship, some focusing on the impact of removing or masking parts of the input as indicated by the explanation, while others measure changes in the model’s confidence scores when these parts are manipulated. The choice of metrics depends on the specific goals and the properties of the explanation method being evaluated. Careful consideration of these metrics is vital to ensure that the explanations generated are trustworthy and provide genuine insights into the model’s behavior, which is a critical step in building trustworthy and transparent AI systems.
Cross-Modal Similarity#
Cross-modal similarity, in the context of audio-text research, focuses on measuring the alignment between the representations of audio and text data. Effective cross-modal similarity is crucial for tasks such as zero-shot audio classification, where an audio classifier is evaluated based on its ability to correctly classify audio clips based on text prompts alone. A robust similarity metric enables the model to learn a shared representation space where similar-sounding audio and semantically related text are close together. This shared representation is vital because it facilitates the zero-shot capability; the model can accurately classify sounds even if it’s never explicitly trained on those particular audio examples. The effectiveness of a zero-shot system hinges heavily on the chosen similarity measure’s ability to capture nuanced relationships between acoustic features and semantic meaning. Challenges arise from the inherent differences in the nature of audio and text data, requiring sophisticated techniques to adequately bridge this modality gap. Furthermore, developing a successful cross-modal similarity metric often involves optimizing for specific downstream tasks, necessitating careful consideration of the trade-off between generality and task-specific performance.
Future Work#
Future research directions stemming from this work on listenable maps for zero-shot audio classifiers could explore several promising avenues. Extending the approach to handle variable-length audio is crucial for real-world applicability. Investigating the contributions of top-k classes, beyond the dominant class, would provide further insights into the model’s decision-making. Exploring alternative zero-shot audio classification models beyond CLAP, is important to assess the generalizability of the method and its limitations. The development of more sophisticated diversity metrics for the generated masks would improve the faithfulness and interpretability of the explanations. Furthermore, exploring the use of different frequency representations, and comparing their impact on explanation quality, may reveal further opportunities for improvement. Finally, applying LMAC-ZS to other modalities, such as vision, and evaluating its performance on different classification problems, would offer valuable insights into its broader potential and limitations.
More visual insights#
More on figures

This figure illustrates the architecture of the Listenable Maps for Zero-Shot Audio Classifiers (LMAC-ZS) method. The input audio spectrogram undergoes transformations to match the encoder’s input format, then gets processed by the audio encoder. Simultaneously, text input is processed by the text encoder. Both encodings are fed to a decoder which generates a mask. This mask modifies the original spectrogram. The modified spectrogram is then processed to produce a listenable explanation. The entire process is guided by a novel loss function that aims to preserve the original audio-text similarity.

This figure presents three plots visualizing the results of experiments comparing LMAC-ZS and GradCAM++. The left plot shows the relationship between the mean of the mask values (Mask-Mean) and the similarity scores between audio and text for LMAC-ZS. The middle plot displays the same relationship but for GradCAM++. The right plot illustrates the results of a model randomization test, showing the structural similarity index measure (SSIM) values for both methods across different convolutional block IDs. These plots demonstrate the faithfulness and robustness of LMAC-ZS in comparison to GradCAM++.

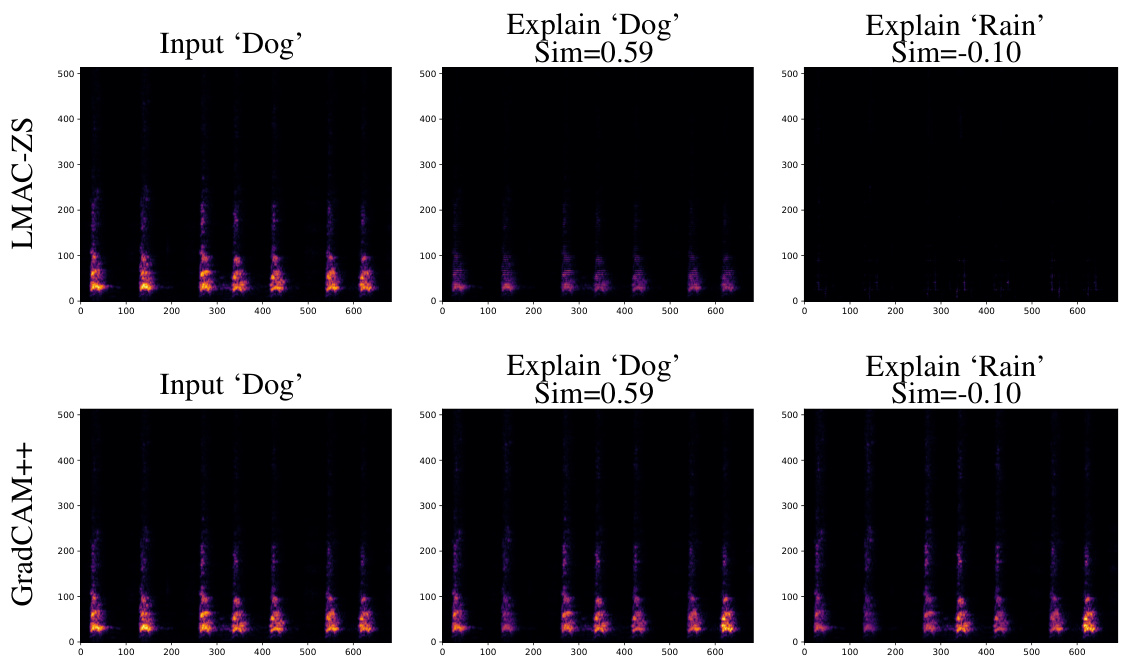
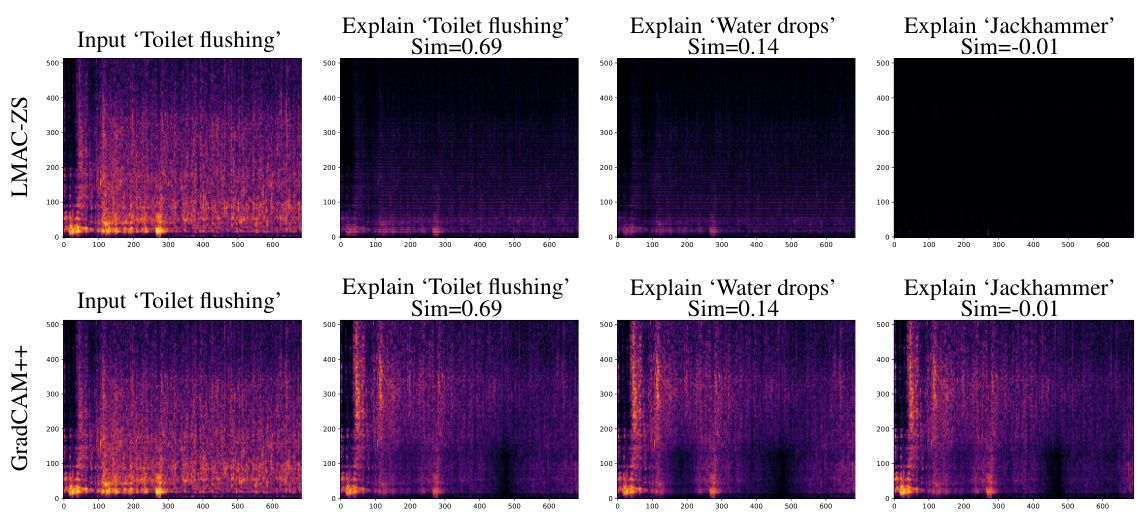
This figure provides a qualitative comparison of the explanations generated by the proposed method LMAC-ZS and the baseline GradCAM++. Two audio examples are shown, one of a ‘cat’ sound and one of ‘glass breaking’. For each, the input spectrogram is shown along with the explanations (saliency maps) generated by both methods, conditioned on both the correct class label and an incorrect class label. LMAC-ZS demonstrates sensitivity to the input-prompt similarity; when the similarity is high, the saliency map highlights relevant audio regions, while a low similarity leads to a nearly empty map. GradCAM++, in contrast, produces relatively consistent saliency maps regardless of the prompt.

This figure shows a visualization of how the explanations change when layers of the model are randomly initialized. The leftmost column shows the input spectrogram. The second column represents the original explanation generated by each method (LMAC-ZS and GradCAM++). As we move to the right, more and more layers of the model are randomly reinitialized, demonstrating how the explanations change as the model’s internal representations are altered. LMAC-ZS explanations quickly disappear as layers are randomized, while GradCAM++ explanations are more resilient to these changes.

This figure compares the qualitative results of explanation methods LMAC-ZS and GradCAM++, applied to audio classification tasks. Two examples are shown, each with two different text prompts. The left column of each example shows the spectrogram of the input audio. The middle column shows the saliency map generated by the explanation method when the text prompt matches the audio class. The right column shows the saliency map when the text prompt does not match the audio class. LMAC-ZS demonstrates sensitivity to the text prompt, producing a blank saliency map when there is little similarity between the audio and prompt. GradCAM++, on the other hand, is shown to be insensitive to prompt selection, providing similar saliency maps regardless of the prompt used.

This figure displays a comparison of qualitative results for LMAC-ZS and GradCAM++. Two audio samples are shown, one labeled ‘Cat’ and one labeled ‘Glass breaking.’ For each audio sample, the input spectrogram is displayed along with the explanations generated by each method when prompted with both the correct label and an incorrect label. The key observation is that LMAC-ZS’s explanations are sensitive to the similarity between the input audio and the given prompt; when the prompt is irrelevant to the audio, the explanation is largely suppressed. In contrast, GradCAM++ produces explanations that do not adapt to the prompt, providing outputs that are largely consistent regardless of the prompt’s relevance.

This figure shows qualitative results comparing explanations generated by LMAC-ZS with and without the additional diversity term (Equation 7) in the paper. The top row displays spectrograms of input audio, the middle row shows the generated explanations (saliency masks) when the diversity term is included, and the bottom row shows the explanations without the diversity term. Each column represents a different audio-text pair, with the original and masked similarities noted. The figure demonstrates how the additional diversity term makes the generated explanations more sensitive to the text prompts, resulting in more focused and relevant saliency maps.

This figure showcases the qualitative results comparing the explanations generated by LMAC-ZS with and without the additional diversity term (Equation 7). The top row shows the input spectrogram and the original audio-text similarity. The middle row shows the explanation generated with the additional diversity term applied. The bottom row shows the similarity after masking the spectrogram with the generated mask. The figure demonstrates how the additional diversity term enhances the sensitivity of the generated masks to different text prompts.

This figure shows 2D histograms comparing mask means and audio-text similarities after masking audio. The left panel shows results without the diversity term (Equation 7), and the right panel shows results with it. The color intensity represents the frequency of data points in each bin. The x-axis shows the similarity between the text prompt and masked audio, while the y-axis shows the average value (mean) of the mask. The figure demonstrates how the additional diversity term enhances the sensitivity of the generated explanations to different text prompts, resulting in a clearer relationship between similarity and mask means.
More on tables

This table presents a quantitative comparison of different explanation methods (GradCam, GradCam++, SmoothGrad, IG, and LMAC-ZS) on the ESC50 dataset under various out-of-domain conditions. Each condition involves adding a different type of noise (ESC50 contamination, White Noise contamination, and LJ-Speech contamination) to the audio samples, simulating real-world scenarios with noisy audio. The table reports faithfulness metrics (AI, AD, AG, FF, Fid-In, SPS, COMP) for each method and condition, allowing for an assessment of the quality and reliability of the explanations generated under various degrees of audio contamination. Two versions of LMAC-ZS are included, trained on the Clotho dataset only (CT) and trained on the full CLAP dataset (Full). The Mask-Mean (MM) column indicates the average value of the generated saliency masks. The performance of each explanation method is evaluated in terms of how well the explanations align with the predictions made by the underlying model and how robust the explanations are to noise.

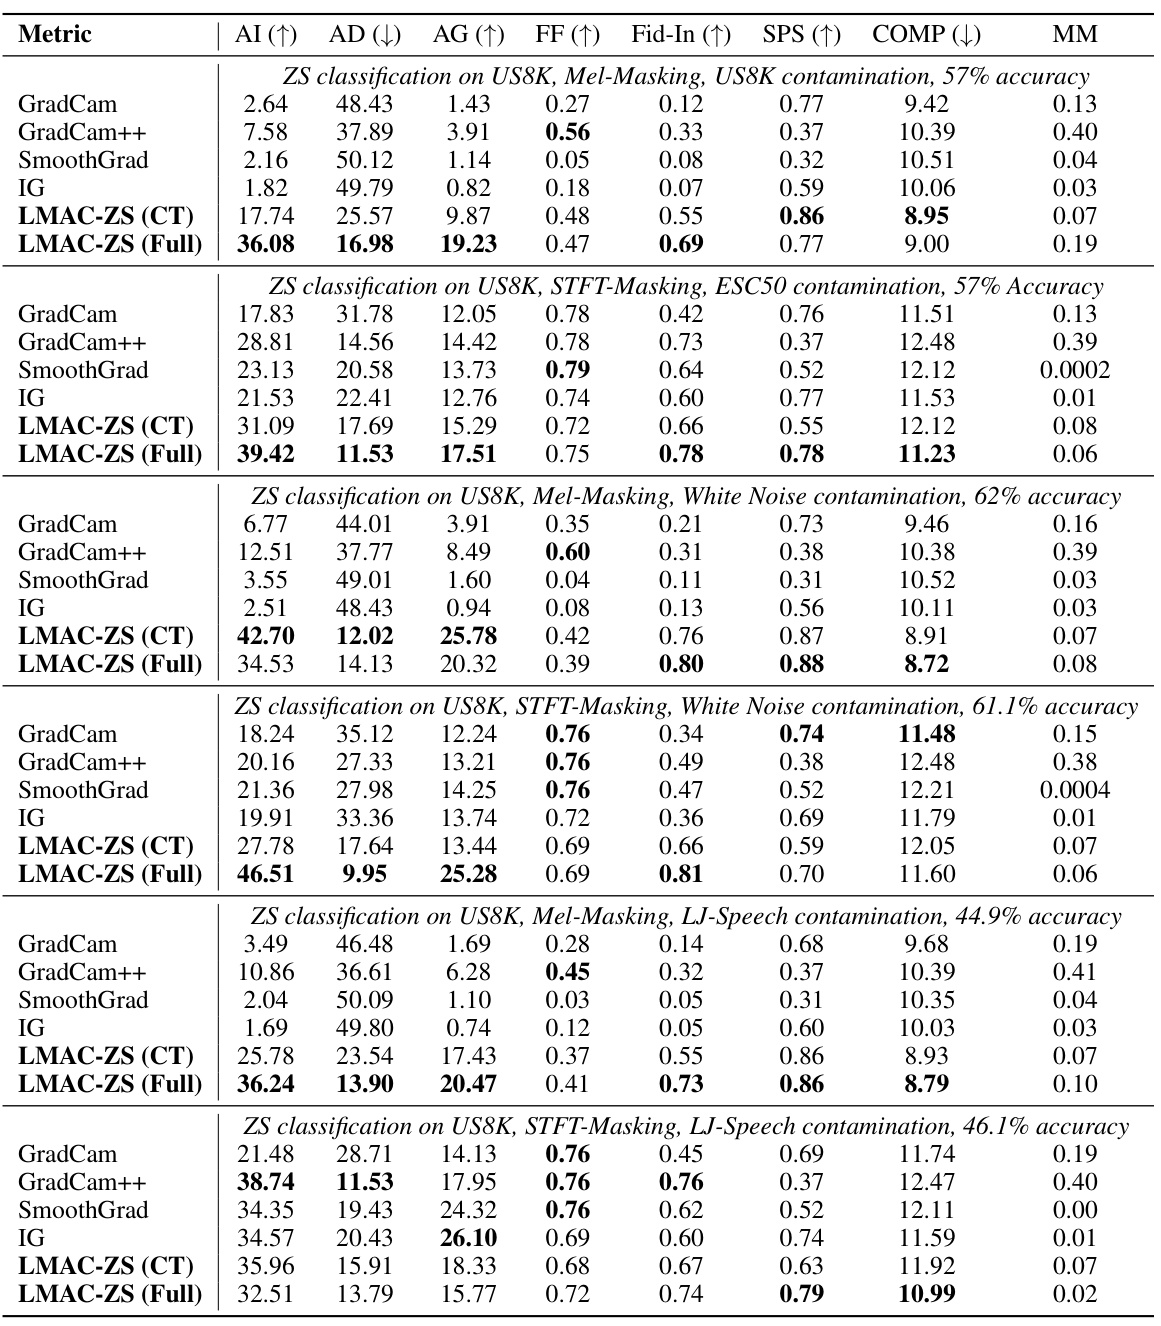
This table presents a quantitative comparison of LMAC-ZS and several baseline methods (GradCam, GradCam++, SmoothGrad, and IG) for zero-shot audio classification on the ESC50 dataset under various out-of-domain conditions (ESC50 contamination, White Noise contamination, LJ-Speech contamination). The metrics used to evaluate the faithfulness of the explanations include Average Increase (AI), Average Drop (AD), Average Gain (AG), Faithfulness on Spectra (FF), Input Fidelity (Fid-In), Sparseness (SPS), and Complexity (COMP). Two versions of LMAC-ZS are shown, one trained only on Clotho dataset and the other trained on the full CLAP dataset. The table also includes the Mask-Mean (MM), representing the average value of the obtained masks. It demonstrates the performance of LMAC-ZS under noisy and different-source audio conditions, highlighting its robustness and reliability in generating faithful explanations even in challenging scenarios.

This table presents a quantitative comparison of the performance of different explanation methods, including LMAC-ZS (trained on Clotho dataset only and trained on all CLAP datasets), GradCAM, GradCAM++, SmoothGrad, and Integrated Gradients on two audio classification datasets, ESC50 and UrbanSound8K. The evaluation metrics used include Average Increase (AI), Average Drop (AD), Average Gain (AG), Faithfulness on Spectra (FF), Input Fidelity (Fid-In), Sparseness (SPS), and Complexity (COMP). The table shows the performance of each method for Mel-Masking and STFT-Masking, along with the overall accuracy achieved by the zero-shot classifier. Mask-Mean (MM), representing the average value of the obtained masks, is also provided.

This table shows the Frechet Audio Distance (FAD) between the ESC-50 dataset and the datasets used for training the LMAC-ZS model. The FAD measures the dissimilarity between the distributions of audio features in two datasets. Lower FAD values indicate greater similarity. The table helps to understand how similar the training data distribution is to the ESC-50 test data, which could influence the model’s performance in the zero-shot classification task. The different rows represent different training subsets used for experiments. The column
Subset (25%)refers to a randomly selected 25% of the full training dataset.
Full paper#


