↗ OpenReview ↗ NeurIPS Homepage ↗ Chat
TL;DR#
Fair division of resources, like cake-cutting, is often studied as a one-time event. However, many real-world scenarios involve repeated allocation, such as sharing computational resources or classroom space. This paper investigates repeated fair division between two players, examining both sequential (Bob observes Alice’s cut) and simultaneous (Bob doesn’t observe Alice’s cut before making a choice) versions of the repeated cut-and-choose game. It highlights a strategic vulnerability where a player who consistently chooses their preferred piece can be exploited.
The core of the paper lies in its analysis of the limits of exploitation and its demonstration that fair outcomes are achievable. Using Blackwell’s approachability theorem, it shows how Alice can guarantee a nearly fair share while keeping Bob’s share near 1/2. The authors extend this analysis to the simultaneous game and explore a natural dynamic known as fictitious play, showing its convergence to a fair outcome. This work provides new tools for understanding strategic behavior in dynamic settings and designing fair allocation mechanisms.
Key Takeaways#
Why does it matter?#
This paper is crucial for researchers in fair division and game theory. It provides novel insights into strategic interactions in repeated games and introduces new techniques for analyzing dynamic resource allocation problems. The results offer valuable theoretical contributions and potentially impact the development of more equitable resource allocation mechanisms in various settings.
Visual Insights#

This figure illustrates the density functions for Alice and Bob’s valuations over a cake represented by the interval [0,1]. The figure shows two scenarios: (a) identifies the midpoints mA and mB for Alice and Bob, respectively, which divide the cake into two halves based on their individual valuations. (b) shows the shaded area which represents Alice’s Stackelberg value. The Stackelberg value is Alice’s utility when she makes a cut at Bob’s midpoint, and Bob chooses his preferred piece. The difference in the shaded area from 1/2 highlights how Alice can potentially gain more than half of the cake based on her strategic cut and Bob’s valuation.
In-depth insights#
Repeated Cake Cuts#
The concept of “Repeated Cake Cuts” introduces a dynamic not typically explored in traditional fair division problems. It moves beyond the single-instance allocation and introduces a temporal dimension where the same division problem is repeated over time. This is a more realistic model reflecting situations involving repeated resource allocation. The paper likely investigates strategies players might employ in this scenario, highlighting the interplay between short-term gains and long-term consequences. For example, a myopic player focused on immediate advantage might be systematically exploited by a more strategic player over many rounds. Analyzing the limits of exploitation becomes a key research question—determining if perfectly equitable outcomes are possible over time or if some level of inequality inevitably persists. The study would almost certainly examine various strategic approaches, including simple greedy strategies and potentially more sophisticated algorithms like fictitious play. The analysis of repeated games often involves theoretical concepts from game theory, like approachability and regret minimization, to characterize player performance and evaluate different strategic approaches. The implications of this research could extend to many areas beyond cake cutting, such as resource allocation in computer systems or fair division of environmental resources.
Exploiting Bob#
The section ‘Exploiting Bob’ likely details how Alice can strategically manipulate Bob in a repeated cake-cutting game. Alice’s exploitation hinges on Bob’s predictability, perhaps due to myopia (short-sightedness) or a simple strategy. The paper likely demonstrates a strategy where Alice, through actions resembling a binary search, can progressively refine her understanding of Bob’s preferences. This allows her to secure a larger share of the cake in the long run. Alice’s gains are directly linked to Bob’s predictability: the more consistently Bob chooses his preferred piece, the more effectively Alice can exploit this pattern. The analysis likely examines limits on exploitation, exploring whether complete exploitation is feasible, and potentially demonstrating bounds on how much Alice can gain. The research might introduce novel game-theoretic techniques or extend existing ones to model this scenario of repeated interactions. Blackwell approachability might be mentioned, as it’s commonly used to analyze repeated games and is related to limiting the other player’s payoff.
Equitable Payoffs#
The section on “Equitable Payoffs” delves into the fairness aspects of repeated cake-cutting games. It moves beyond the potential for exploitation shown in earlier sections, exploring strategies that guarantee near-equitable outcomes for both players. This involves analyzing limitations to exploitation, showing that while one player might attempt to gain an unfair advantage, the other can employ strategies to prevent excessive deviation from a fair (1/2, 1/2) split. Blackwell’s approachability theorem is leveraged to prove the existence of strategies that ensure equitable payoffs in the limit. Crucially, the analysis distinguishes between sequential and simultaneous settings, showcasing variations in strategic opportunities and demonstrating that fairness remains achievable even in the more challenging simultaneous setting, although guarantees might differ in nature (e.g., expected versus guaranteed payoffs). The results highlight the importance of considering repeated interactions when evaluating fairness in resource allocation problems and that even with strategic players, equitable outcomes are often achievable through careful strategy selection.
Fictitious Play#
The section on “Fictitious Play” analyzes a classic learning dynamic in game theory, where players iteratively best respond to the empirical distribution of their opponent’s past actions. Convergence to Nash equilibrium is a key focus, particularly in the context of repeated cake-cutting games with continuous action spaces. The authors investigate the convergence rate of this dynamic in the specific setting they present, showing that it approaches the equitable utility profile of (1/2, 1/2) at a rate of O(1/√T). This result highlights the long-run fairness properties of fictitious play, even though individual rounds may deviate from perfect equity. The analysis likely involves demonstrating how the players’ strategies and the empirical distributions evolve over time, converging towards a stable, equitable outcome. The rate of convergence O(1/√T) provides a quantitative measure of the learning efficiency in this model, showing that the players learn to achieve equitable outcomes relatively quickly but not instantly. While convergence is demonstrated, the specifics of the proof are not provided in this excerpt; this proof would likely make extensive use of mathematical tools from game theory and probability theory to bound the difference between players’ payoffs and the equitable outcome over time.
Future Work#
The research paper’s “Future Work” section presents exciting avenues for extending the current findings. Investigating alternative regret benchmarks beyond the chosen metrics could reveal interesting variations in player behavior and exploitation strategies. Exploring scenarios with richer feedback mechanisms, such as players taking turns cutting and choosing, or allowing the division of the cake into multiple parts, would add complexity and potentially uncover different equilibrium dynamics. Incorporating cake heterogeneity with both “good” and “bad” portions could significantly alter strategic choices and lead to new types of fair division challenges. Finally, developing models that explicitly consider behavioral aspects such as risk aversion or bounded rationality would move the work closer to real-world cake-cutting scenarios.
More visual insights#
More on figures

This figure shows the results of a simulation of the fictitious play dynamic for a randomly generated instance of valuations. The x-axis represents the round number (time), and the y-axis represents the average payoff for each player up to that round. The blue line shows Alice’s average payoff, and the red line shows Bob’s average payoff. The figure illustrates that over time both players’ average payoffs converge to 0.5 (the equitable utility profile), which is a key finding of the paper.

This figure illustrates how Alice divides the interval [0,1] into six sub-intervals of equal value to her in the first step of her algorithm. The points a0,0 to a0,6 represent the cut points that Alice uses to divide the interval. This is part of a larger algorithm where Alice aims to exploit Bob by strategically cutting the cake to learn Bob’s preferences and obtain a larger share.

This figure shows two plots of the average payoff of Alice and Bob over time, using fictitious play dynamics in a randomly generated instance of valuations. The top plots (a) and (b) show the average payoff for Alice and Bob individually against the number of rounds, respectively. The bottom plot (c) shows how the average payoffs converge to 1/2. This figure demonstrates the convergence properties of fictitious play.

This figure shows two plots illustrating the average payoff of Alice and Bob over time using fictitious play. The x-axis represents the round number, and the y-axis represents the average payoff accumulated up to that round. The left plot shows the first 4000 rounds, while the right plot focuses on the first 4000 rounds as well, zooming in to show finer details. Both plots demonstrate how the average payoff of both players converges to 1/2 (0.5) over time, supporting the theoretical findings of the paper regarding fictitious play’s convergence to the equitable utility profile.

This figure visualizes Alice’s algorithm against a myopic Bob during the exploration phase. It shows how Alice’s strategy, a type of binary search, iteratively refines the interval [lt, rt] to approximate Bob’s midpoint (mB) based on Bob’s choices (bi). The blue and red areas represent Alice’s and Bob’s value densities, respectively. The algorithm continues until the interval [lt, rt] is sufficiently small.

This figure shows Alice’s algorithm when Bob is myopic. It consists of two phases: exploration and exploitation. In the exploration phase, Alice repeatedly cuts the cake at a point that divides the cake into two pieces of equal value to her, then observes Bob’s choice. Based on Bob’s choice, Alice updates the interval where Bob’s midpoint lies. In the exploitation phase, Alice uses the information obtained in the exploration phase to cut near Bob’s midpoint and secure a disproportionate share of the cake.

This figure illustrates how Alice divides the interval [0,1] into 6 subintervals of equal value to her. This is part of Alice’s strategy to exploit Bob in the repeated cake-cutting game. Each subinterval is represented by a different color, and the points a0,0 to a0,6 represent the boundaries of these intervals. Alice uses this discretization to conduct a form of binary search to learn Bob’s preferences over time.

This figure illustrates the first step of Alice’s algorithm in the upper bound proof of Proposition 2, where she divides the interval [0,1] into 6 subintervals of equal value to her, represented by the points a0,0, a0,1, …, a0,6. This discretization is used in Alice’s binary search-like strategy to approximate Bob’s preferences and exploit his nearly myopic behavior.

This figure illustrates how Alice divides the interval [0,1] into 6 sub-intervals of equal value to herself in the first step of her algorithm. These intervals are demarcated by points a0,0 to a0,6. This is part of a strategy where Alice exploits Bob’s myopic behavior by strategically cutting the cake to learn Bob’s preferences.

This figure illustrates the first step in Alice’s strategy to exploit a myopic Bob in the repeated cake cutting game. Alice divides the cake [0,1] into 6 sub-intervals of equal value to her. This step is part of an iterative algorithm where the sub-intervals are repeatedly refined to identify Bob’s midpoint and allow Alice to gain a larger share of the cake.

This figure shows Alice’s algorithm in the exploration phase against a myopic Bob. Alice’s and Bob’s densities are depicted, with their respective midpoints. The algorithm uses a binary search approach to iteratively shrink an interval containing Bob’s midpoint, based on Bob’s choices (L or R). The figure illustrates how the interval decreases exponentially over time, approaching Bob’s midpoint.

This figure illustrates how Bob divides the cake into intervals in the repeated cake-cutting game. Bob’s strategy involves dividing the cake [0,1] into P = √T (rounded down) intervals of equal value to him. The figure shows an example for T=10, resulting in 4 intervals. Each interval has a value of 1/P for Bob. This division is a key element of Bob’s strategy to guarantee a fair share of the cake.

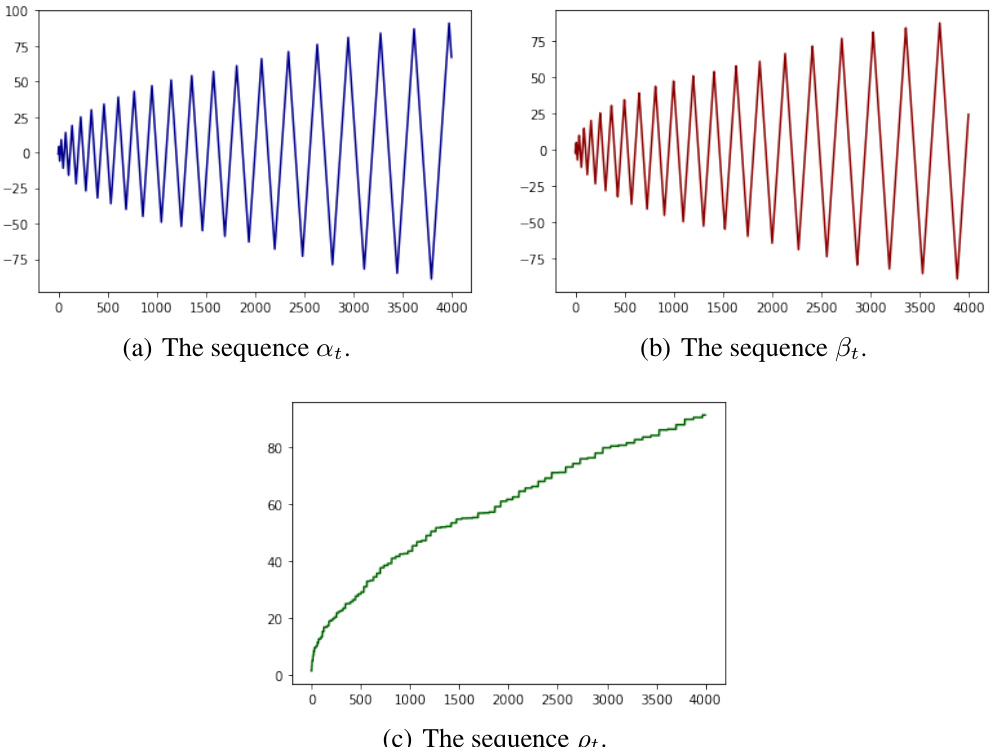
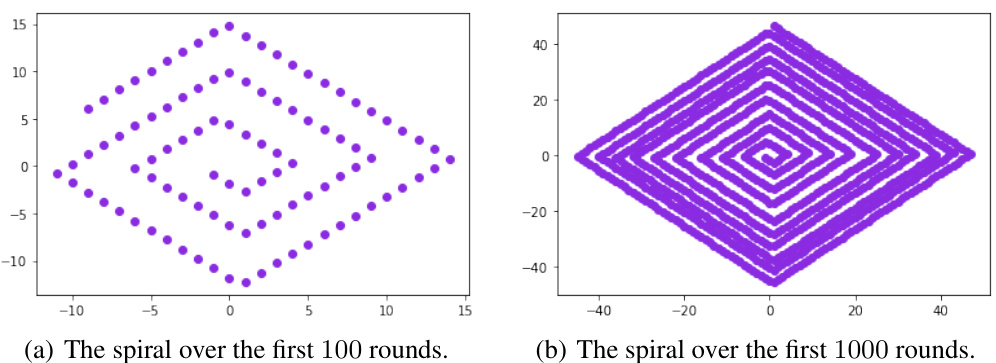
This figure illustrates the dynamics of the variables at and βt in fictitious play. (a) shows the overall dynamics as a counterclockwise spiral around the origin. (b) shows how the dynamics are symmetric with respect to reflection across the origin, which is proved in Lemma 13.

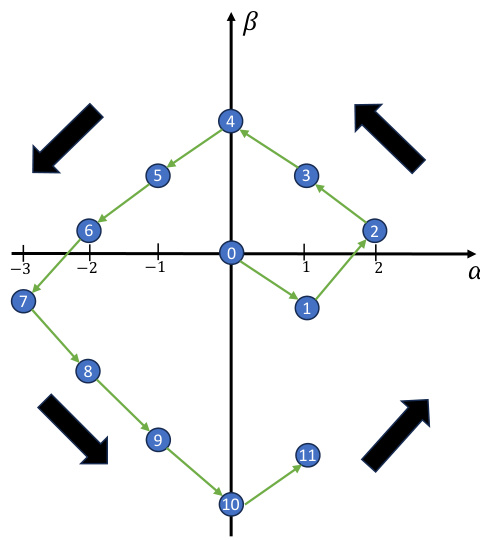
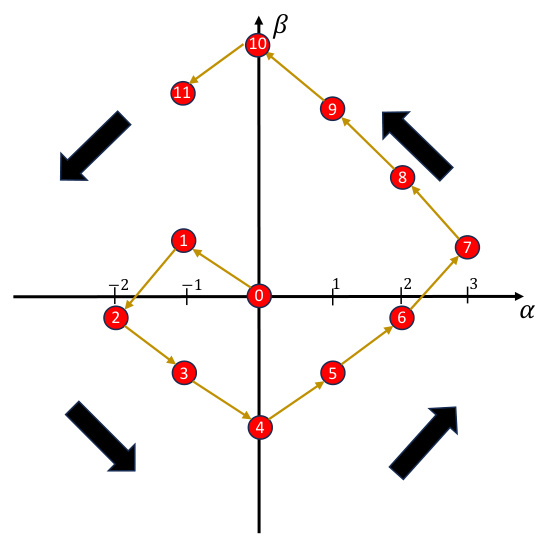
This figure shows the dynamics of αt and βt in fictitious play. The x-axis represents αt and the y-axis represents βt. The blue circles show the path through the α-β plane that results from fictitious play. The number in the circle indicates the time step t. Note that αt is always an integer while βt can take non-integer values. Subfigure (b) shows a similar illustration when the tie-breaking rules are reversed, which demonstrates a symmetry in the dynamics. The key takeaway is that regardless of the tie-breaking rules, the value of pt and ut remains the same.

This figure illustrates the dynamics of the variables α and β in fictitious play. Part (a) shows a counterclockwise spiral around the origin, where each point represents a round in the game. Part (b) shows that the spiral is symmetric about the origin, which is useful for simplifying the analysis.

This figure illustrates the dynamics of fictitious play using the variables αt and βt. Figure (a) shows a counterclockwise spiral around the origin, where each point represents the values of αt and βt at a specific round. Figure (b) demonstrates the rotational symmetry of the dynamics, highlighting that reflecting the points across the origin results in equivalent dynamics. The symmetry is established by Lemma 13, which is crucial to simplify analysis.
Full paper#


