TL;DR#
Discovering formulas for mathematical constants is a longstanding challenge. Existing AI methods struggle due to the need for infinite precision, lacking effective distance metrics to guide automated searches. This research introduces a new methodology to overcome this challenge by focusing on the convergence dynamics of the formulas, rather than their numerical values. This enables the development of novel metrics and a clustering algorithm to automatically categorize and identify mathematical formulas based on shared dynamical properties.
The proposed method was tested on a massive dataset of polynomial continued fractions, resulting in the identification of numerous known formulas and the discovery of previously unknown formulas for fundamental constants such as π, ln(2), Gauss’, and Lemniscate’s constants. The success showcases the potential of this dynamic-based approach to accelerate mathematical discovery and opens exciting opportunities for developing more general AI models capable of generating formulas with desired mathematical properties.
Key Takeaways#
Why does it matter?#
This paper is crucial because it introduces a novel methodology for discovering mathematical formulas for constants, a task previously considered extremely challenging. Its success in finding both known and unknown formulas for key constants opens up new avenues for AI-driven mathematical discovery and accelerates the rate of scientific progress. By focusing on convergence dynamics rather than numerical values, the method overcomes a major hurdle in the field. This work is relevant to researchers in AI, mathematics, and scientific computing, offering a powerful new tool for automated formula discovery and potentially paving the way for more general models that create formulas with specified properties.
Visual Insights#
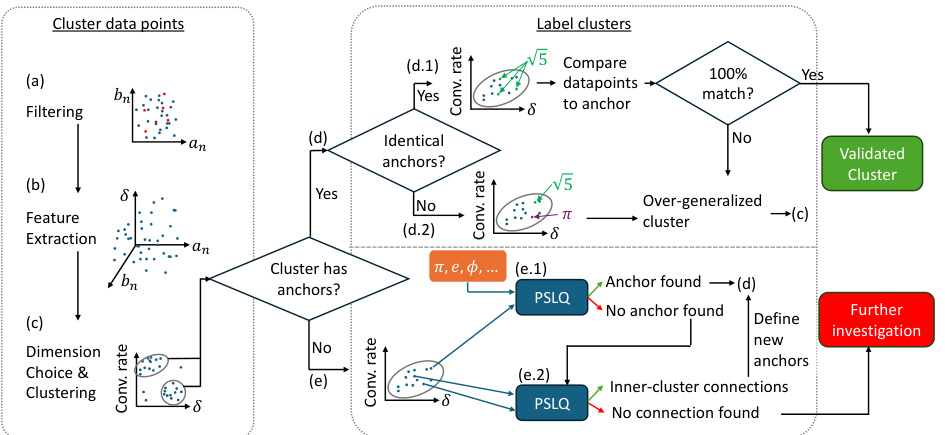
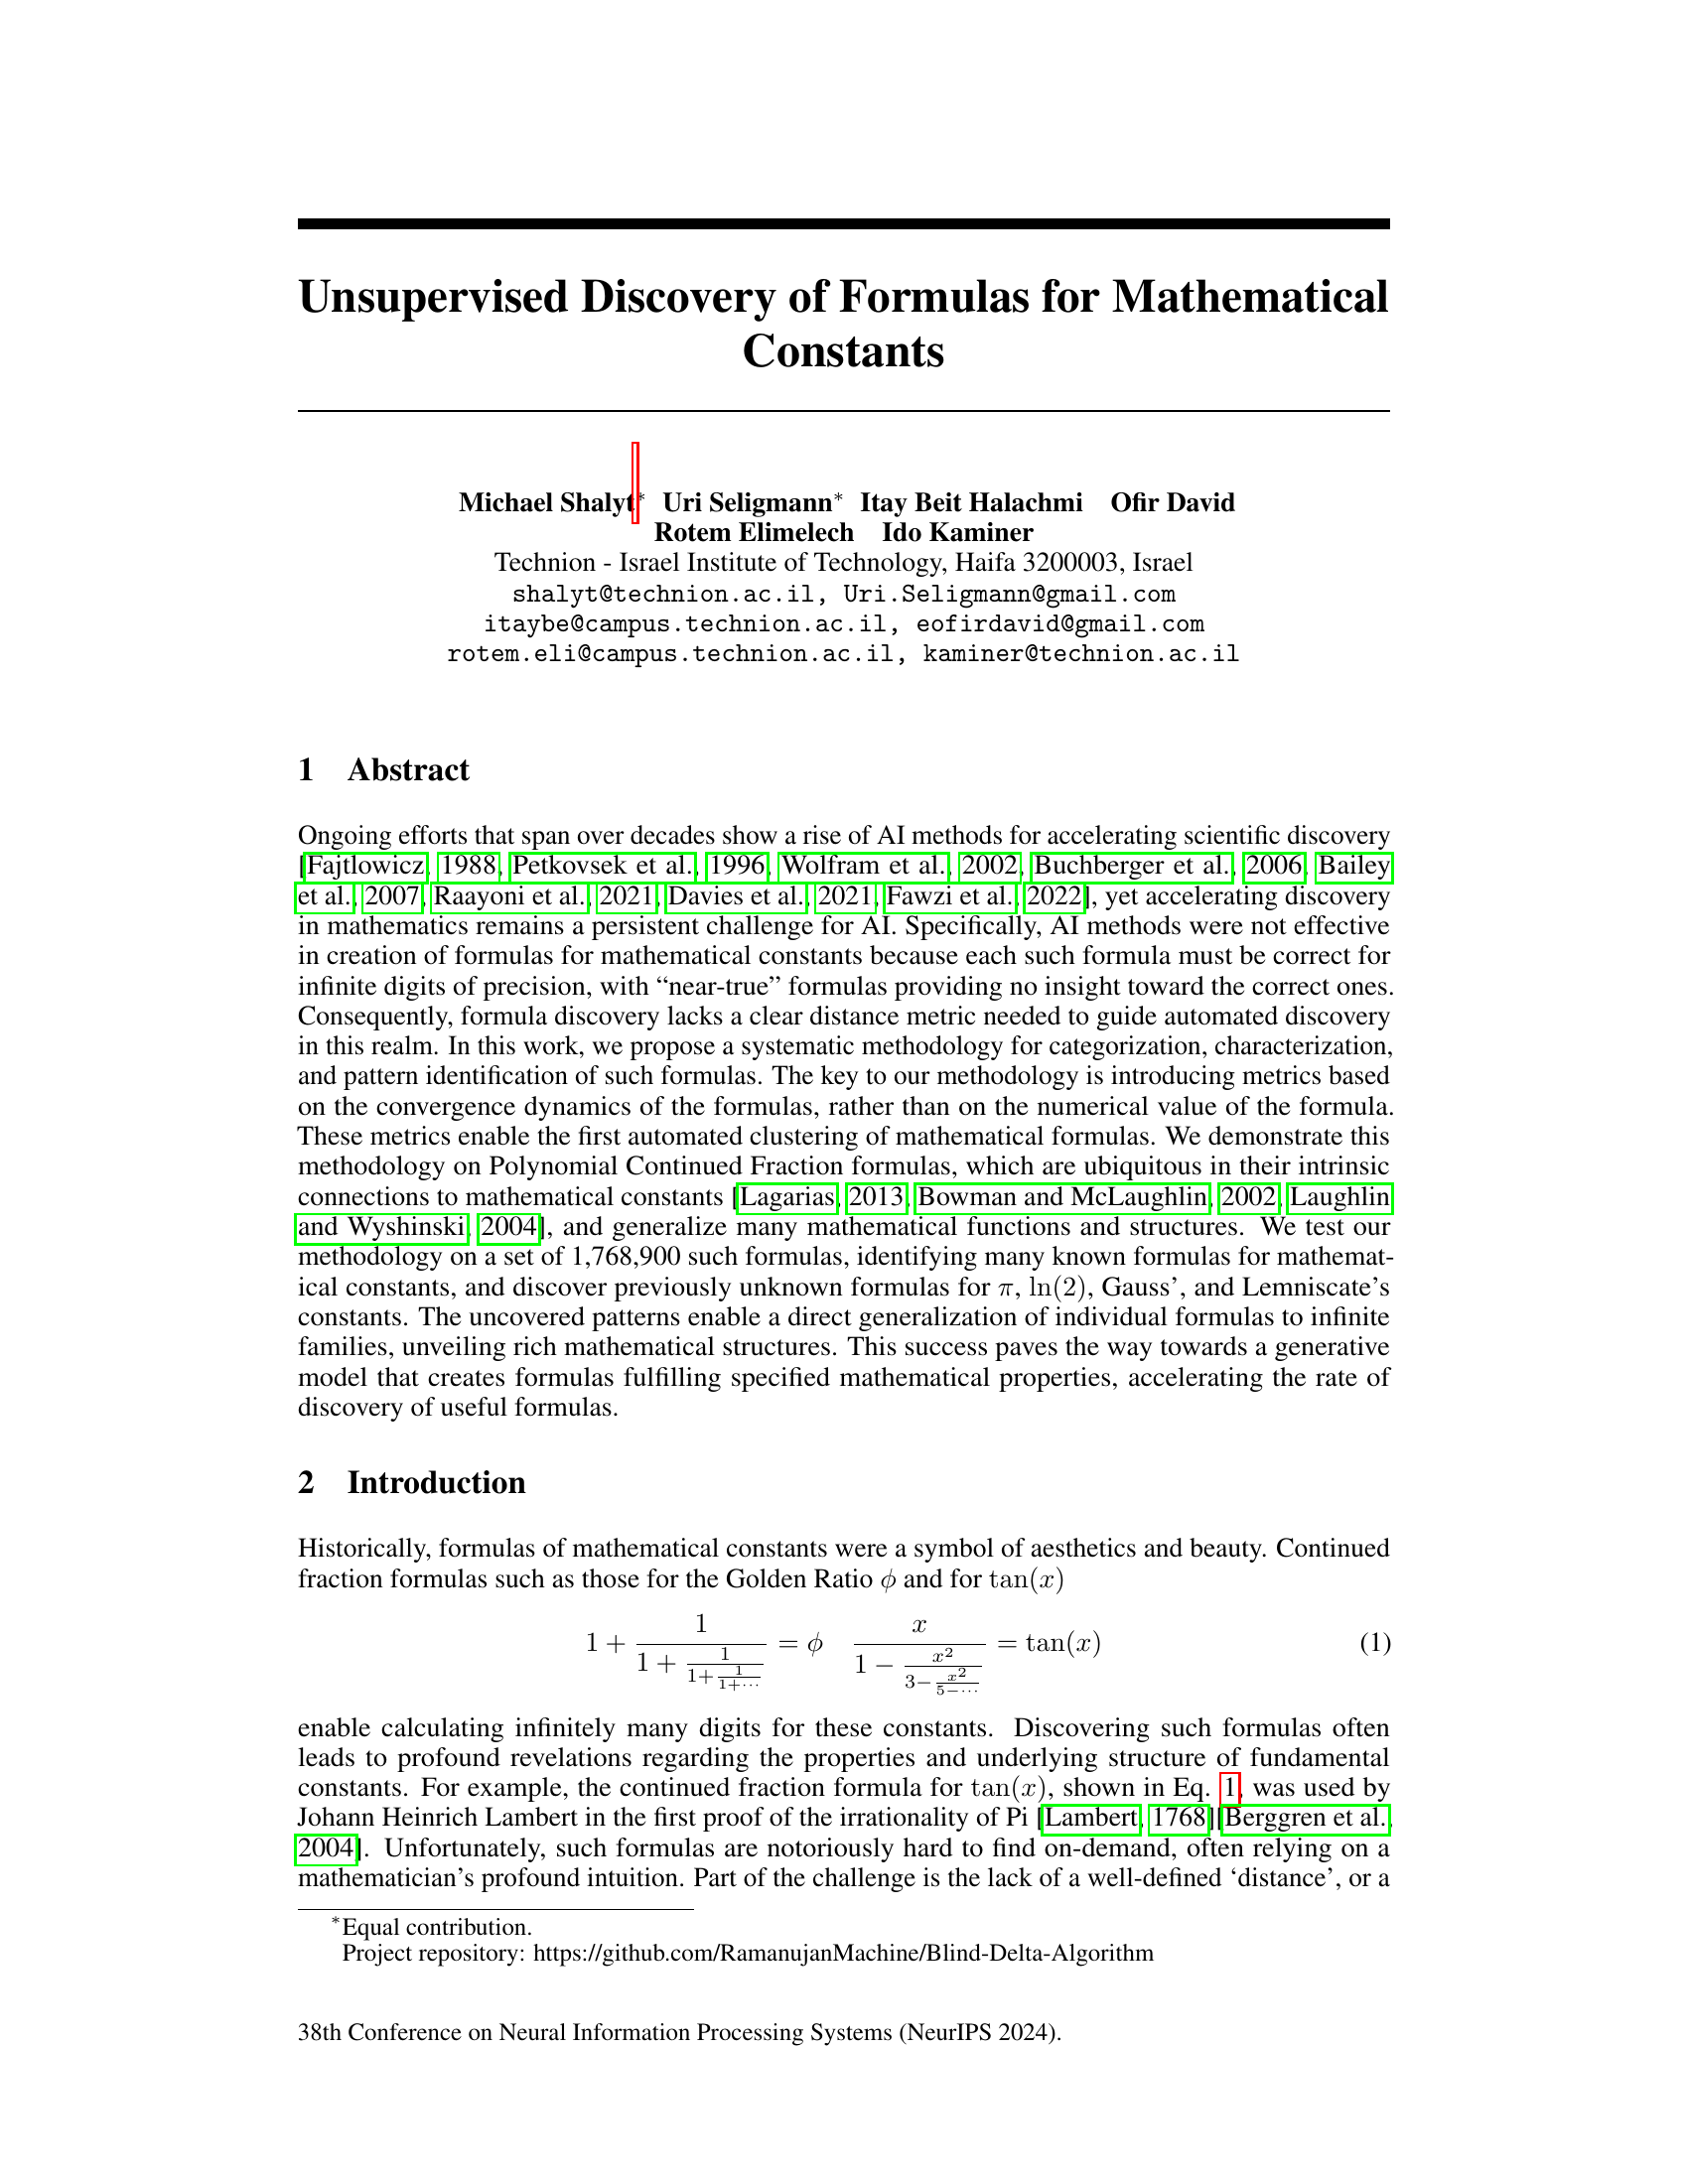
🔼 This figure illustrates the two-stage methodology for clustering and labeling polynomial continued fraction (PCF) formulas based on their dynamical metrics. The first stage involves filtering, feature extraction (using dynamical metrics like irrationality measure and convergence rate), and clustering PCFs with similar metric values. The second stage focuses on labeling clusters by identifying known formulas (anchors) within them and validating the association of other formulas in the cluster to the same constant. If no anchors are found, further investigation using PSLQ is employed to attempt labeling or identifying inner-cluster connections. The flowchart details the decision-making process at each step.
read the caption
Figure 1: Systematic clustering and labeling of formulas by dynamical metrics. Our methodology analyzes Polynomial Continued Fractions (PCFs) in two main stages. Clustering: (a) Filter degenerate PCFs. (b) Evaluate PCFs and extract their dynamics-based metrics (section 3). (c) Choose the best few metrics and use them to cluster the data. Labeling: In every cluster, look for PCFs known in the literature and use them as anchors. (d) If anchors are found in the cluster, validate that they do not contradict, i.e., relate to different constants. (d.1) If all anchors are in agreement, choose a random subset of other points in the cluster and use PSLQ to validate that they also relate to the same constant. If the validation is successful, the cluster is labeled. If not, the cluster should be split. (d.2) If the anchors relate to different constants, the cluster should be split – return to step c for finer clustering of the data. When focusing on a specific cluster, the best metrics could be different than those for the full dataset. (e) If no anchor is found in a certain cluster, attempt to label by (e.1) choosing a small subset of PCFs in the cluster and running a PSLQ search for each of them against a large set of potential constants. If a connection is found, the cluster now has an anchor – return to step d. (e.2) If an anchor is still not found, attempt to connect a sample of data points within the cluster using PSLQ. If successful, conclude that the cluster is correct, but has no identified constant. Define a new label for that cluster. If PSLQ failed to connect points within the cluster, return to step c for finer clustering. If no further refinement is appropriate, flag the cluster for further analytical investigation.
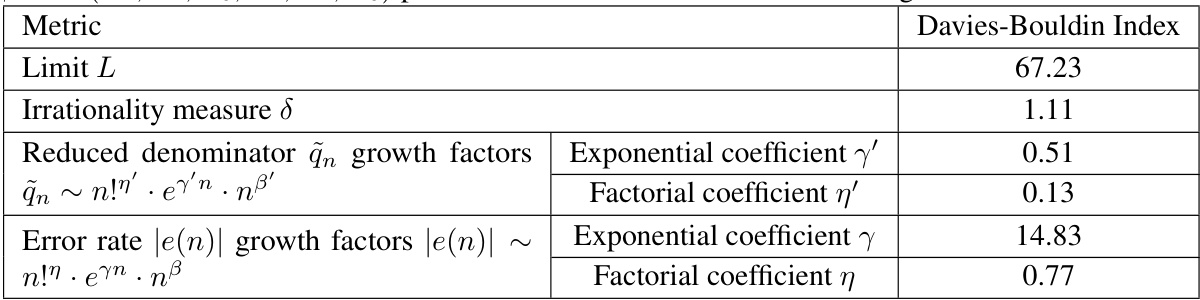
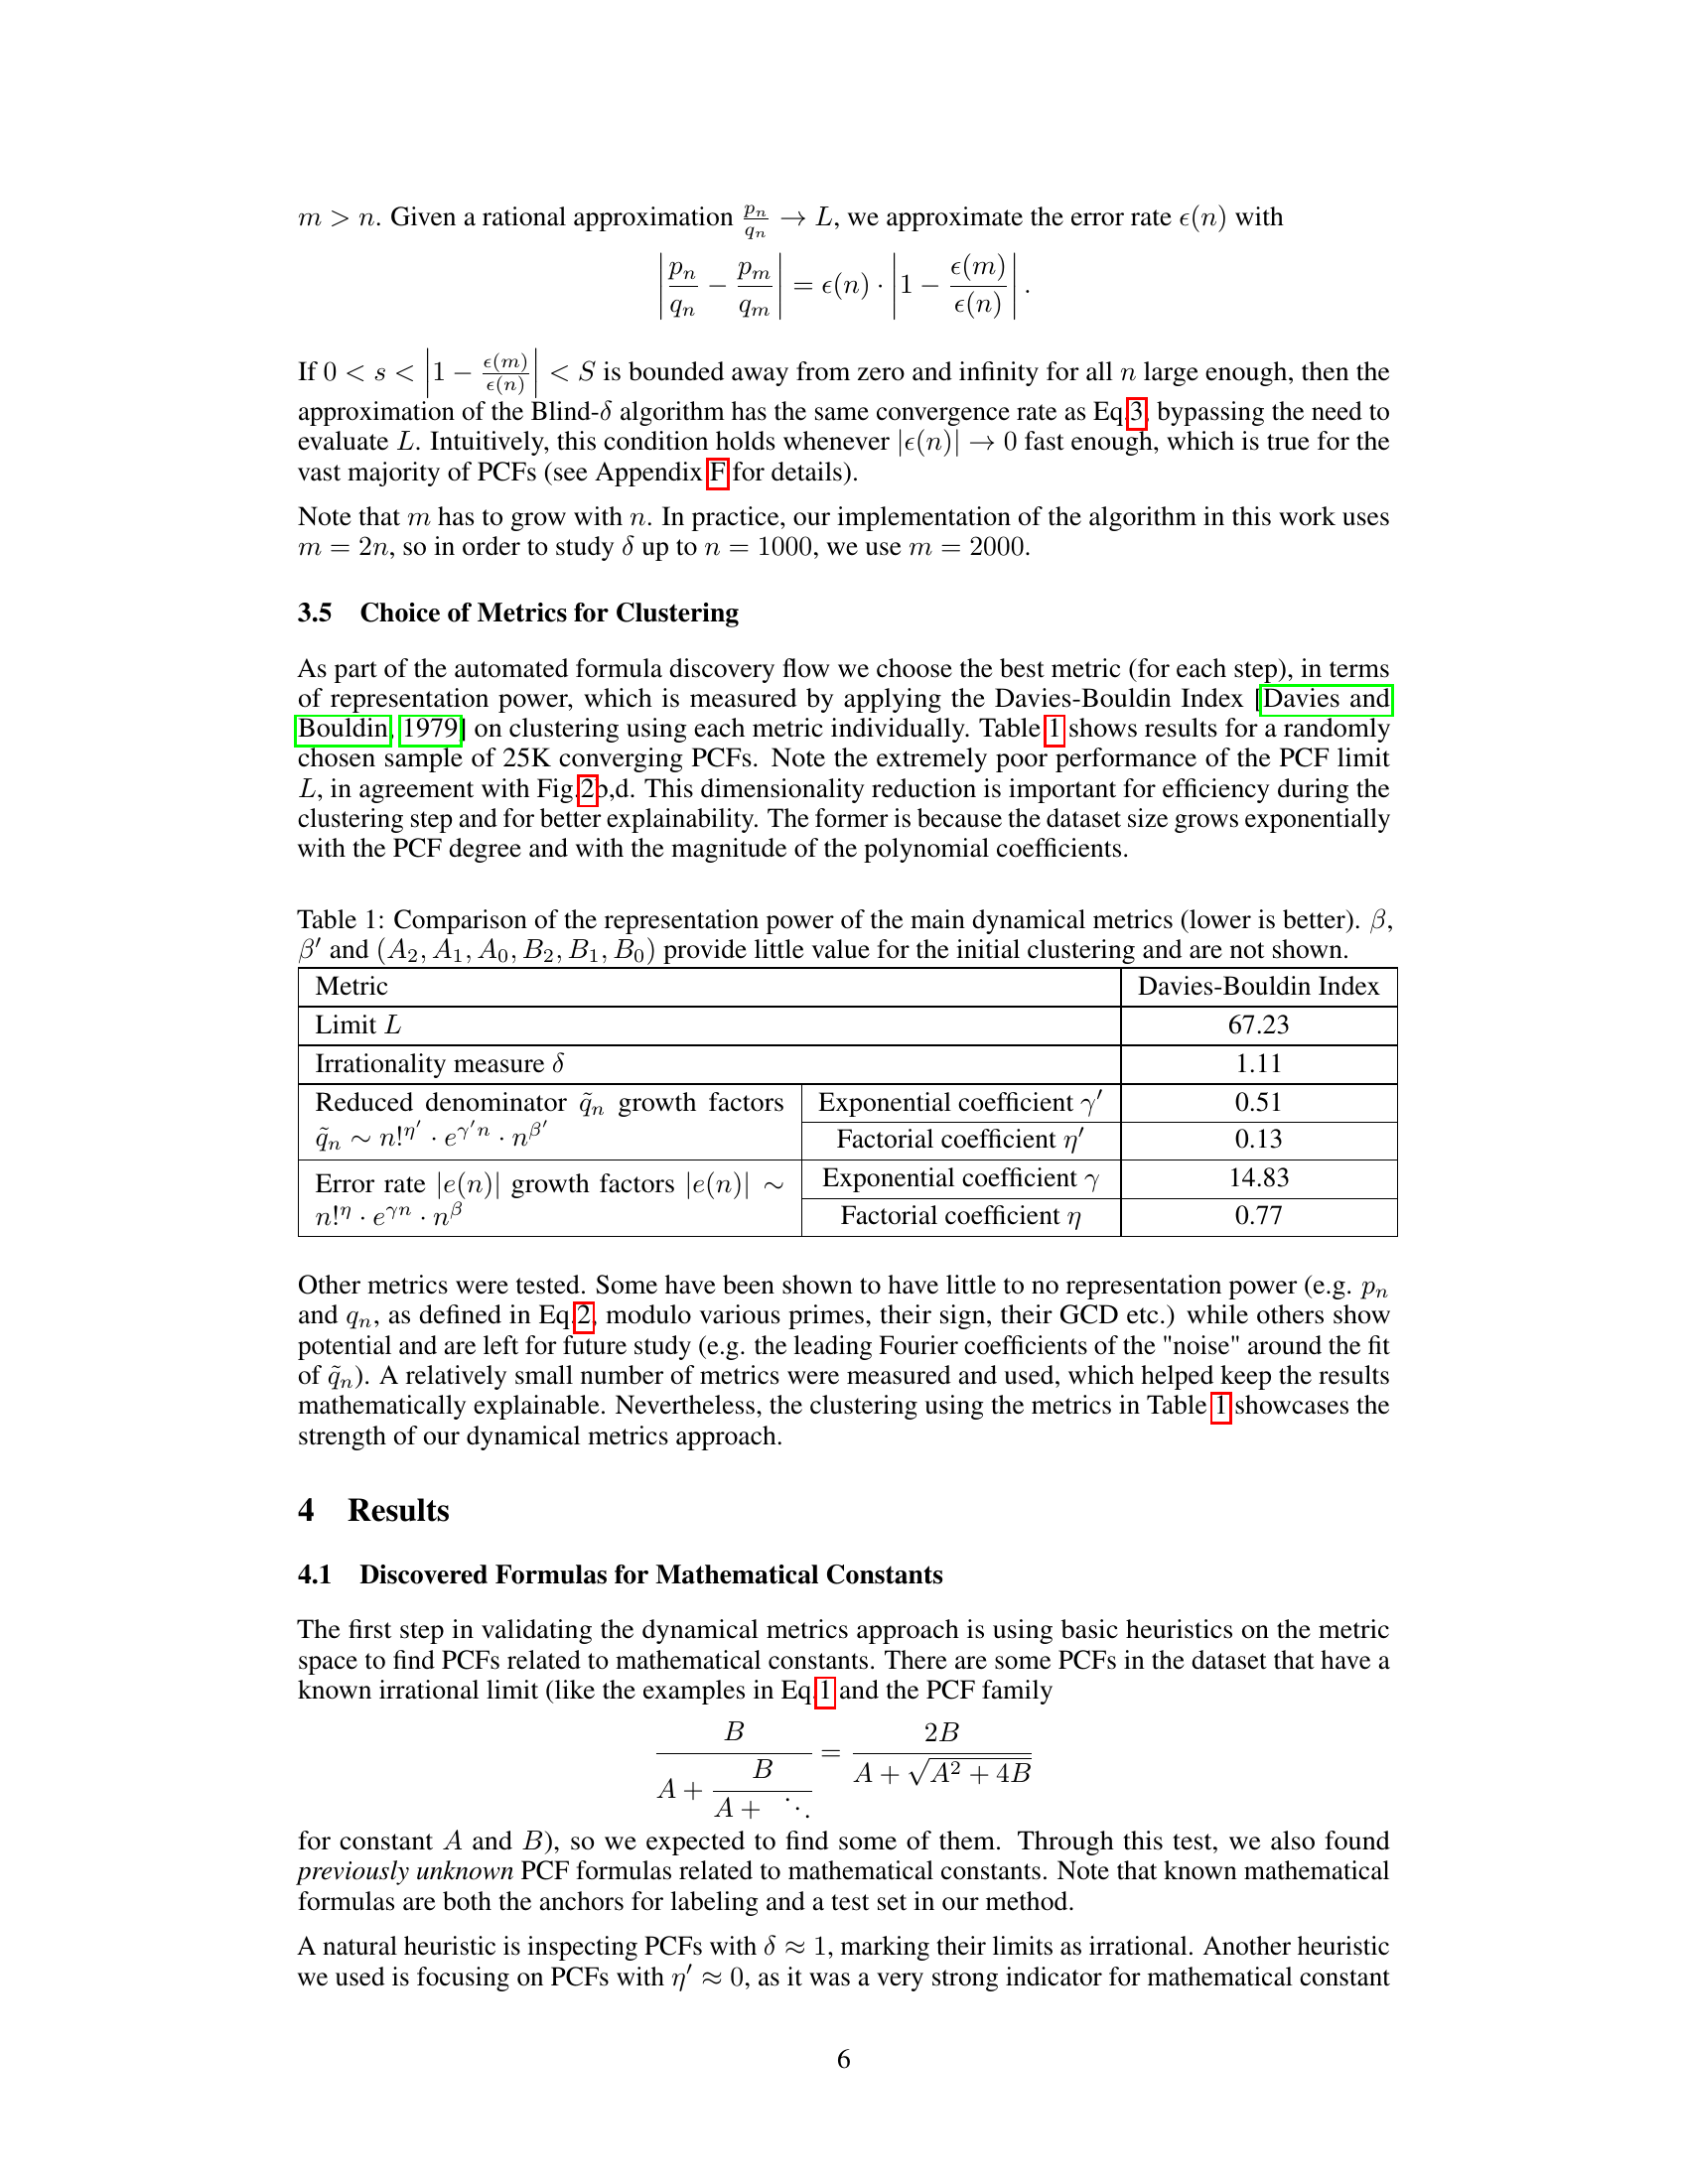
🔼 This table presents the Davies-Bouldin index for different metrics used in clustering polynomial continued fractions. A lower Davies-Bouldin index indicates better separation between clusters. The table shows that the irrationality measure (δ) and certain growth factors of the continued fraction’s denominator (qn) and error rate (e(n)) are more effective for clustering than simply using the limit (L) of the continued fraction.
read the caption
Table 1: Comparison of the representation power of the main dynamical metrics (lower is better). β, β' and (A2, A1, A0, B2, B1, Bo) provide little value for the initial clustering and are not shown.
In-depth insights#
Formula Discovery#
The formula discovery process detailed in this research paper centers on unsupervised learning techniques applied to a vast dataset of polynomial continued fractions (PCFs). A key innovation is the utilization of dynamical metrics, derived from the convergence behavior of PCFs, rather than solely relying on numerical values. This approach allows for the automated clustering of formulas based on their underlying mathematical structure. The paper demonstrates the effectiveness of this method by discovering both known and novel formulas for mathematical constants like π, ln(2), and others, highlighting its potential to accelerate mathematical discovery by identifying patterns and relationships within large datasets. A significant advancement is the development of the Blind-δ algorithm, enabling the efficient calculation of the irrationality measure even without prior knowledge of the formula’s limit, which is crucial for evaluating the quality of formula candidates. The success of this methodology hinges on the innovative use of dynamical properties to overcome the challenges of precision-based formula discovery in mathematics, which are often intractable using traditional methods.
Dynamic Metrics#
The concept of “Dynamic Metrics” in this research paper is crucial. Instead of relying on the final numerical value of a mathematical formula, the authors focus on the convergence behavior of the formula itself. This novel approach uses metrics that capture the formula’s convergence dynamics, such as the convergence rate and the irrationality measure. This shift allows the researchers to define a meaningful “distance” between formulas, even if their limits are unknown or very close, which is a major hurdle in traditional formula discovery. This emphasis on dynamical systems theory enables the discovery of new mathematical relationships and opens up avenues for automated formula discovery. The Blind-δ algorithm, designed to efficiently compute the irrationality measure without prior knowledge of the formula’s limit, is a significant contribution. The effectiveness of this methodology is demonstrably shown through the identification of both known and novel formulas for several mathematical constants, highlighting the power of focusing on the dynamics rather than the static final value.
Blind-δ Algorithm#
The Blind-δ Algorithm presents a novel approach to calculating the irrationality measure (δ) of a continued fraction without prior knowledge of its limit. This is a significant advancement because traditionally, calculating δ requires knowing the limit, which is often unknown for many continued fractions. The algorithm cleverly bypasses this limitation by focusing on the convergence behavior of the sequence of rational approximations, comparing terms within the sequence rather than comparing to the (unknown) limit. This innovative approach allows for the efficient and accurate calculation of δ across a large dataset of continued fractions, enabling a powerful new metric for clustering and analyzing formulas for mathematical constants. The algorithm’s core strength lies in its ability to extract crucial information about the convergence dynamics, not directly from the limit itself, but from the internal structure and progression of the sequence, enabling the discovery of previously hidden mathematical structures and formulas. The Blind-δ Algorithm is instrumental to the paper’s success in discovering both known and novel formulas for mathematical constants.
Unsupervised Learning#
The application of unsupervised learning in this research is pivotal, enabling the discovery of novel mathematical formulas for constants without relying on predefined labels or human intervention. The methodology leverages dynamical metrics derived from the convergence behavior of continued fractions, capturing subtle patterns and relationships that traditional methods overlook. This unsupervised approach allows for the identification and clustering of formulas, unveiling previously unknown structures and connections among mathematical constants. The automated clustering based on these dynamic metrics proves effective in grouping formulas related to the same constant, showcasing the power of this unsupervised approach in discovering hidden relationships within the dataset and facilitating further theoretical investigations. The success of this technique, particularly in finding new formulas, suggests the potential of unsupervised learning as a powerful tool for accelerating mathematical discovery.
Future Directions#
Future research should explore applying this dynamic metric methodology to broader classes of continued fractions and other mathematical structures. Extending to higher-degree polynomials and different types of continued fractions could unlock new patterns and formulas. The development of a generative model capable of producing formulas with specific mathematical properties is a crucial next step. A focus on enhancing the efficiency and scalability of the clustering and formula validation methods is needed for handling larger datasets. Formal proofs for the numerous novel formulas discovered would significantly advance mathematical understanding. Exploring the connections between the dynamic metrics, mathematical properties of the constants, and underlying mathematical structures warrants further investigation. This interdisciplinary approach combining AI and mathematics holds immense potential for accelerating mathematical discovery and generating new conjectures.
More visual insights#
More on figures

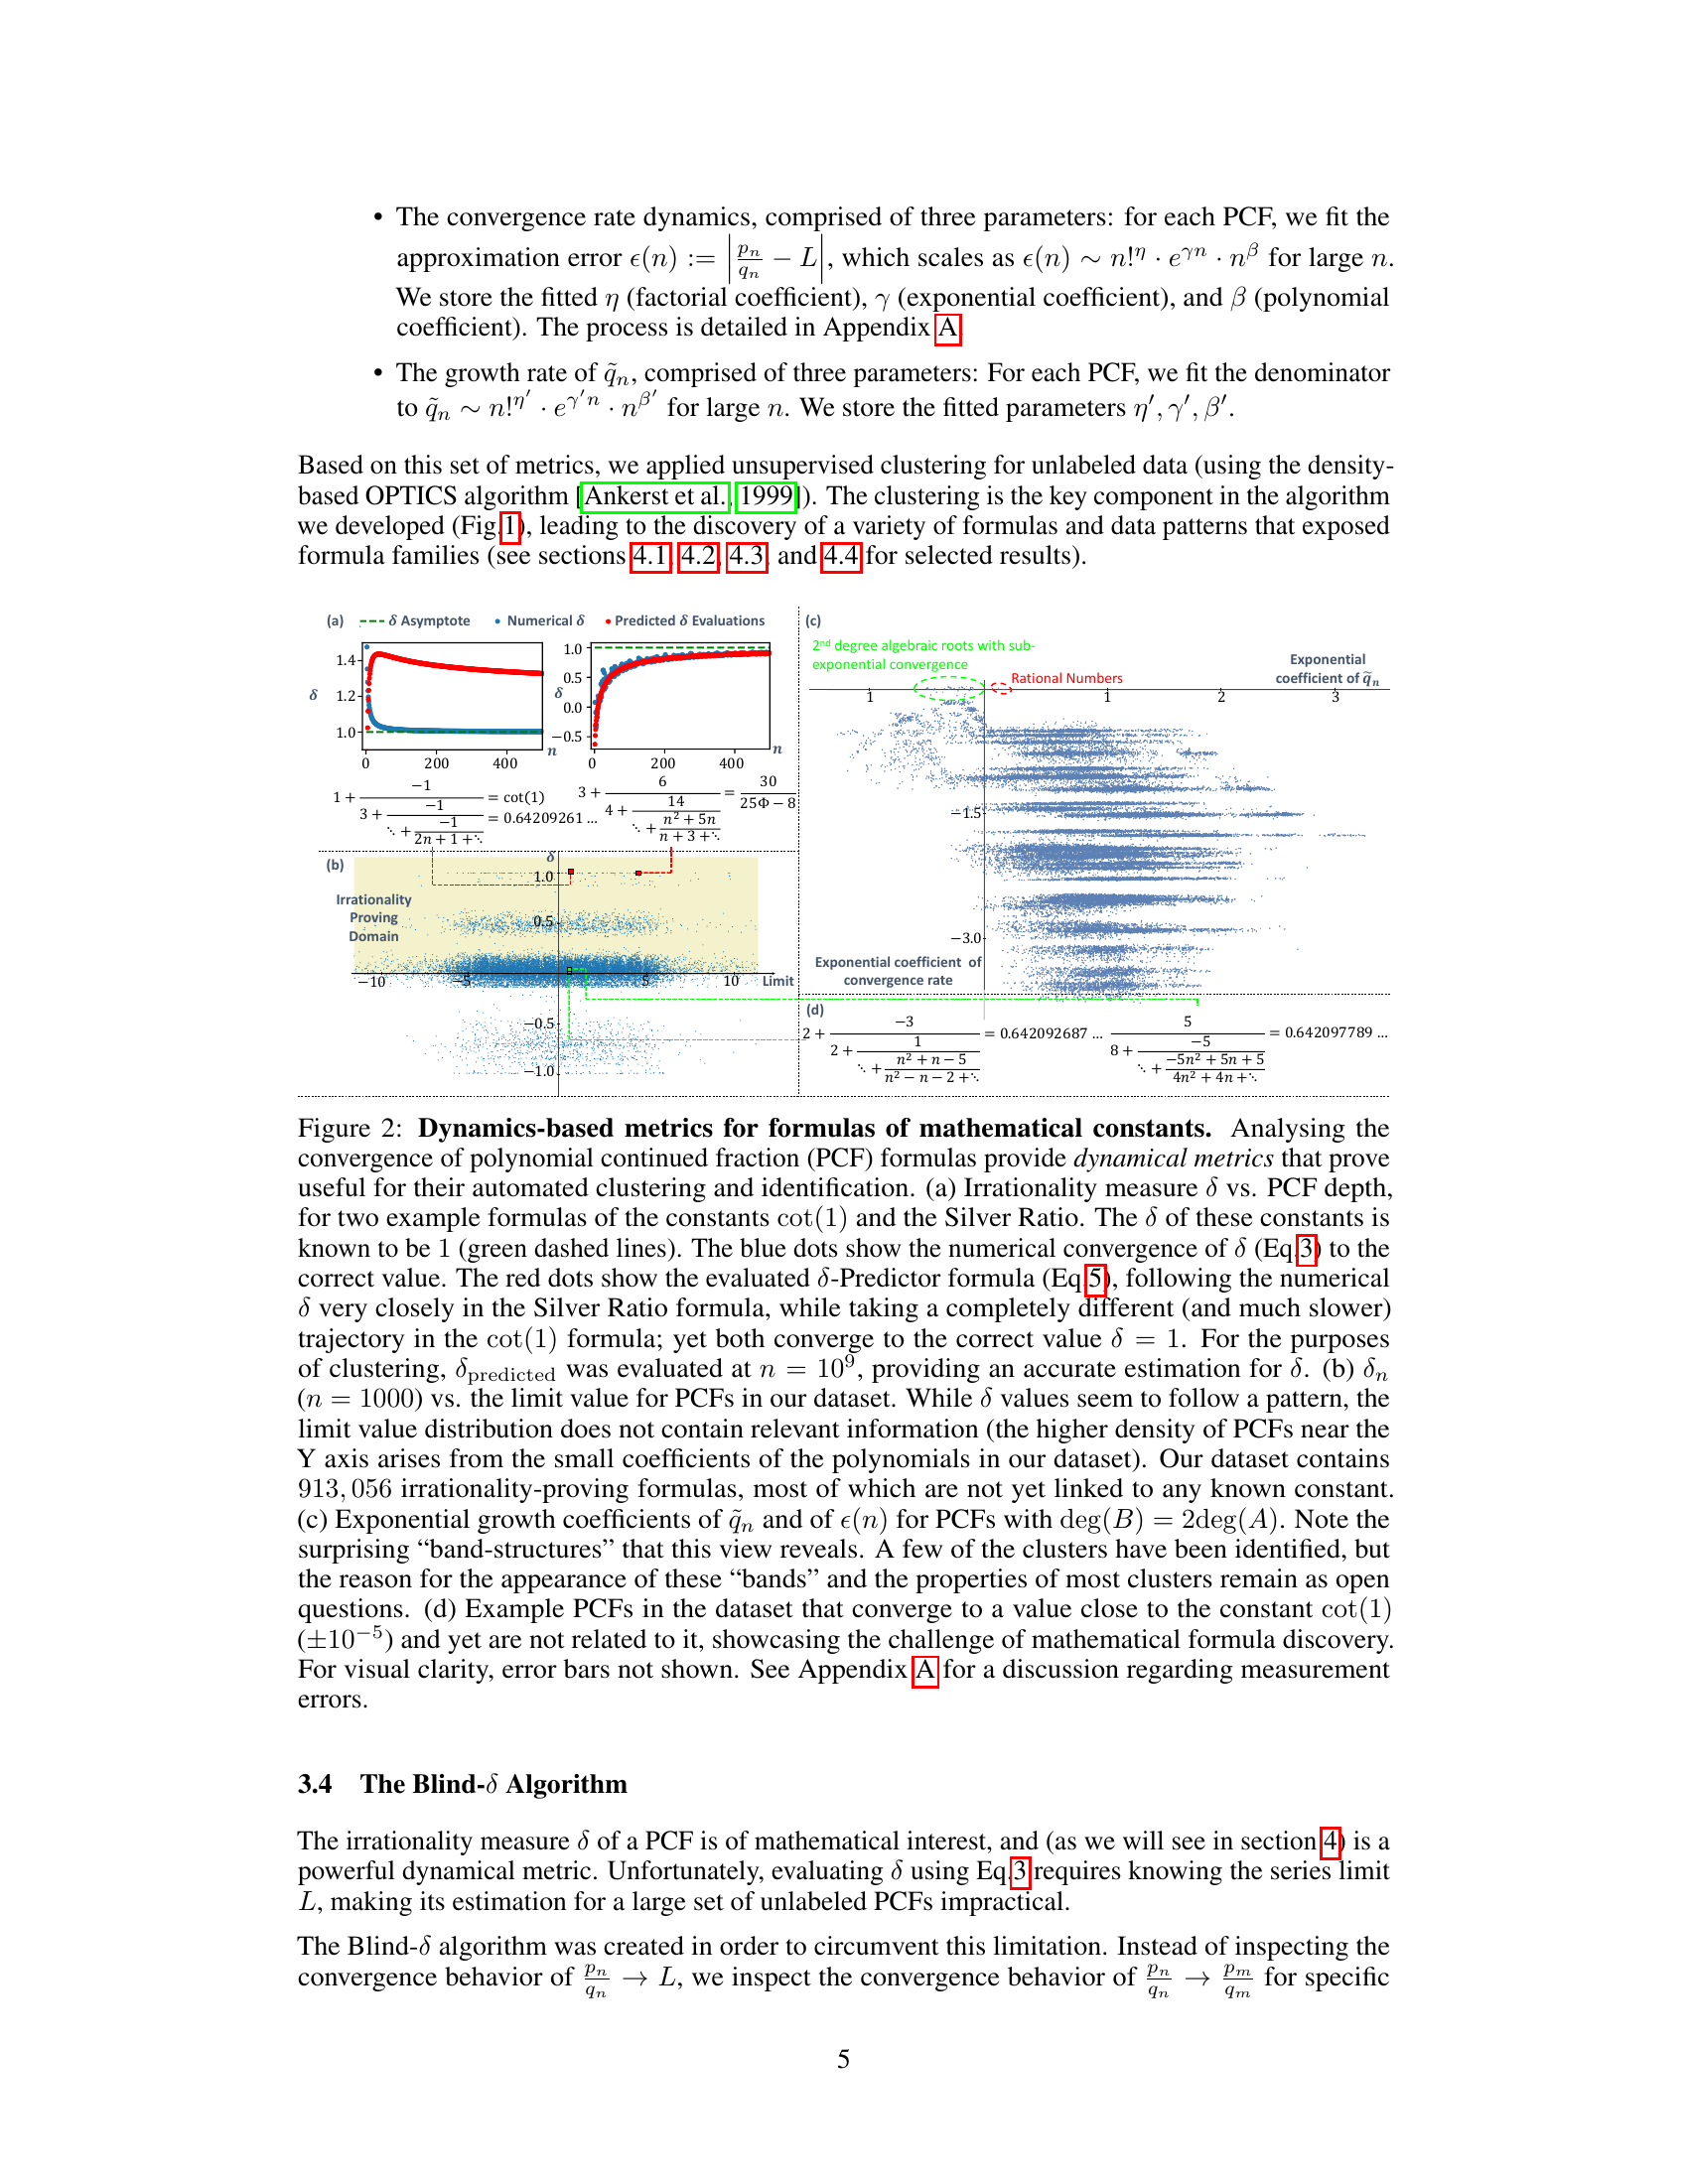
🔼 This figure shows four plots demonstrating the dynamics-based metrics used for clustering and identifying formulas for mathematical constants. Plot (a) compares the irrationality measure (δ) against PCF depth for two example formulas. Plot (b) shows the irrationality measure against the limit value for a dataset of PCFs, highlighting the lack of relevant information in the limit value distribution for clustering. Plot (c) illustrates the exponential growth coefficients of the denominator (ᾷn) and approximation error (ε(n)) for PCFs, revealing band structures indicative of underlying patterns. Plot (d) presents example PCFs that converge to values close to cot(1) but are unrelated to it, emphasizing the difficulty of mathematical formula discovery.
read the caption
Figure 2: Dynamics-based metrics for formulas of mathematical constants. Analysing the convergence of polynomial continued fraction (PCF) formulas provide dynamical metrics that prove useful for their automated clustering and identification. (a) Irrationality measure δ vs. PCF depth, for two example formulas of the constants cot(1) and the Silver Ratio. The δ of these constants is known to be 1 (green dashed lines). The blue dots show the numerical convergence of δ (Eq.3) to the correct value. The red dots show the evaluated δ-Predictor formula (Eq.5), following the numerical δ very closely in the Silver Ratio formula, while taking a completely different (and much slower) trajectory in the cot(1) formula; yet both converge to the correct value δ = 1. For the purposes of clustering, δpredicted was evaluated at n = 109, providing an accurate estimation for δ. (b) δn (n = 1000) vs. the limit value for PCFs in our dataset. While δ values seem to follow a pattern, the limit value distribution does not contain relevant information (the higher density of PCFs near the Y axis arises from the small coefficients of the polynomials in our dataset). Our dataset contains 913,056 irrationality-proving formulas, most of which are not yet linked to any known constant. (c) Exponential growth coefficients of ᾷn and of ε(n) for PCFs with deg(B) = 2deg(A). Note the surprising “band-structures” that this view reveals. A few of the clusters have been identified, but the reason for the appearance of these “bands” and the properties of most clusters remain as open questions. (d) Example PCFs in the dataset that converge to a value close to the constant cot(1) (±10−5) and yet are not related to it, showcasing the challenge of mathematical formula discovery. For visual clarity, error bars not shown. See Appendix A for a discussion regarding measurement errors.
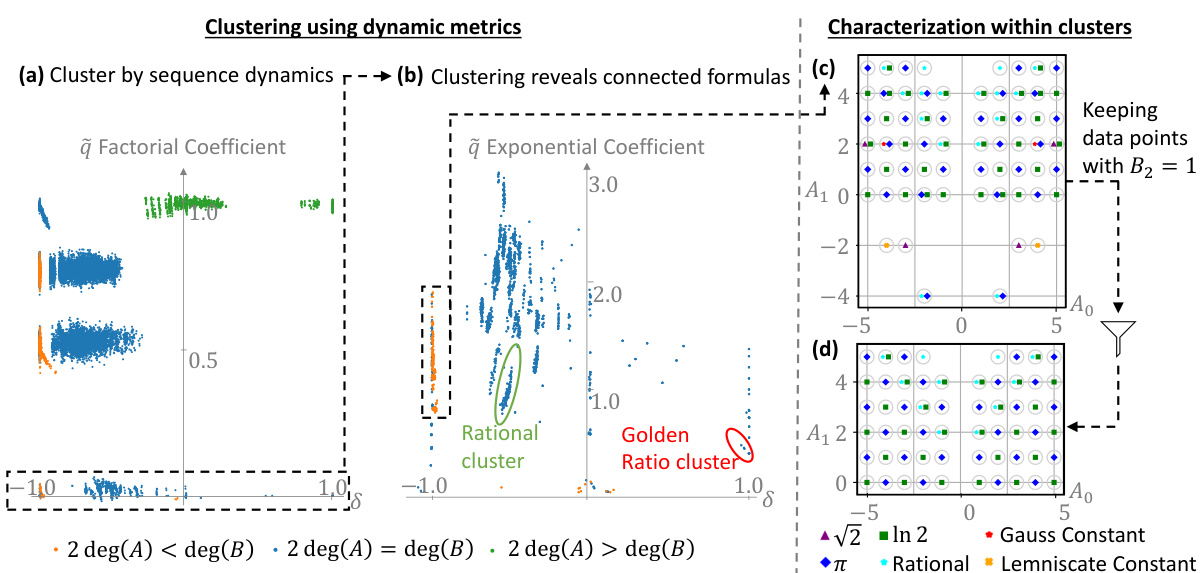
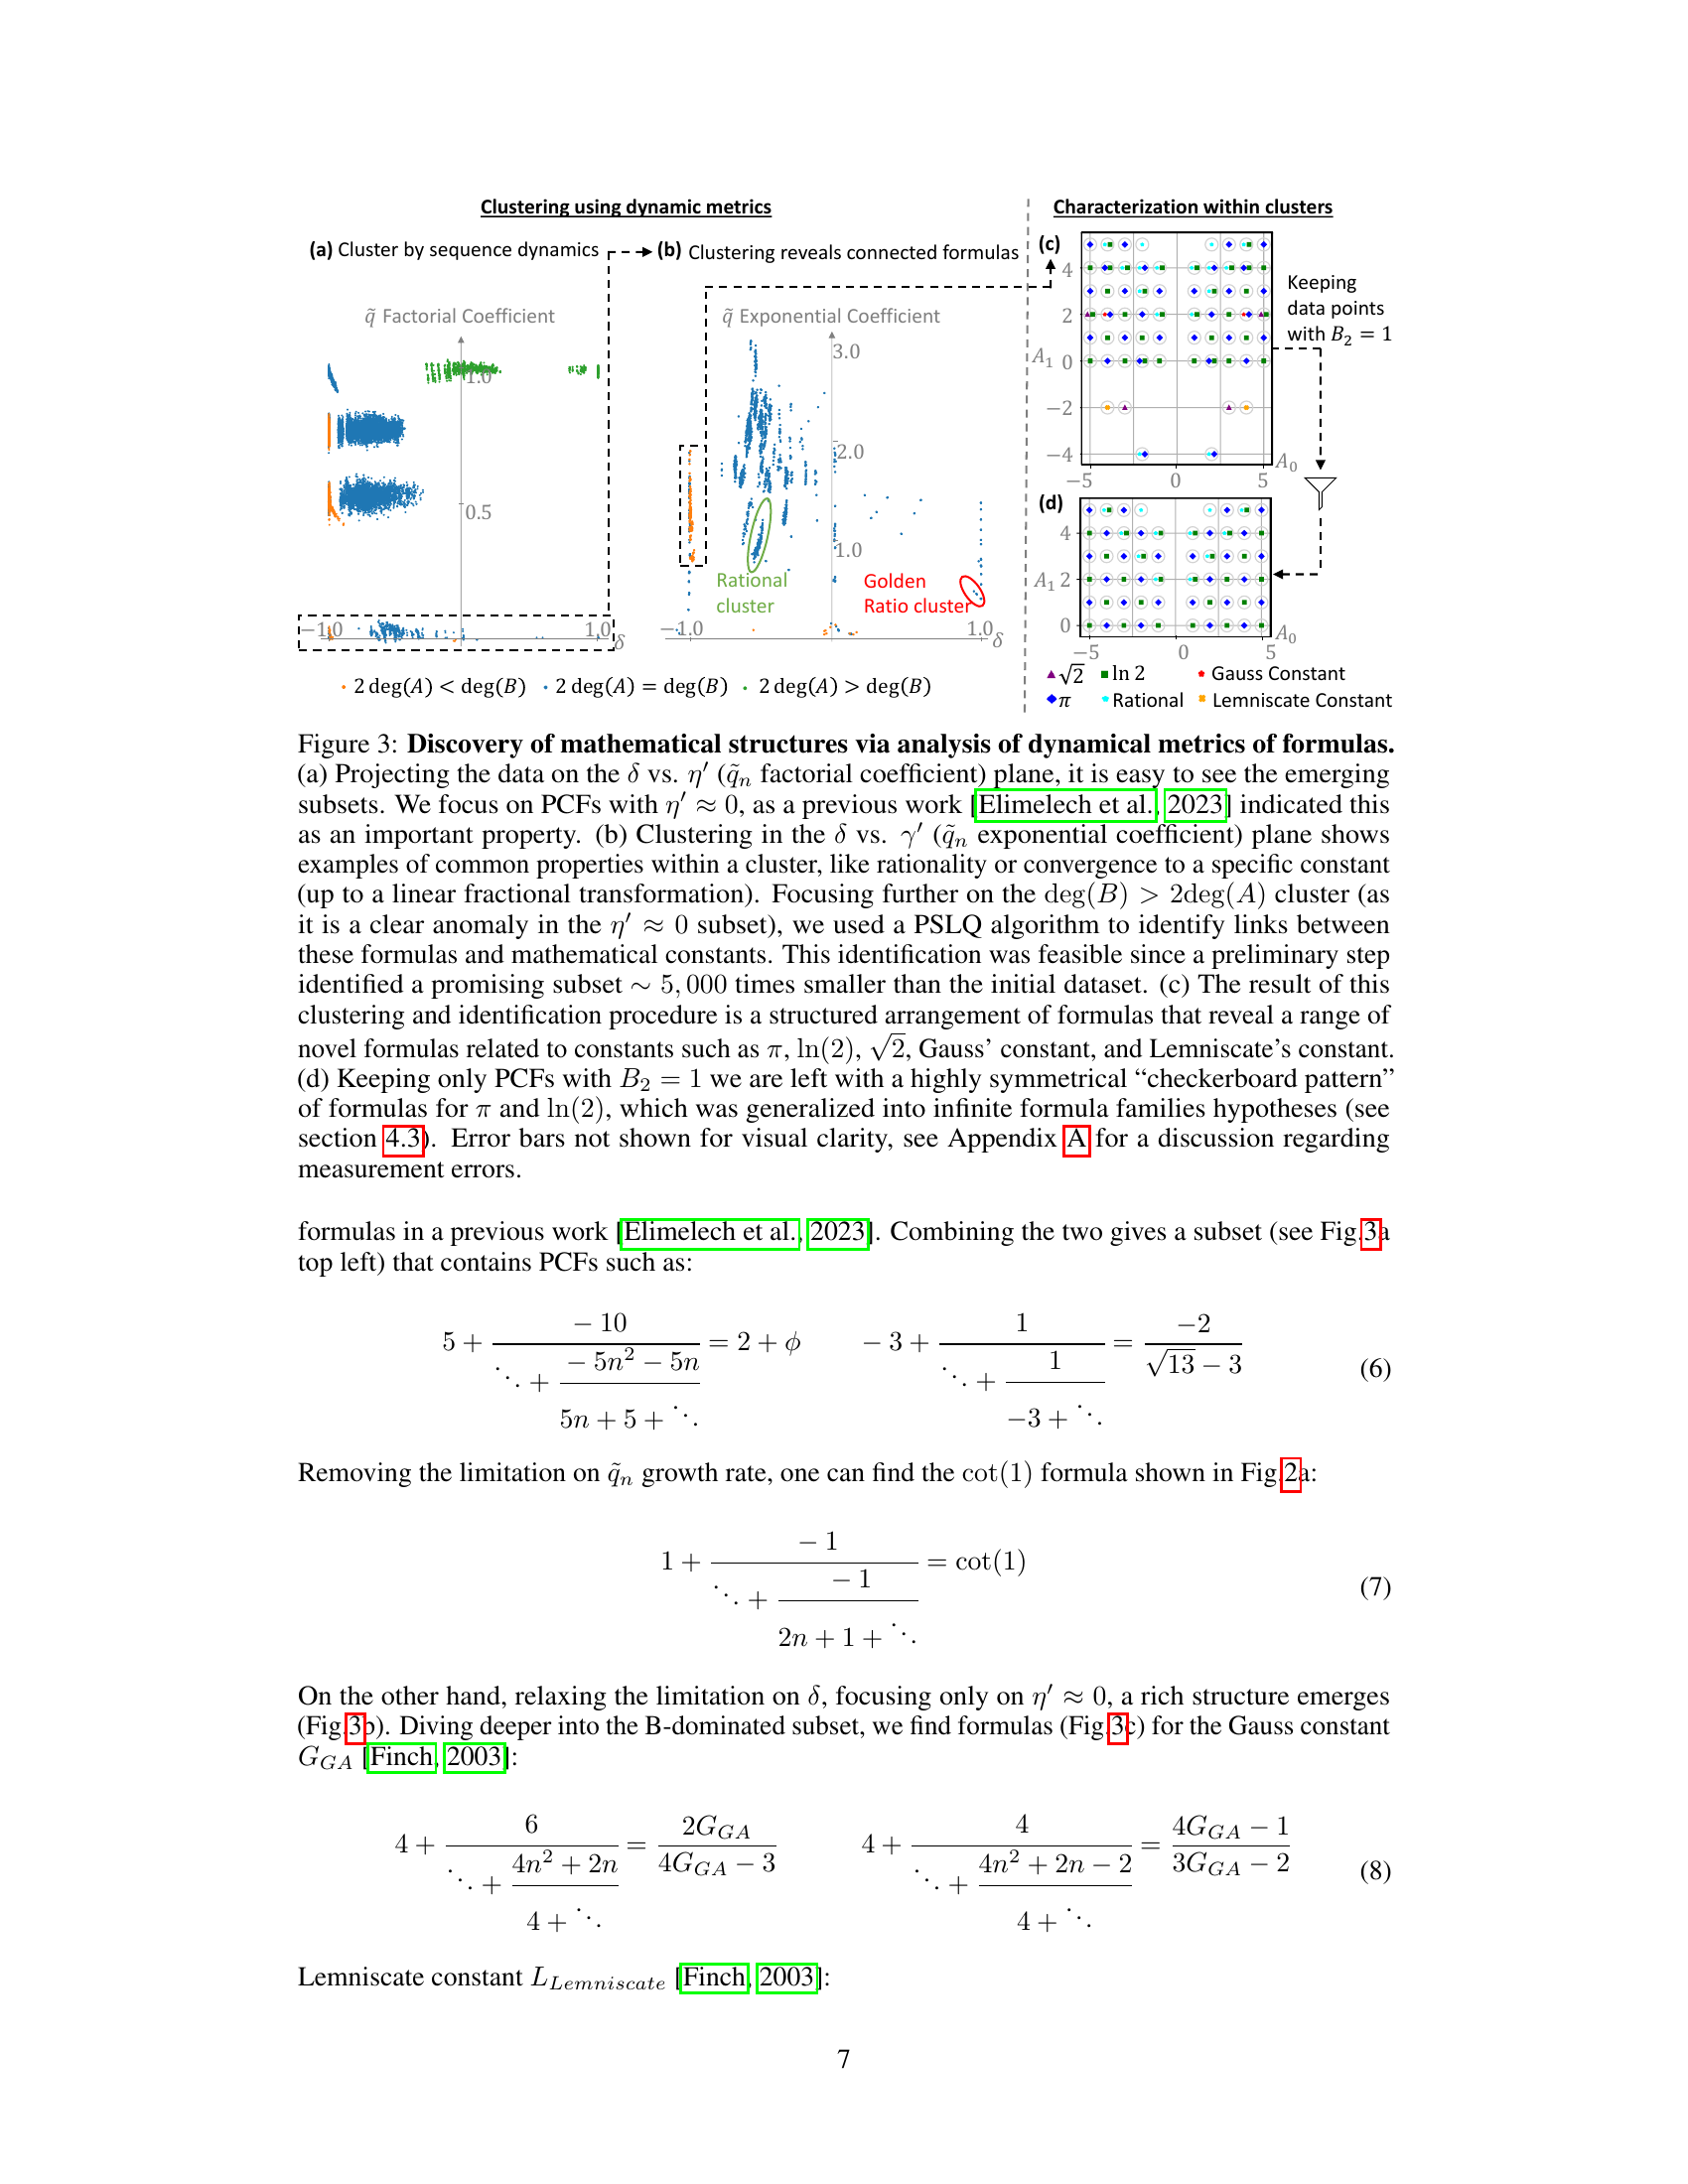
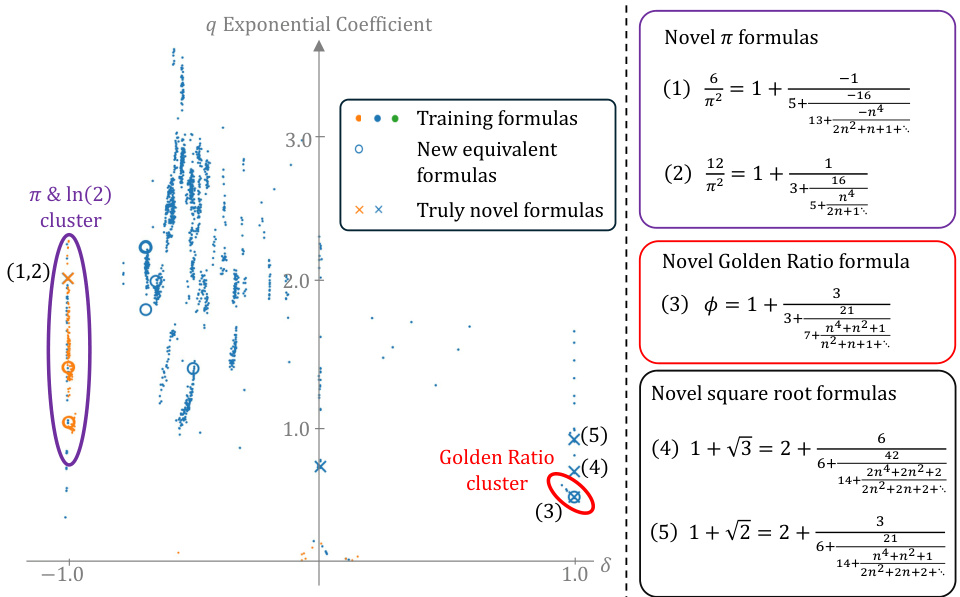
🔼 This figure shows how the dynamics-based metrics were used to discover mathematical structures and novel formulas for several mathematical constants. Panel (a) shows a projection of the data onto two key metrics to highlight subsets of interest. Panel (b) displays clustering results based on other dynamical metrics, revealing connected formulas. Panels (c) and (d) present specific clusters of formulas and reveal patterns leading to the discovery of novel formulas, particularly for π and ln(2). The figure emphasizes the power of the dynamical metrics in uncovering rich mathematical structures.
read the caption
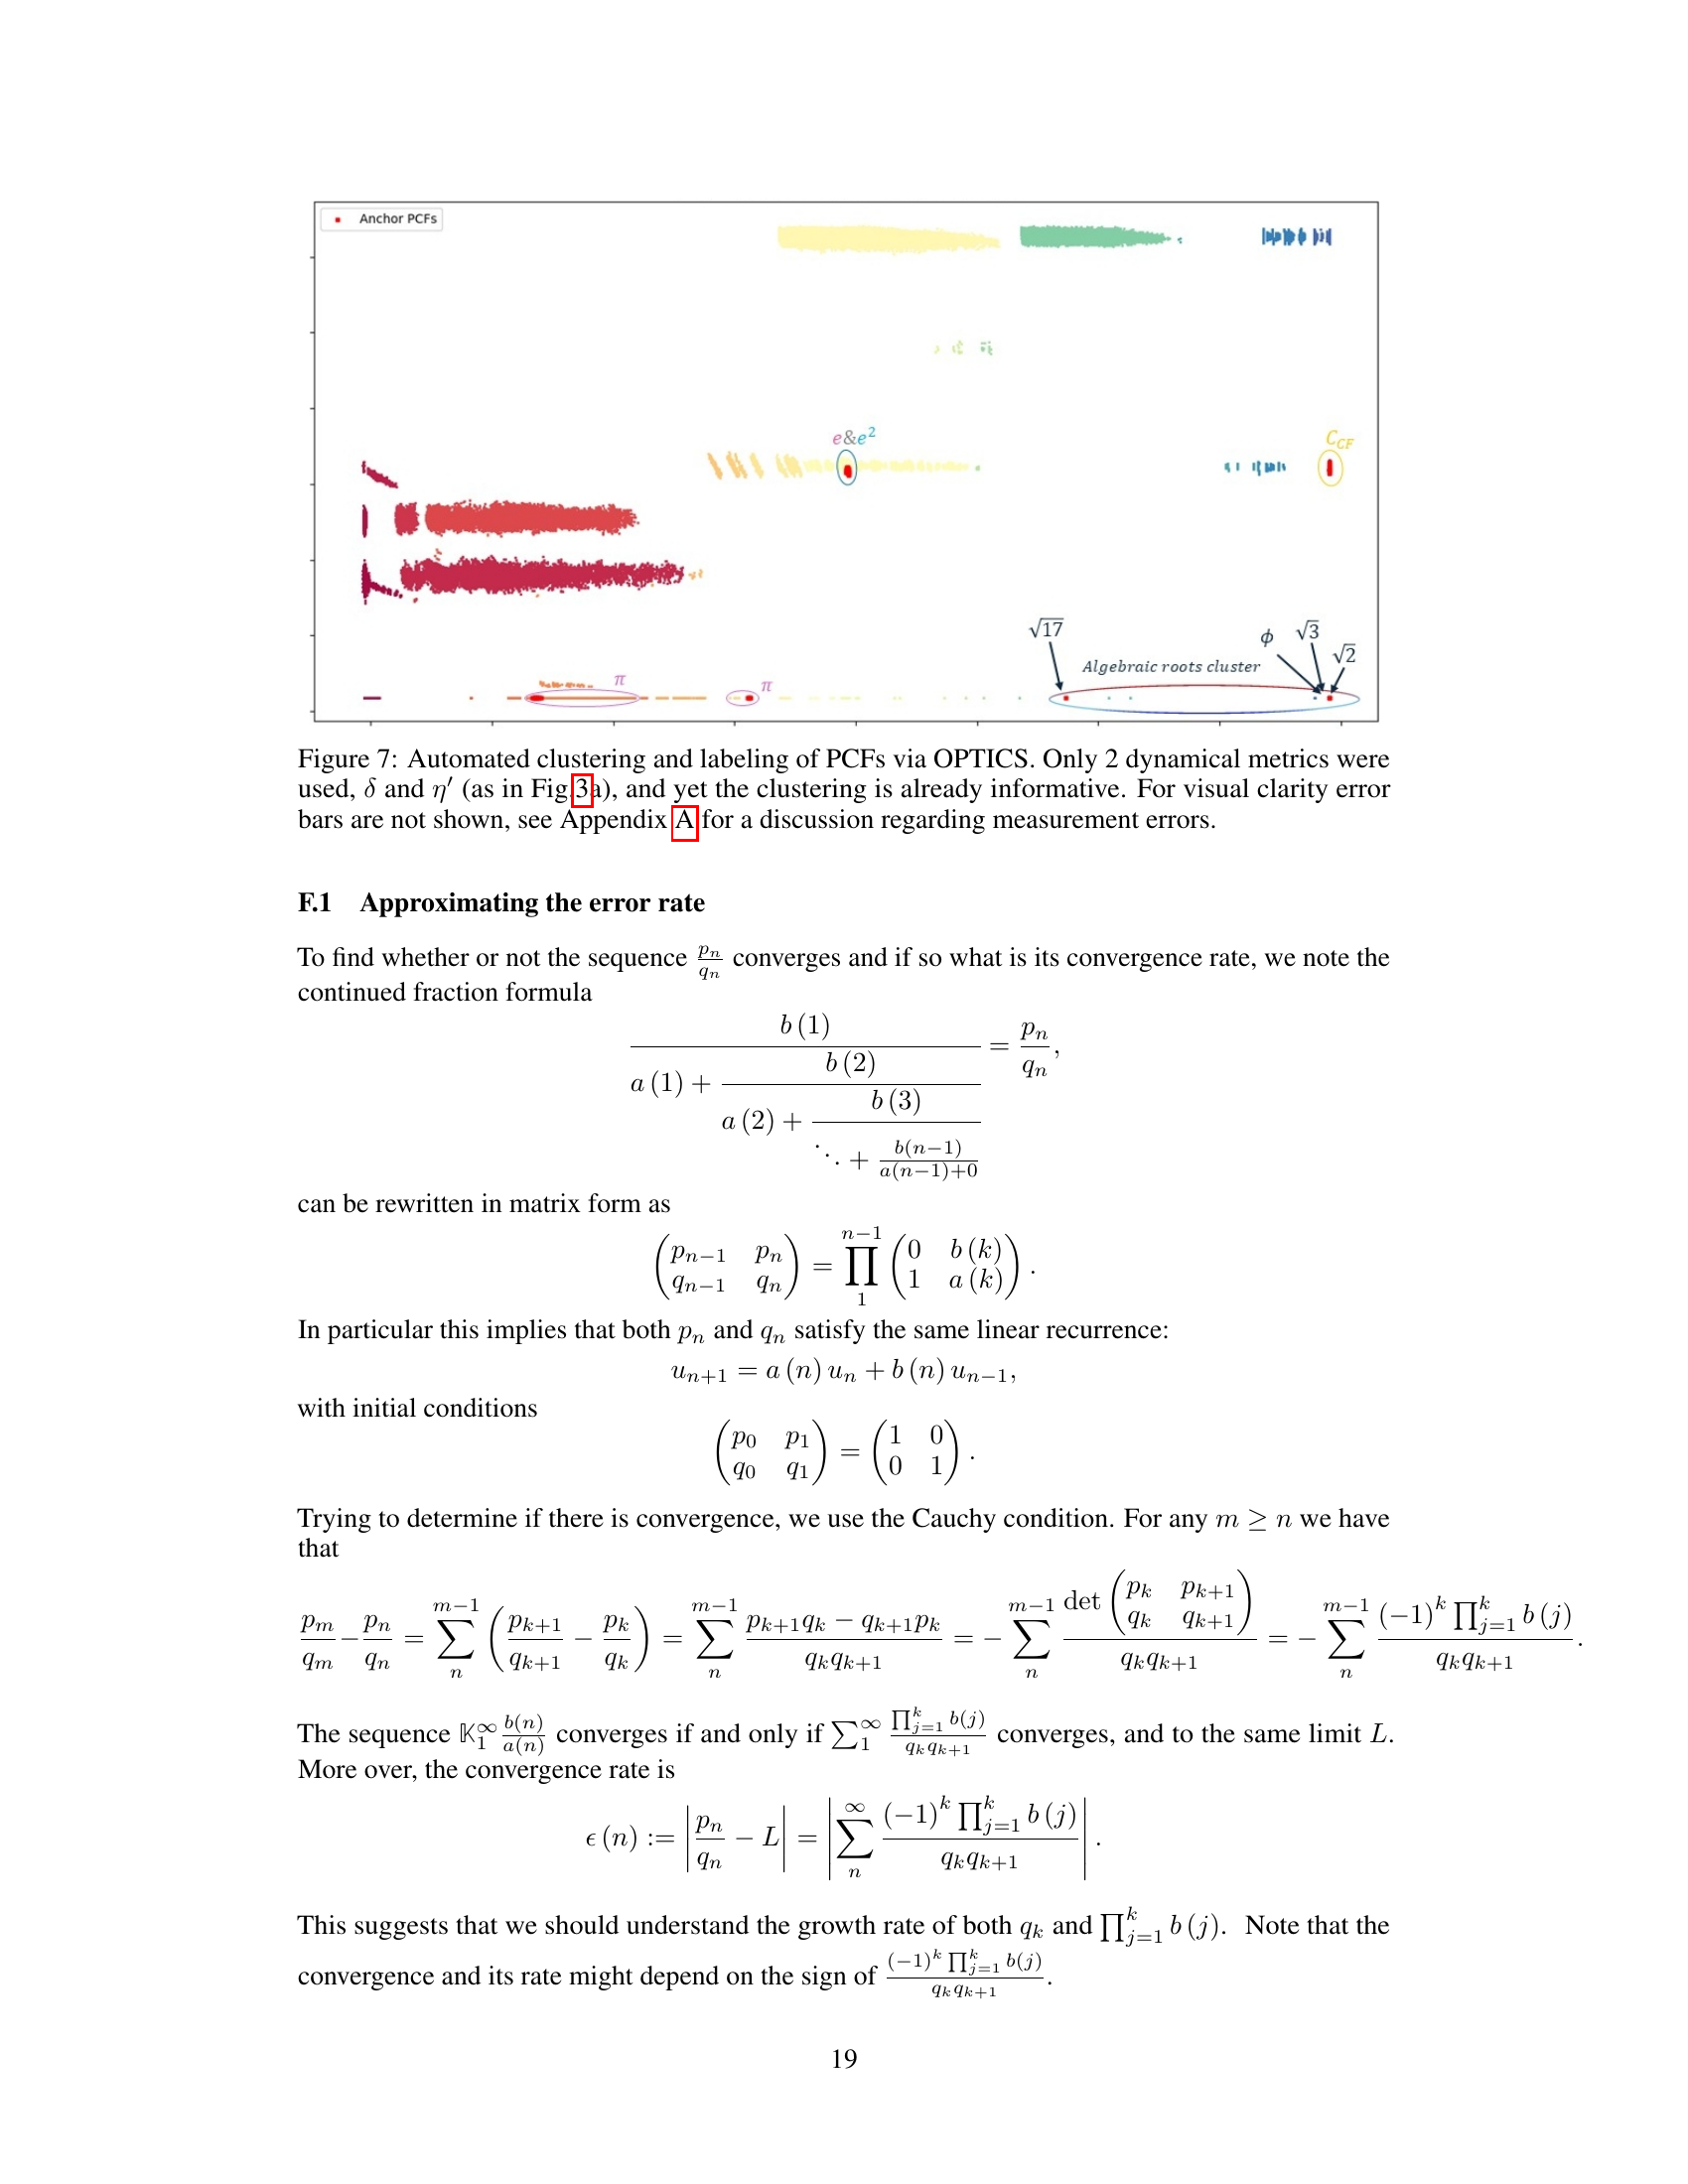
Figure 3: Discovery of mathematical structures via analysis of dynamical metrics of formulas. (a) Projecting the data on the δ vs. η′ (ᾷn factorial coefficient) plane, it is easy to see the emerging subsets. We focus on PCFs with η′ ≈ 0, as a previous work [Elimelech et al., 2023] indicated this as an important property. (b) Clustering in the δ vs. γ′ (ᾷn exponential coefficient) plane shows examples of common properties within a cluster, like rationality or convergence to a specific constant (up to a linear fractional transformation). Focusing further on the deg(B) > 2deg(A) cluster (as it is a clear anomaly in the η′ ≈ 0 subset), we used a PSLQ algorithm to identify links between these formulas and mathematical constants. This identification was feasible since a preliminary step identified a promising subset ~ 5,000 times smaller than the initial dataset. (c) The result of this clustering and identification procedure is a structured arrangement of formulas that reveal a range of novel formulas related to constants such as π, ln(2), √2, Gauss’ constant, and Lemniscate’s constant. (d) Keeping only PCFs with B2 = 1 we are left with a highly symmetrical “checkerboard pattern” of formulas for π and ln(2), which was generalized into infinite formula families hypotheses (see section 4.3). Error bars not shown for visual clarity, see Appendix A for a discussion regarding measurement errors.
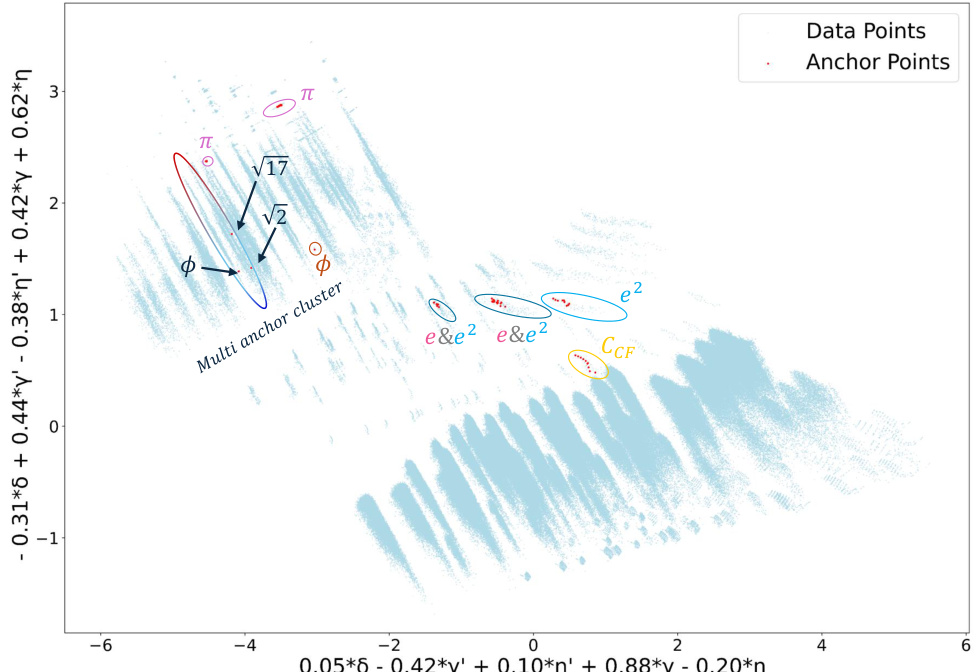
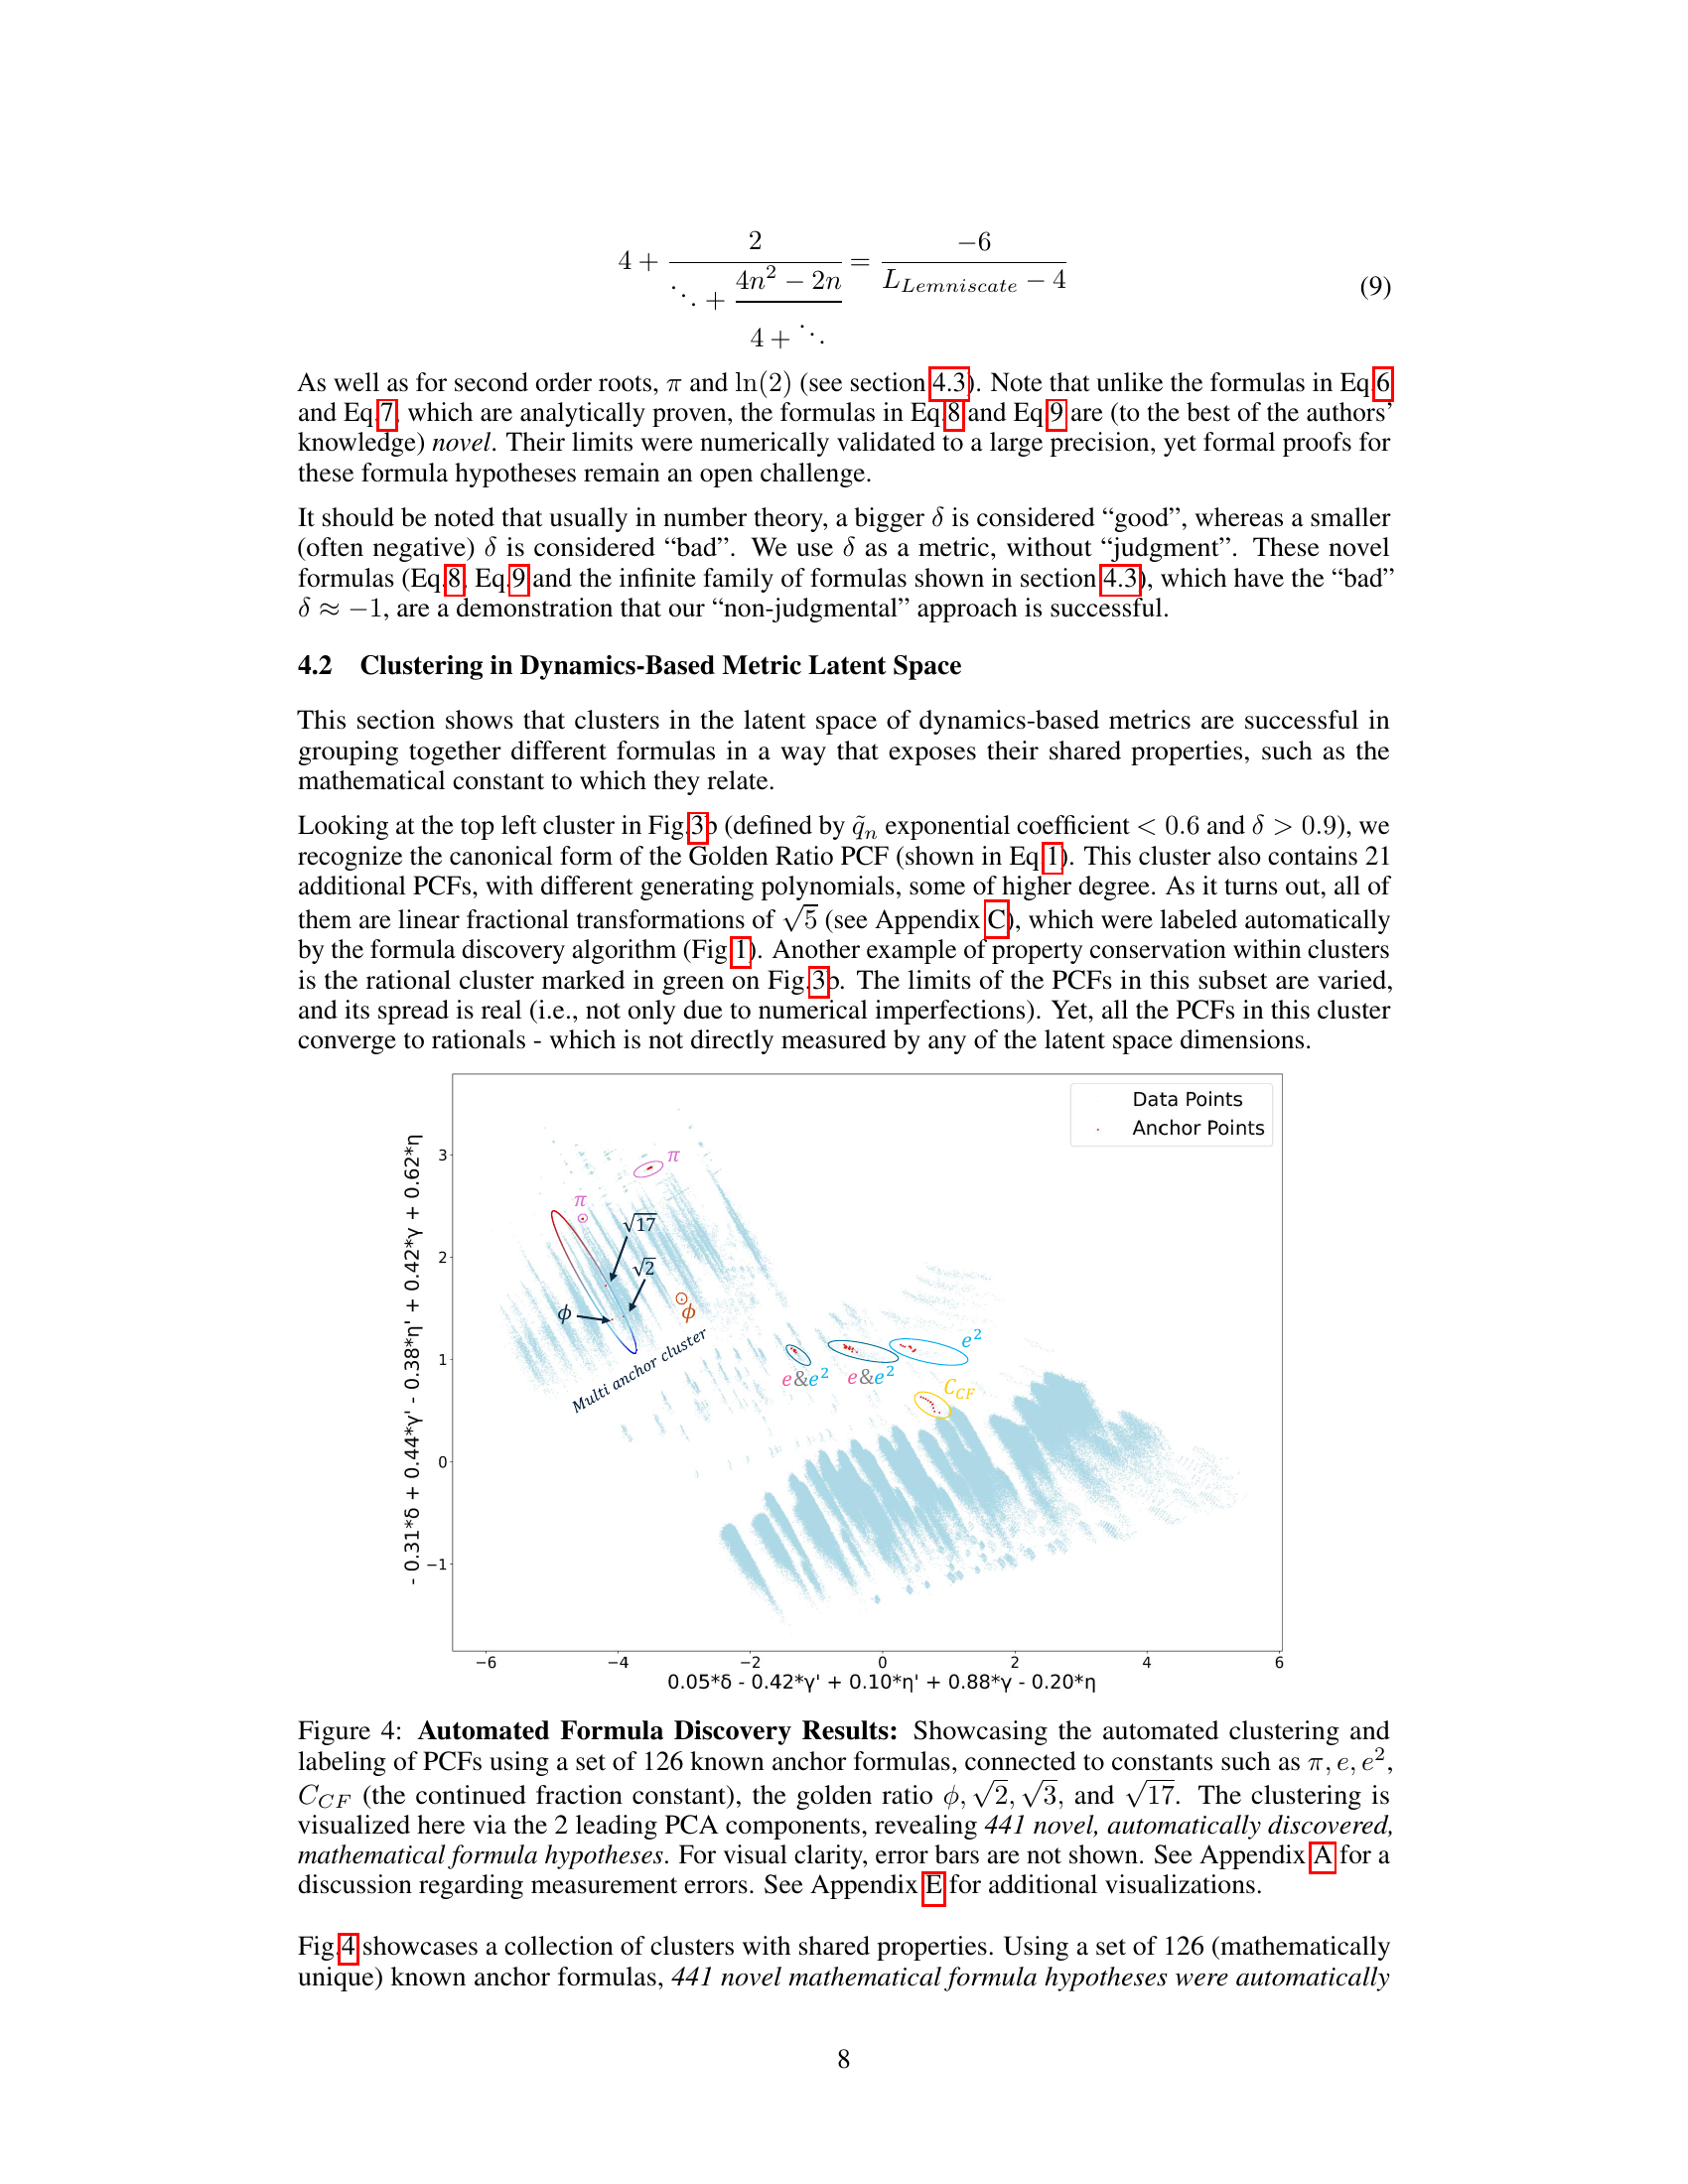
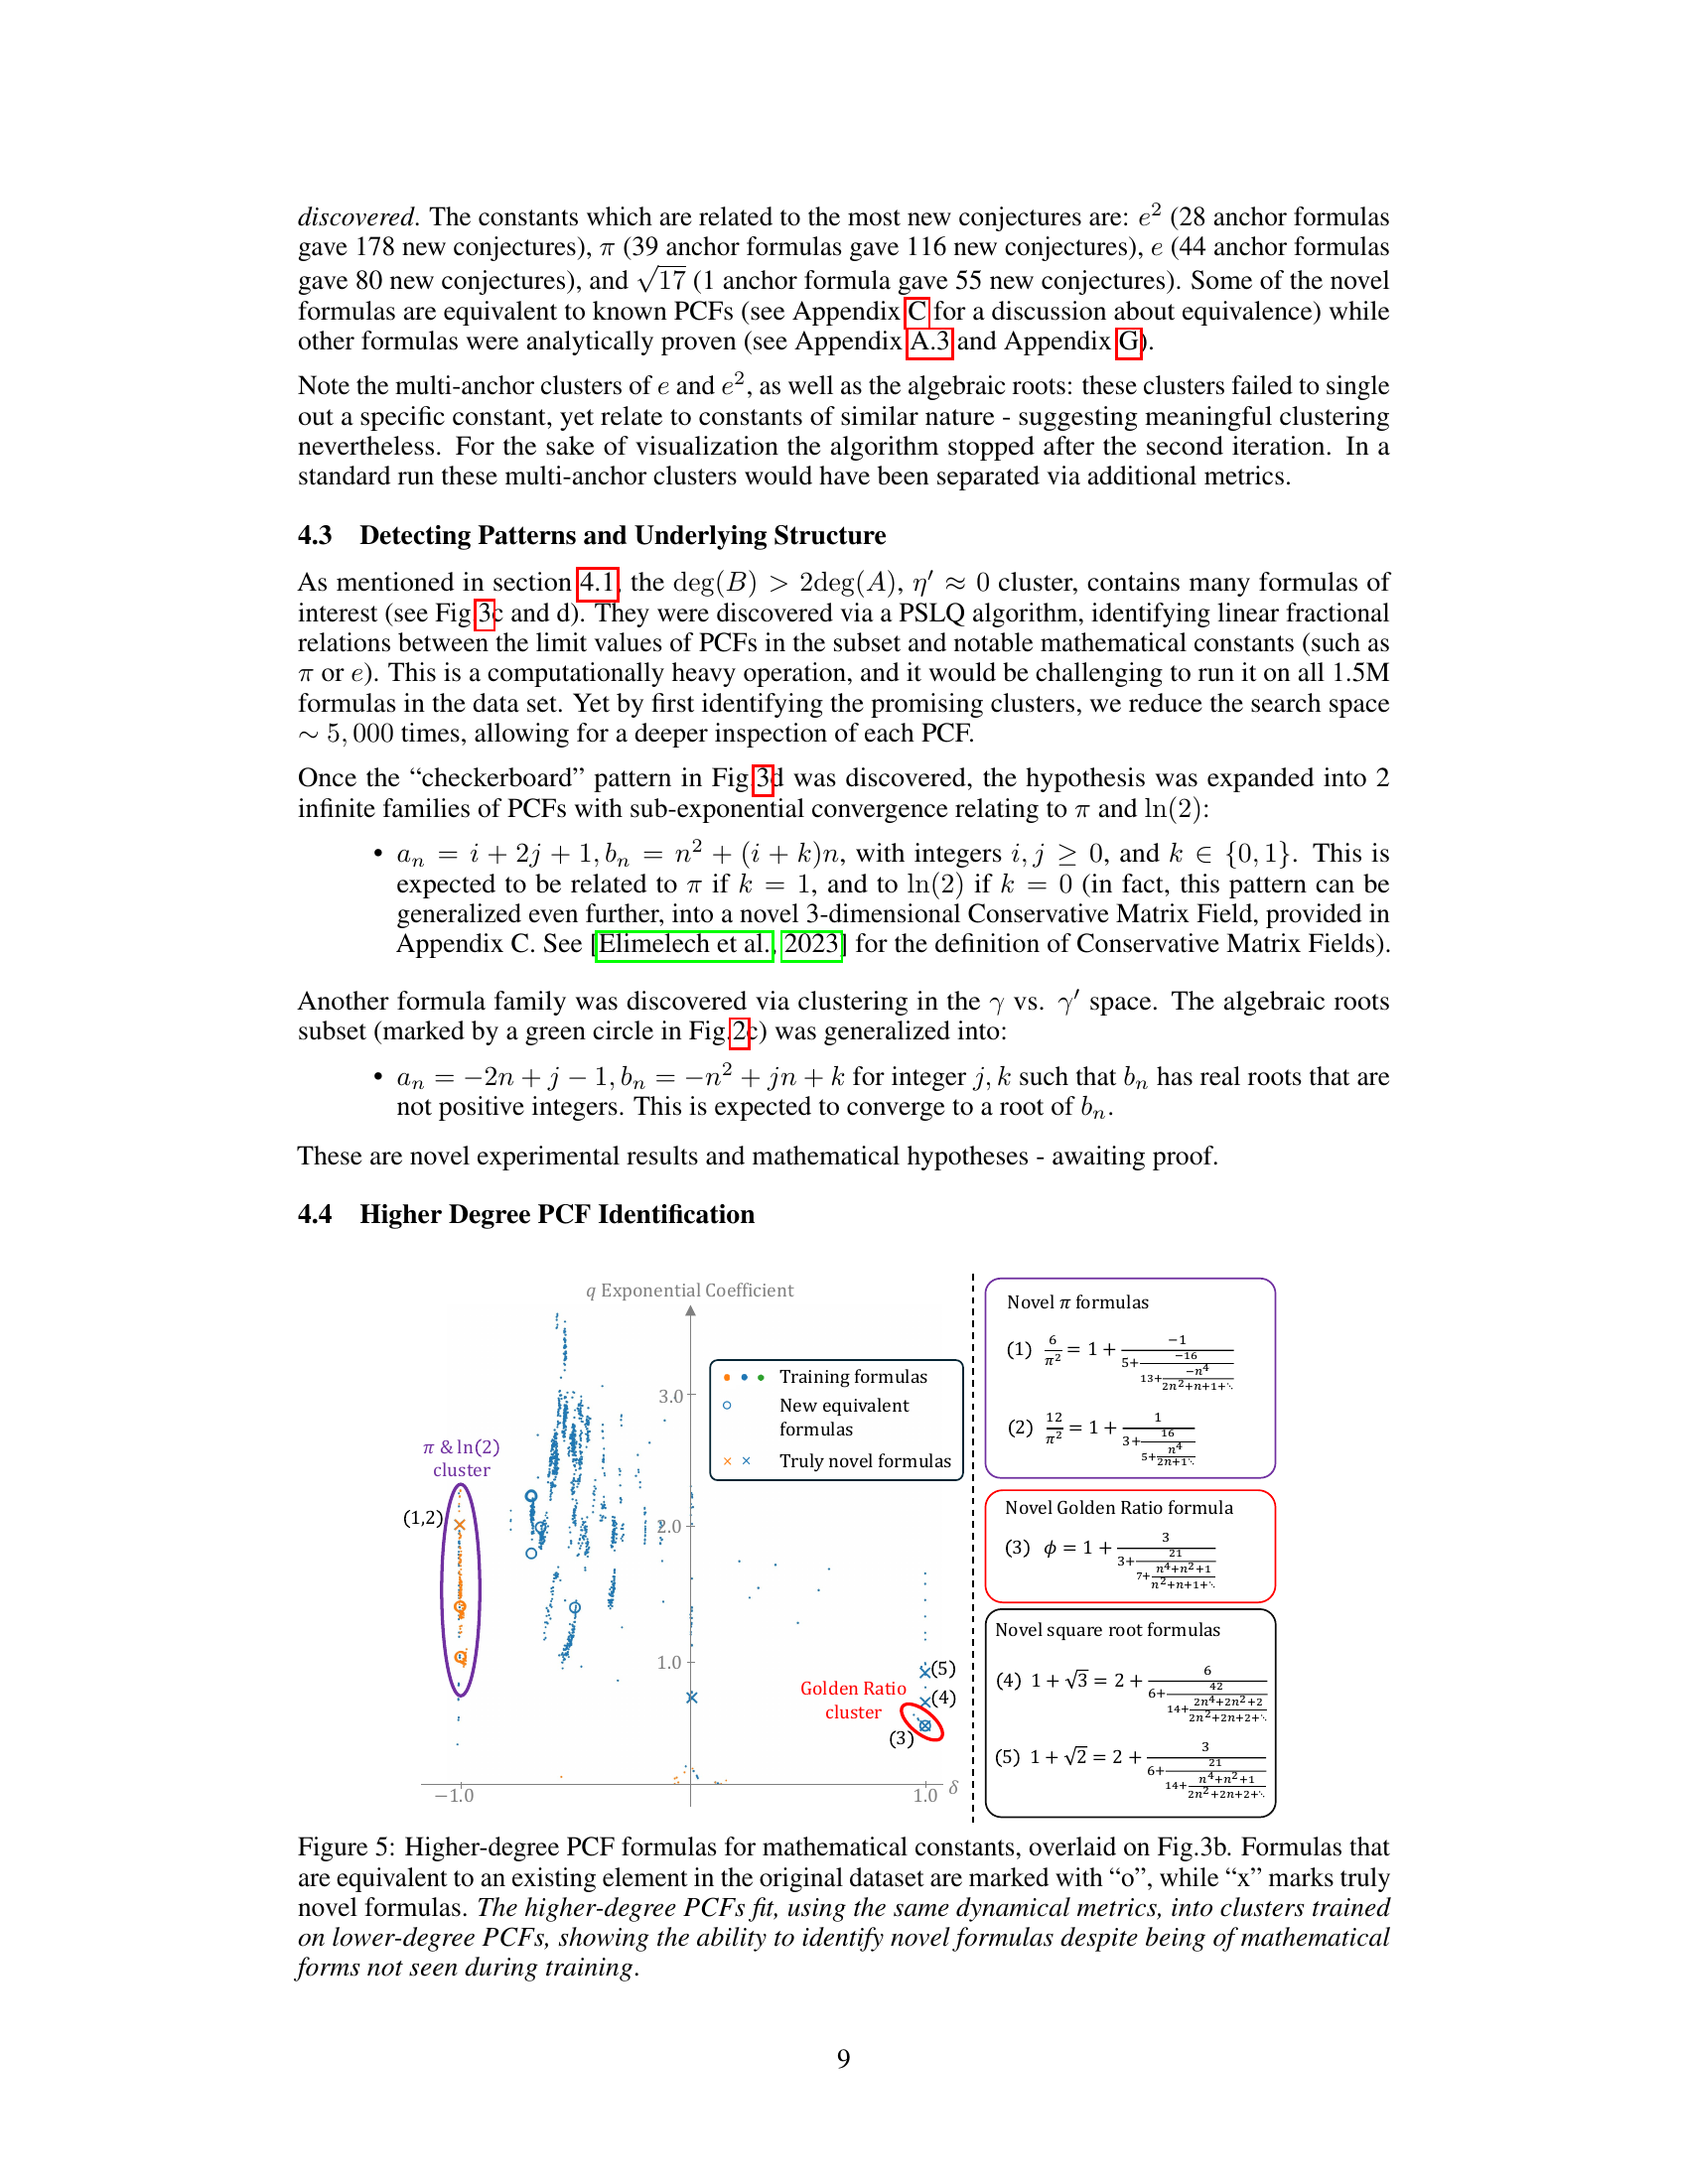
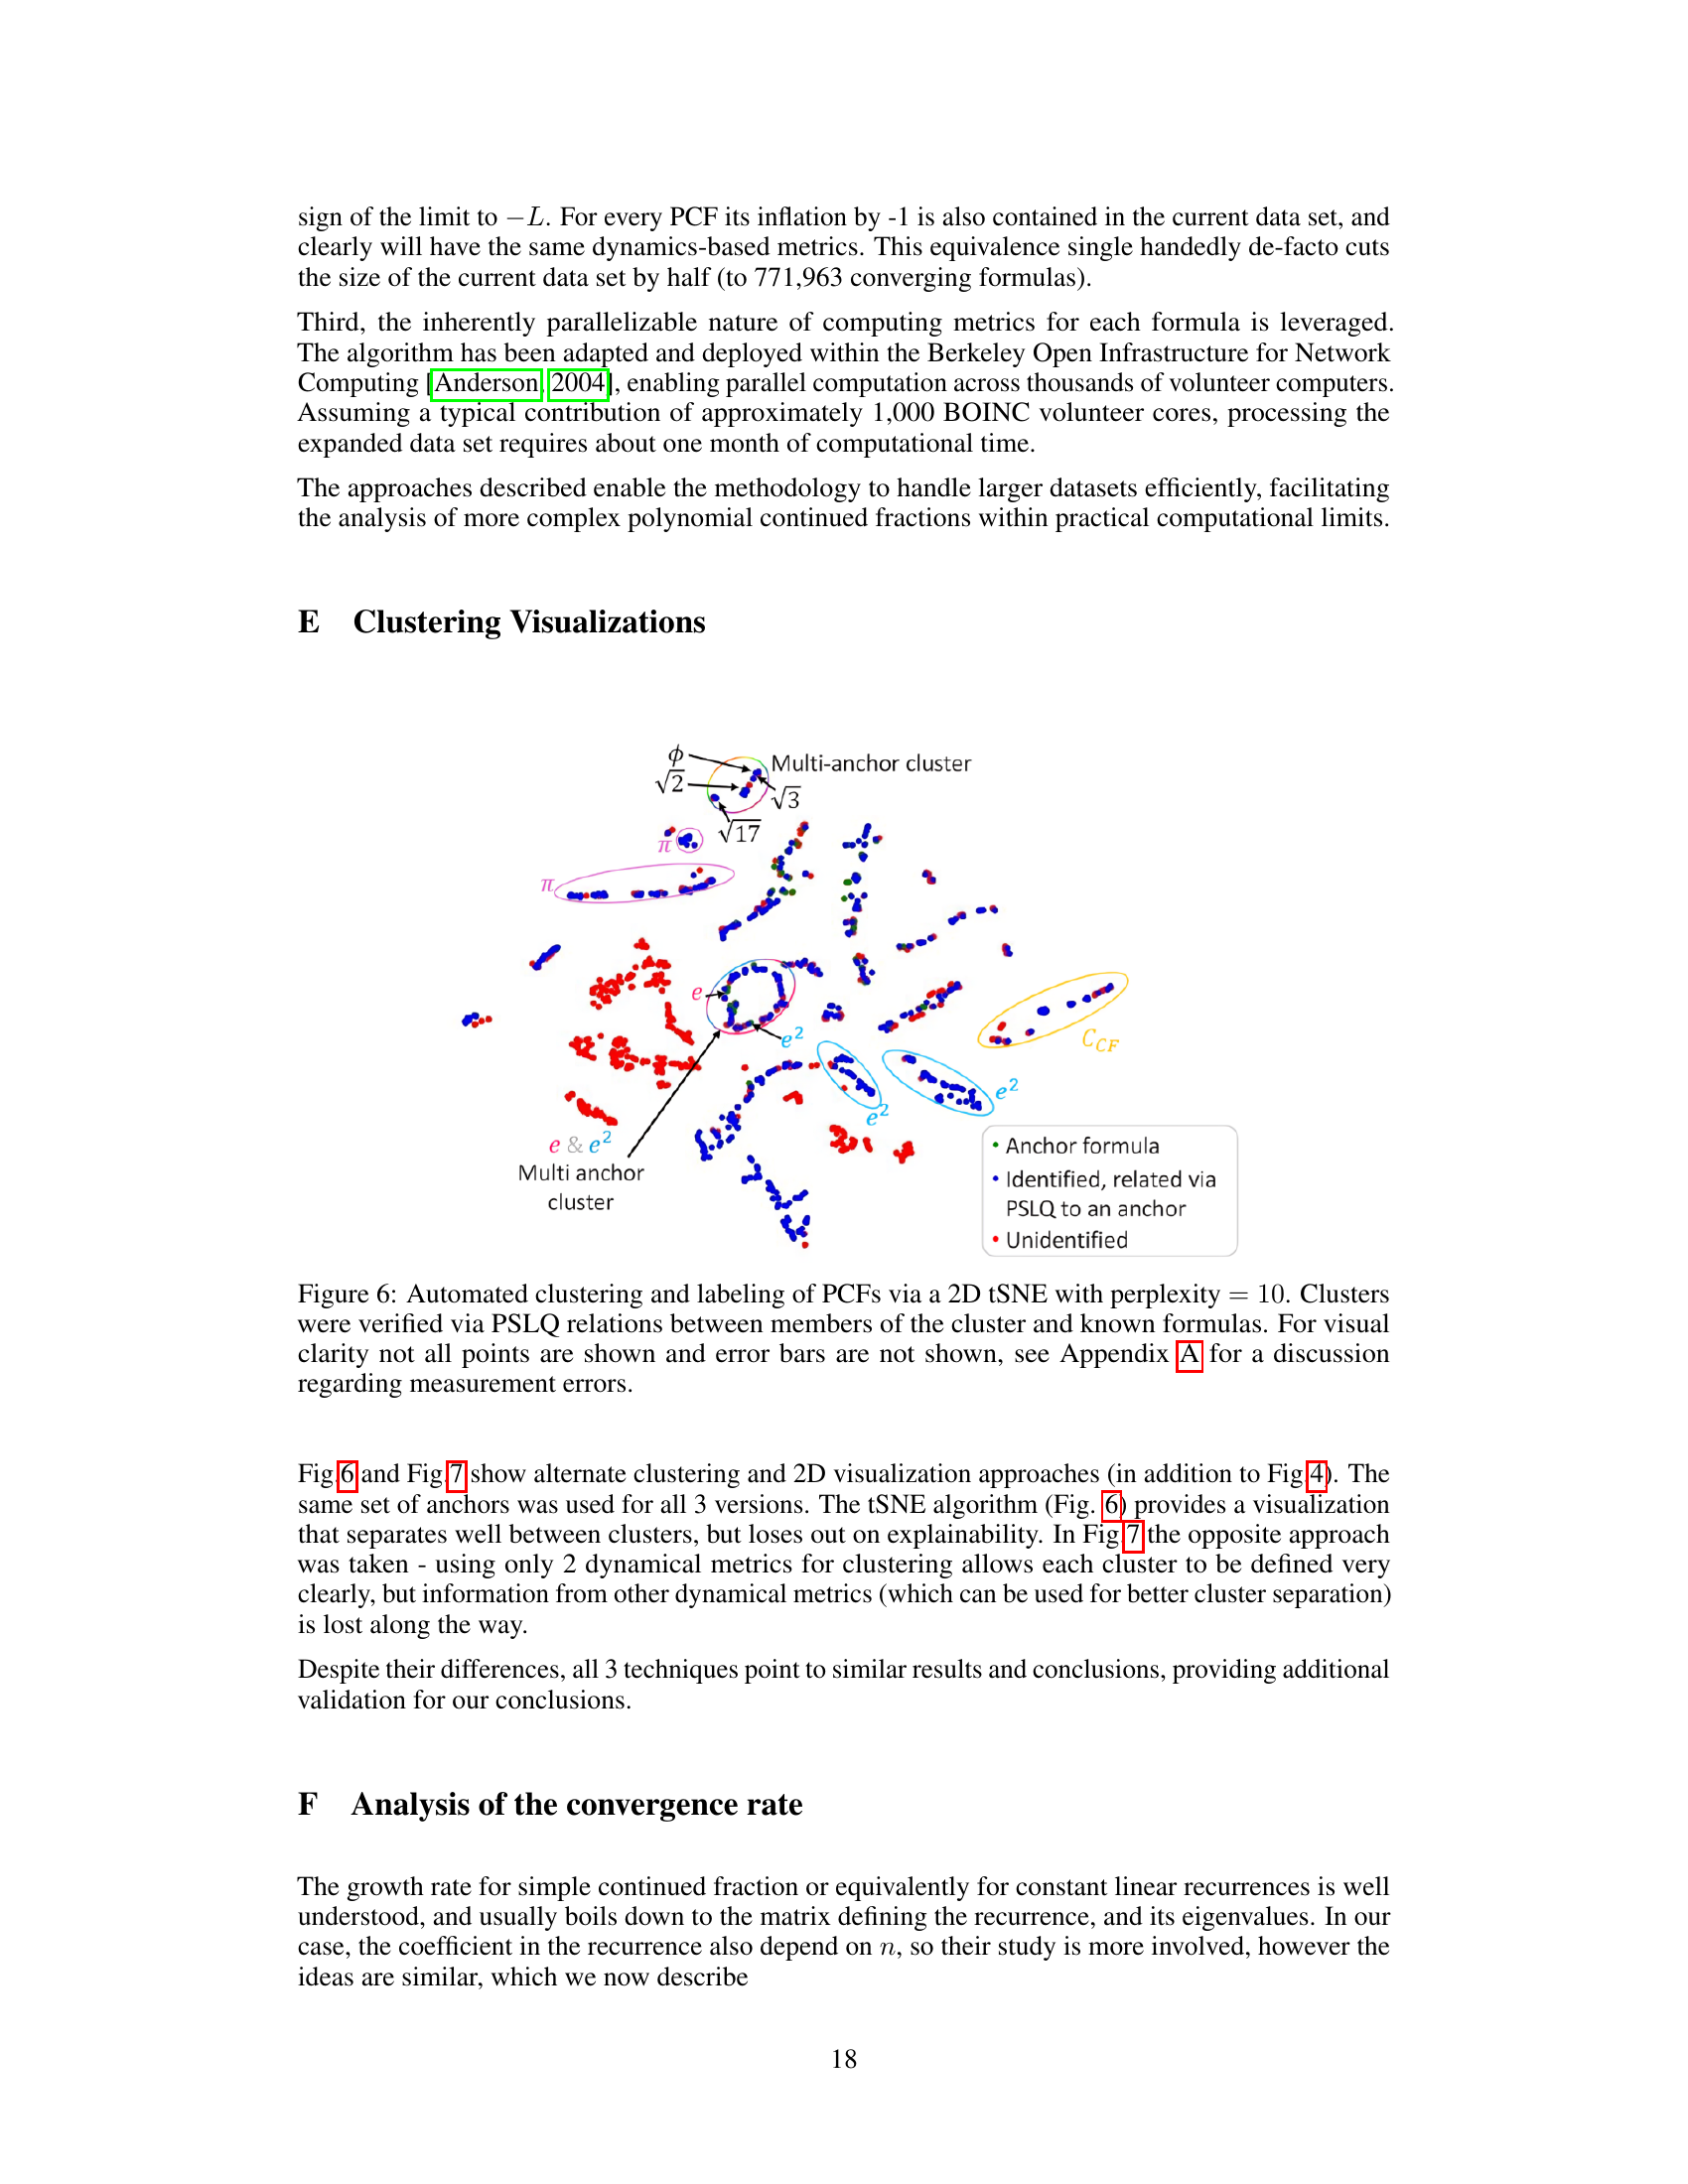
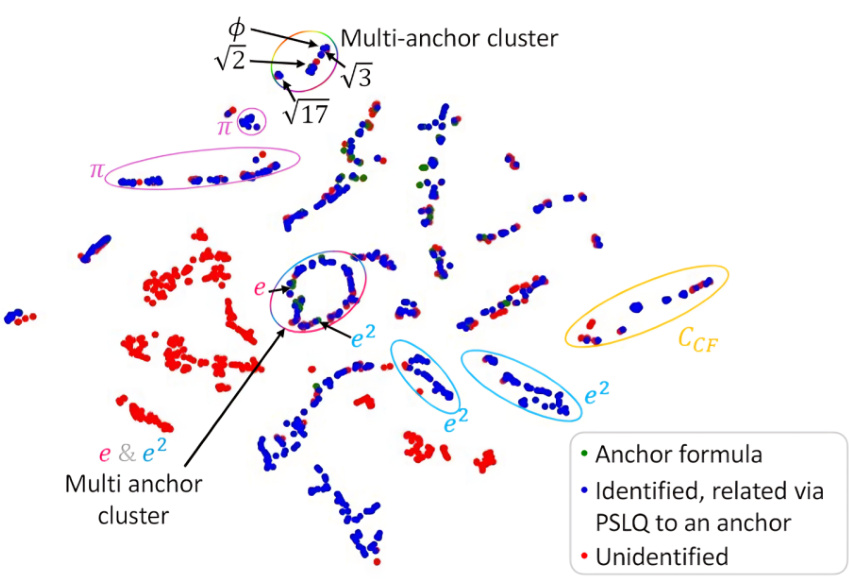
🔼 This figure showcases the results of automated formula discovery using a novel methodology based on dynamical metrics. A total of 441 novel mathematical formula hypotheses were automatically discovered by clustering 1,543,926 polynomial continued fractions (PCFs) based on their dynamical properties. The clustering is visualized using the top two principal components of the dynamical metrics, highlighting clusters associated with various mathematical constants such as π, e, e², the golden ratio, and square roots of integers. Known formulas (anchors) are used to label clusters, and previously unknown formulas are identified within these clusters.
read the caption
Figure 4: Automated Formula Discovery Results: Showcasing the automated clustering and labeling of PCFs using a set of 126 known anchor formulas, connected to constants such as π, e, e², CCF (the continued fraction constant), the golden ratio φ, √2, √3, and √17. The clustering is visualized here via the 2 leading PCA components, revealing 441 novel, automatically discovered, mathematical formula hypotheses. For visual clarity, error bars are not shown. See Appendix A for a discussion regarding measurement errors. See Appendix E for additional visualizations.
🔼 Figure 3 demonstrates the power of using dynamical metrics for clustering and identifying formulas for mathematical constants. Panel (a) shows a projection of the data onto the δ vs. η’ plane, highlighting subsets of formulas. Panel (b) displays clustering in the δ vs. γ’ plane, revealing common properties within clusters such as rationality or convergence to specific constants. Focusing on a specific subset (deg(B) > 2deg(A)), PSLQ analysis identifies links to known constants. Panel (c) shows the resulting structured arrangement of formulas, revealing novel formulas related to π, ln(2), √2, Gauss’ constant, and the Lemniscate constant. Panel (d) showcases a symmetrical pattern for π and ln(2) when considering PCFs with B2=1. This pattern is generalized into infinite formula families.
read the caption
Figure 3: Discovery of mathematical structures via analysis of dynamical metrics of formulas. (a) Projecting the data on the δ vs. η' (ᾷn factorial coefficient) plane, it is easy to see the emerging subsets. We focus on PCFs with η' ≈ 0, as a previous work [Elimelech et al., 2023] indicated this as an important property. (b) Clustering in the δ vs. γ' (ᾷn exponential coefficient) plane shows examples of common properties within a cluster, like rationality or convergence to a specific constant (up to a linear fractional transformation). Focusing further on the deg(B) > 2deg(A) cluster (as it is a clear anomaly in the η' ≈ 0 subset), we used a PSLQ algorithm to identify links between these formulas and mathematical constants. This identification was feasible since a preliminary step identified a promising subset ~ 5,000 times smaller than the initial dataset. (c) The result of this clustering and identification procedure is a structured arrangement of formulas that reveal a range of novel formulas related to constants such as π, ln(2), √2, Gauss' constant, and Lemniscate's constant. (d) Keeping only PCFs with B2 = 1 we are left with a highly symmetrical “checkerboard pattern
🔼 This figure shows how the authors used dynamical metrics to cluster polynomial continued fractions (PCFs) and discover new formulas for mathematical constants. Panel (a) shows a 2D projection of the data, highlighting subsets of PCFs. Panel (b) shows additional clustering and identification of links between PCFs and constants, using the PSLQ algorithm. Panel (c) presents a structured arrangement of the discovered formulas. Finally, Panel (d) focuses on a specific subset of PCFs, revealing a symmetrical pattern and infinite families of formulas.
read the caption
Figure 3: Discovery of mathematical structures via analysis of dynamical metrics of formulas. (a) Projecting the data on the δ vs. η' (ᾷn factorial coefficient) plane, it is easy to see the emerging subsets. We focus on PCFs with η' ≈ 0, as a previous work [Elimelech et al., 2023] indicated this as an important property. (b) Clustering in the δ vs. γ' (ᾷn exponential coefficient) plane shows examples of common properties within a cluster, like rationality or convergence to a specific constant (up to a linear fractional transformation). Focusing further on the deg(B) > 2deg(A) cluster (as it is a clear anomaly in the η' ≈ 0 subset), we used a PSLQ algorithm to identify links between these formulas and mathematical constants. This identification was feasible since a preliminary step identified a promising subset ~ 5,000 times smaller than the initial dataset. (c) The result of this clustering and identification procedure is a structured arrangement of formulas that reveal a range of novel formulas related to constants such as π, ln(2), √2, Gauss' constant, and Lemniscate's constant. (d) Keeping only PCFs with B2 = 1 we are left with a highly symmetrical “checkerboard pattern” of formulas for π and ln(2), which was generalized into infinite formula families hypotheses (see section 4.3). Error bars not shown for visual clarity, see Appendix A for a discussion regarding measurement errors.
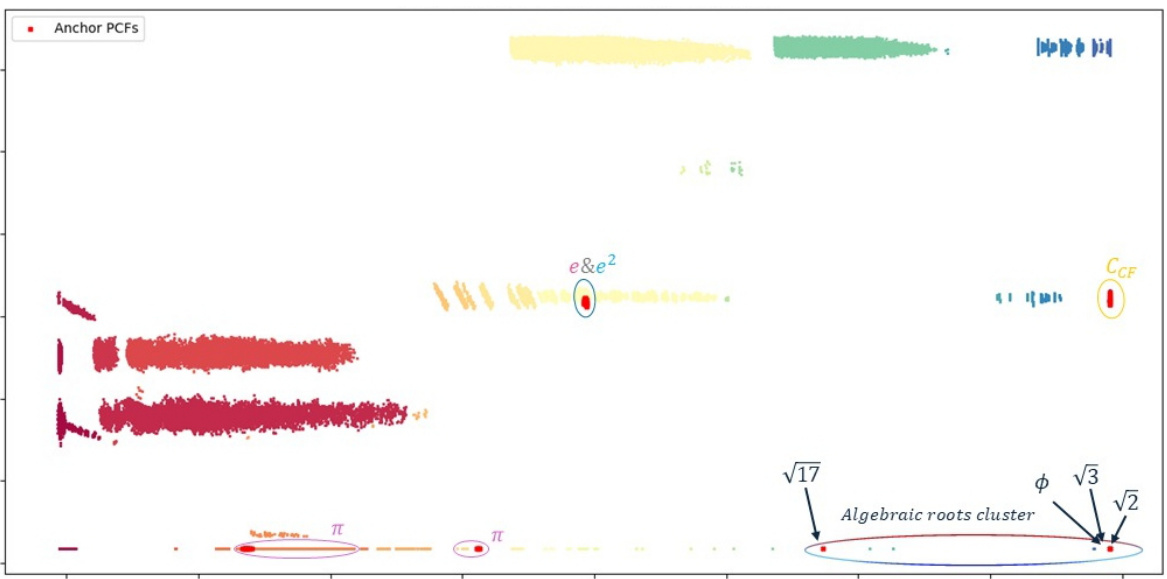
🔼 This figure visualizes the results of the automated formula discovery process. Using 126 known formulas as anchors, the algorithm clustered 1,543,926 polynomial continued fractions (PCFs) based on their dynamical properties. The 2D projection using Principal Component Analysis (PCA) reveals distinct clusters corresponding to different mathematical constants (π, e, e², etc.). The figure highlights 441 novel mathematical formula hypotheses discovered by the algorithm. The color-coding distinguishes between anchor formulas, formulas identified as related to anchors, and unidentified formulas.
read the caption
Figure 4: Automated Formula Discovery Results: Showcasing the automated clustering and labeling of PCFs using a set of 126 known anchor formulas, connected to constants such as π, e, e², CCF (the continued fraction constant), the golden ratio φ, √2, √3, and √17. The clustering is visualized here via the 2 leading PCA components, revealing 441 novel, automatically discovered, mathematical formula hypotheses. For visual clarity, error bars are not shown. See Appendix A for a discussion regarding measurement errors. See Appendix E for additional visualizations.
🔼 This figure shows the results of applying the unsupervised learning methodology to a set of polynomial continued fractions (PCFs). Using a set of 126 known anchor formulas representing various mathematical constants, the algorithm automatically clusters and labels the PCFs based on their dynamical metrics. The resulting visualization using the top two principal components reveals 441 novel mathematical formula hypotheses, many of which are related to known mathematical constants such as pi (π), e, square root of 2 (√2), and the golden ratio (φ). The figure highlights the power of the method for discovering new formulas and uncovering rich mathematical structures.
read the caption
Figure 4: Automated Formula Discovery Results: Showcasing the automated clustering and labeling of PCFs using a set of 126 known anchor formulas, connected to constants such as π, e, e², CCF (the continued fraction constant), the golden ratio φ, √2, √3, and √17. The clustering is visualized here via the 2 leading PCA components, revealing 441 novel, automatically discovered, mathematical formula hypotheses. For visual clarity, error bars are not shown. See Appendix A for a discussion regarding measurement errors. See Appendix E for additional visualizations.
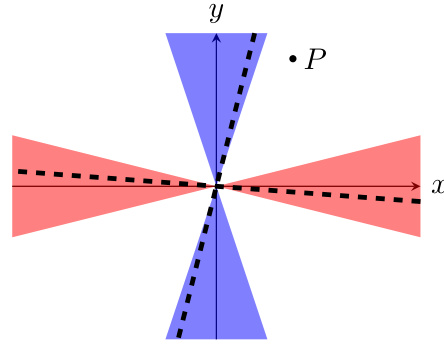
🔼 This figure shows a graphical representation of the convergence behavior of a continued fraction with variable coefficients. The x and y axes represent the real and imaginary parts of the coefficients, respectively. The shaded regions indicate areas of convergence, while the dashed line represents the path of the coefficients as the continued fraction is iterated. A point P is shown in the convergence region, illustrating that the coefficients converge to a specific point. This visualization helps understand the relationship between coefficient dynamics and convergence of a continued fraction.
read the caption
Figure 8: Convergence with variable coefficients
More on tables
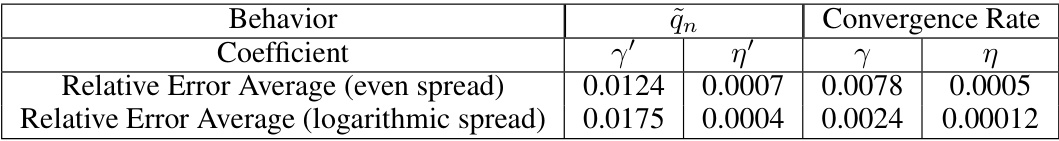
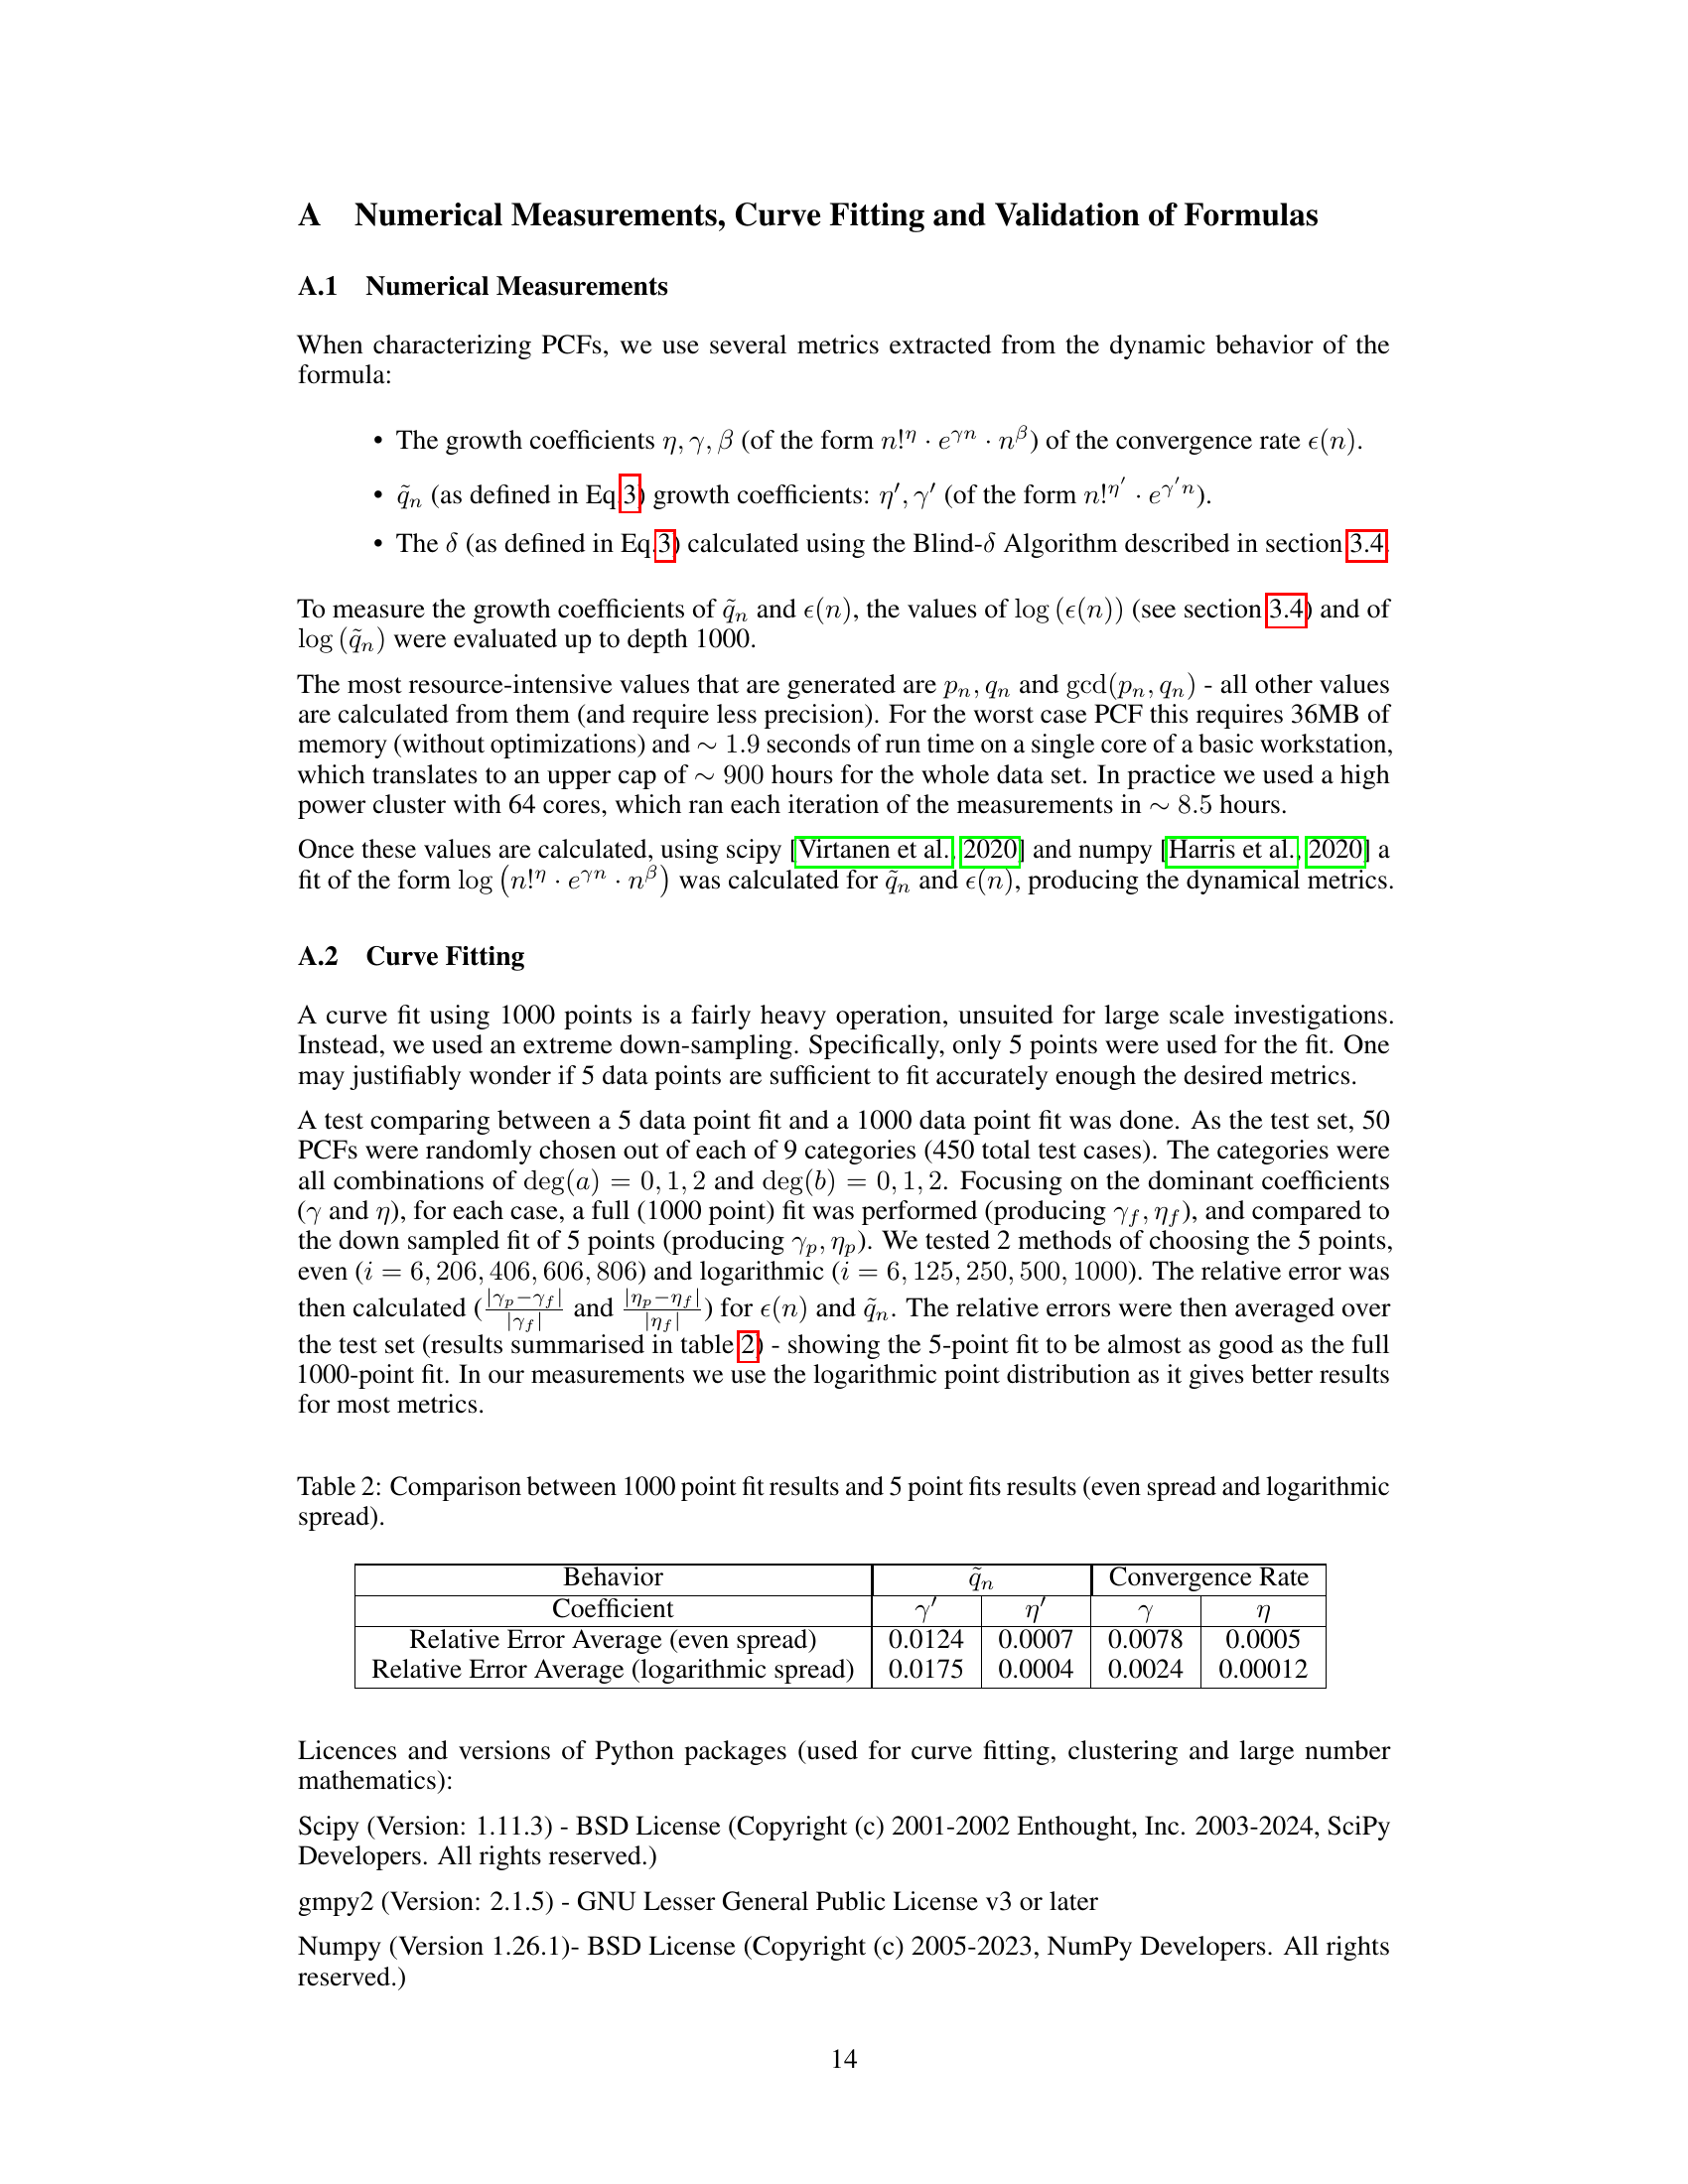
🔼 This table compares the results of curve fitting using 1000 data points against curve fitting using only 5 data points. The goal was to determine if using only 5 data points would provide a sufficient approximation for large-scale analysis. The table shows the relative error averages for both even and logarithmic data point spreads for the growth coefficients of * Convergence rate (ε(n)) * Denominator growth rate (q̃n)
read the caption
Table 2: Comparison between 1000 point fit results and 5 point fits results (even spread and logarithmic spread).
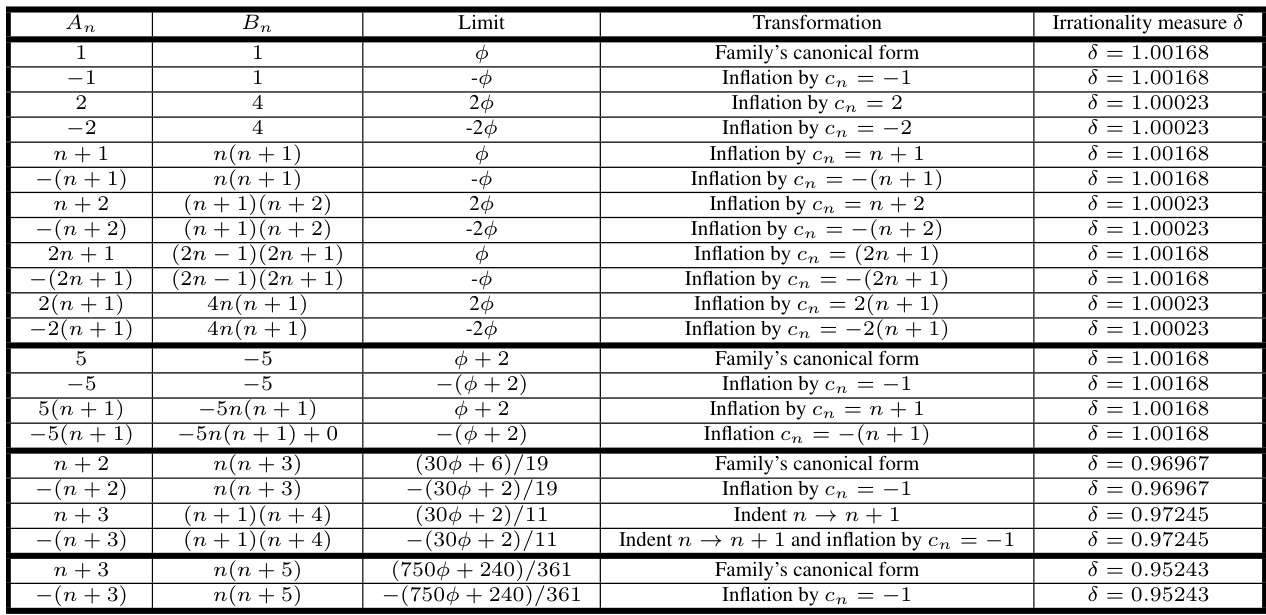
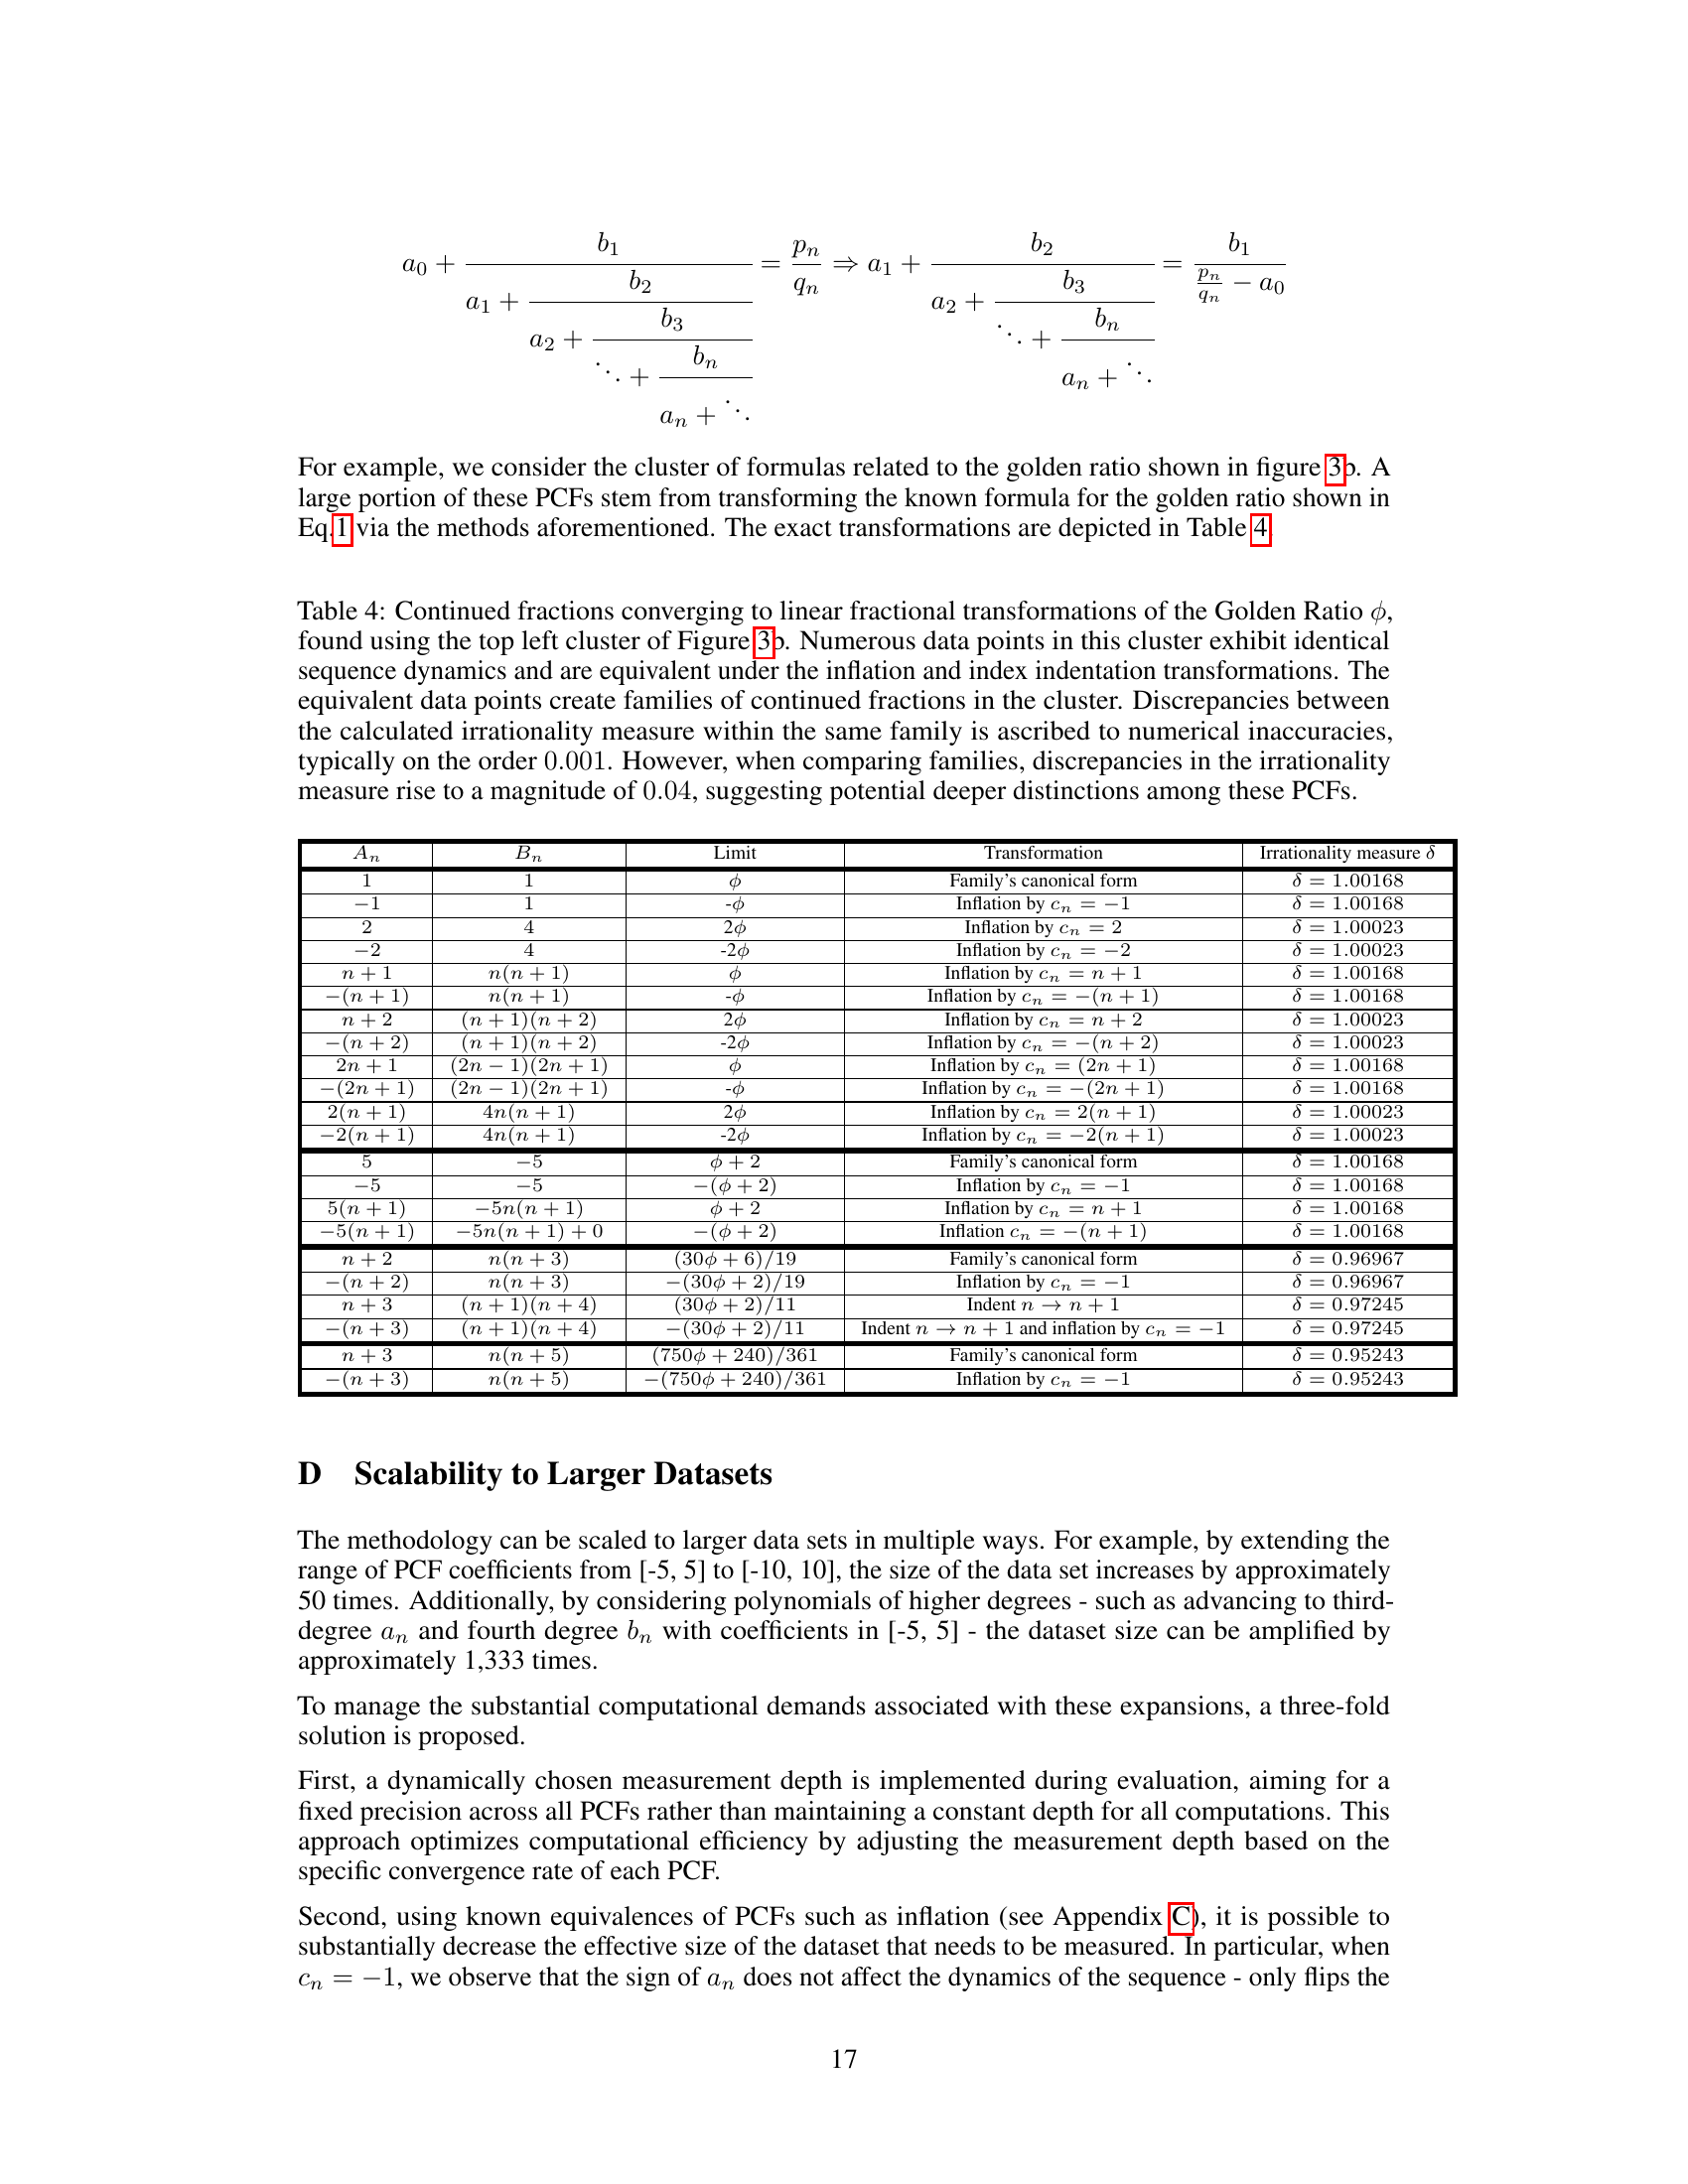
🔼 This table shows examples of continued fractions converging to linear fractional transformations of the golden ratio (φ). It demonstrates how seemingly different continued fractions can share the same underlying dynamic behavior and be related through simple transformations (inflation and index indentation). The table highlights the consistency of the irrationality measure within families of equivalent fractions and shows a slight increase in the discrepancy between families, which suggests deeper mathematical differences.
read the caption
Table 4: Continued fractions converging to linear fractional transformations of the Golden Ratio φ, found using the top left cluster of Figure 3b. Numerous data points in this cluster exhibit identical sequence dynamics and are equivalent under the inflation and index indentation transformations. The equivalent data points create families of continued fractions in the cluster. Discrepancies between the calculated irrationality measure within the same family is ascribed to numerical inaccuracies, typically on the order 0.001. However, when comparing families, discrepancies in the irrationality measure rise to a magnitude of 0.04, suggesting potential deeper distinctions among these PCFs.
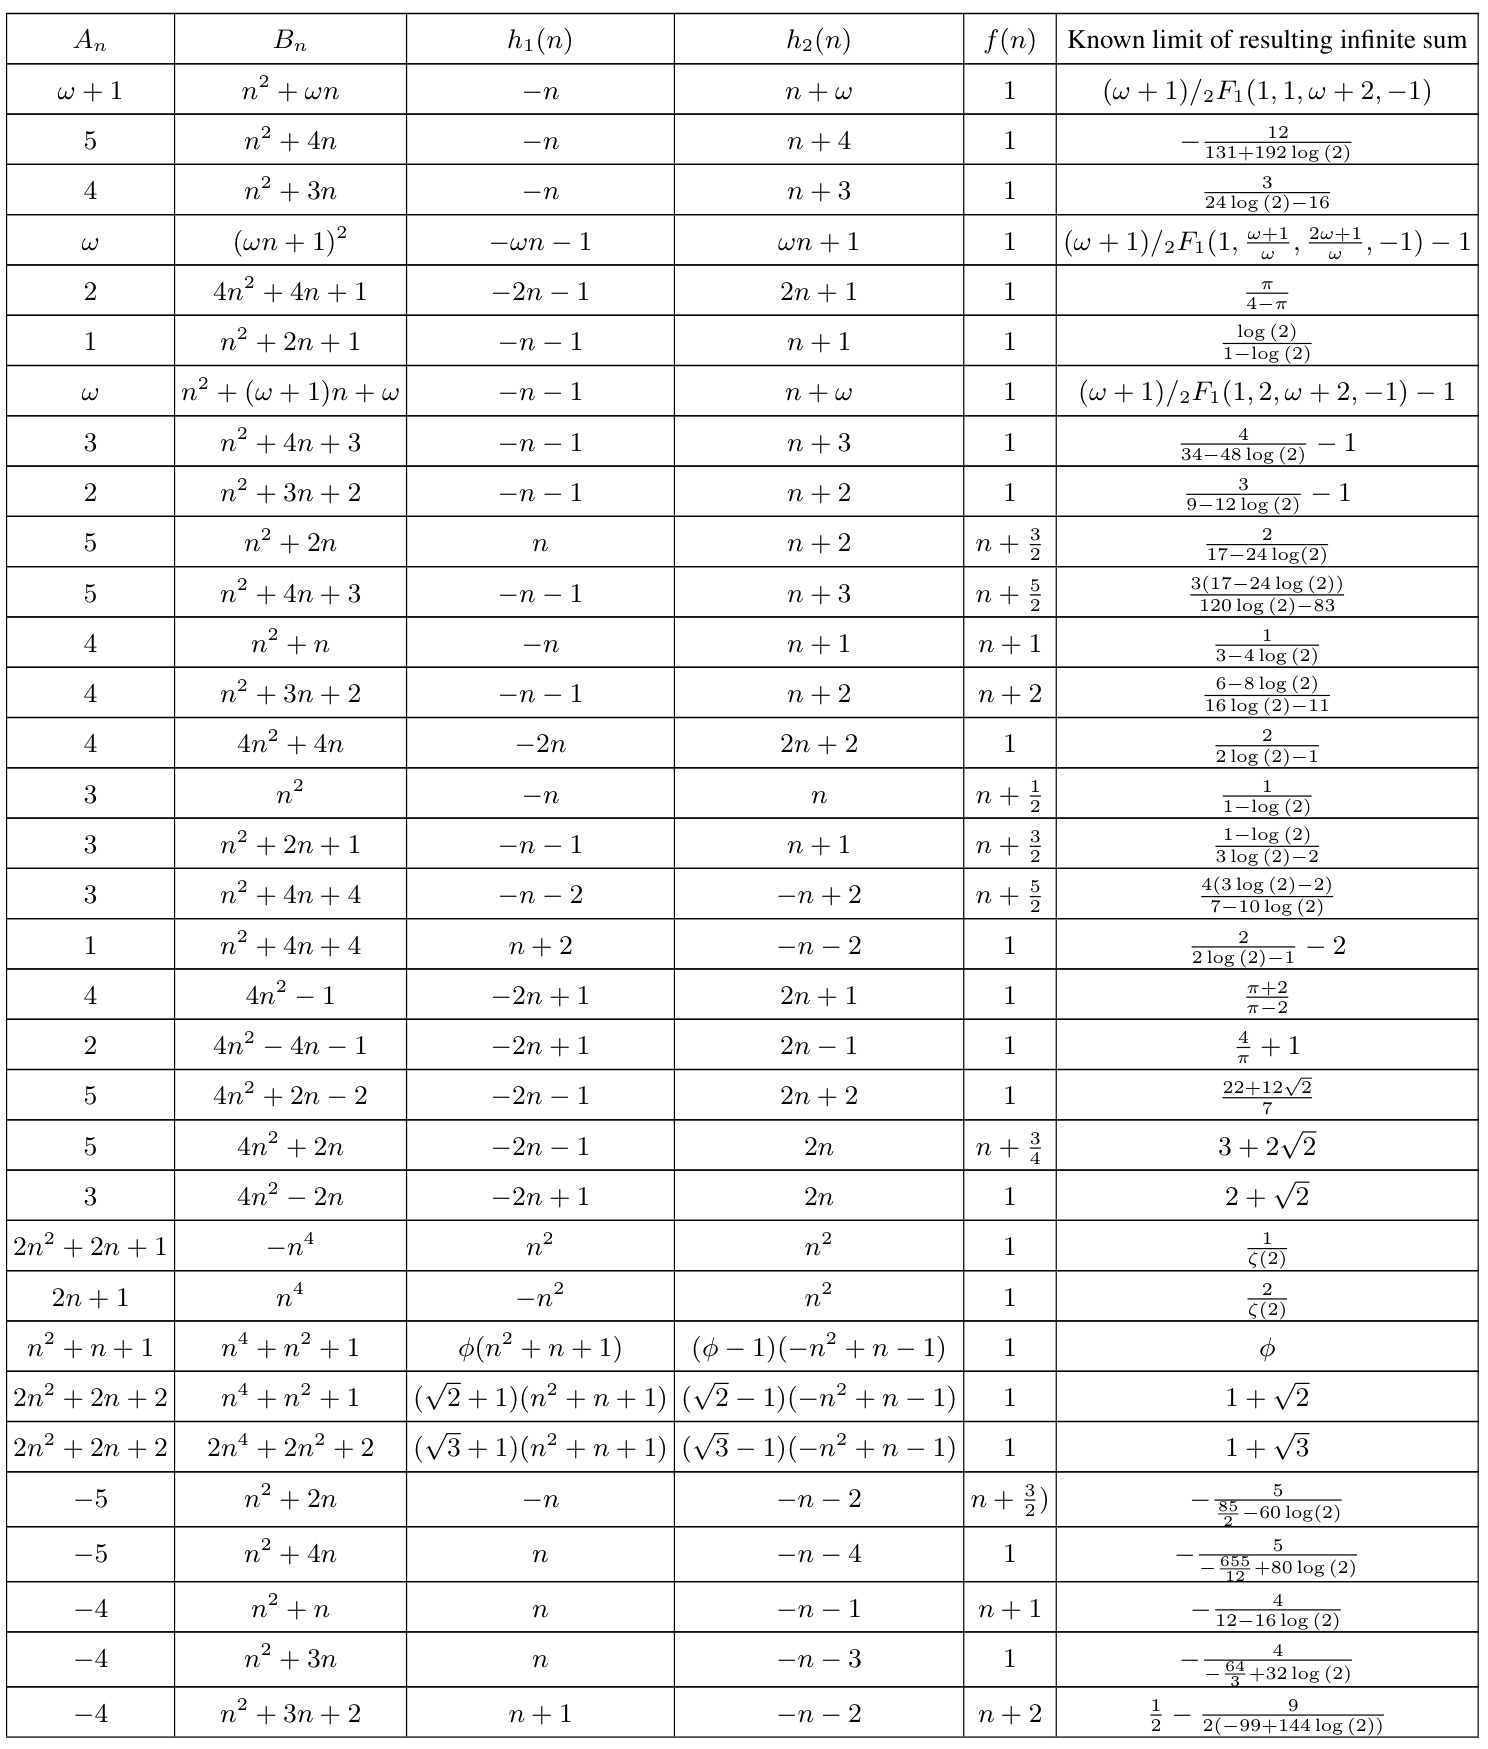
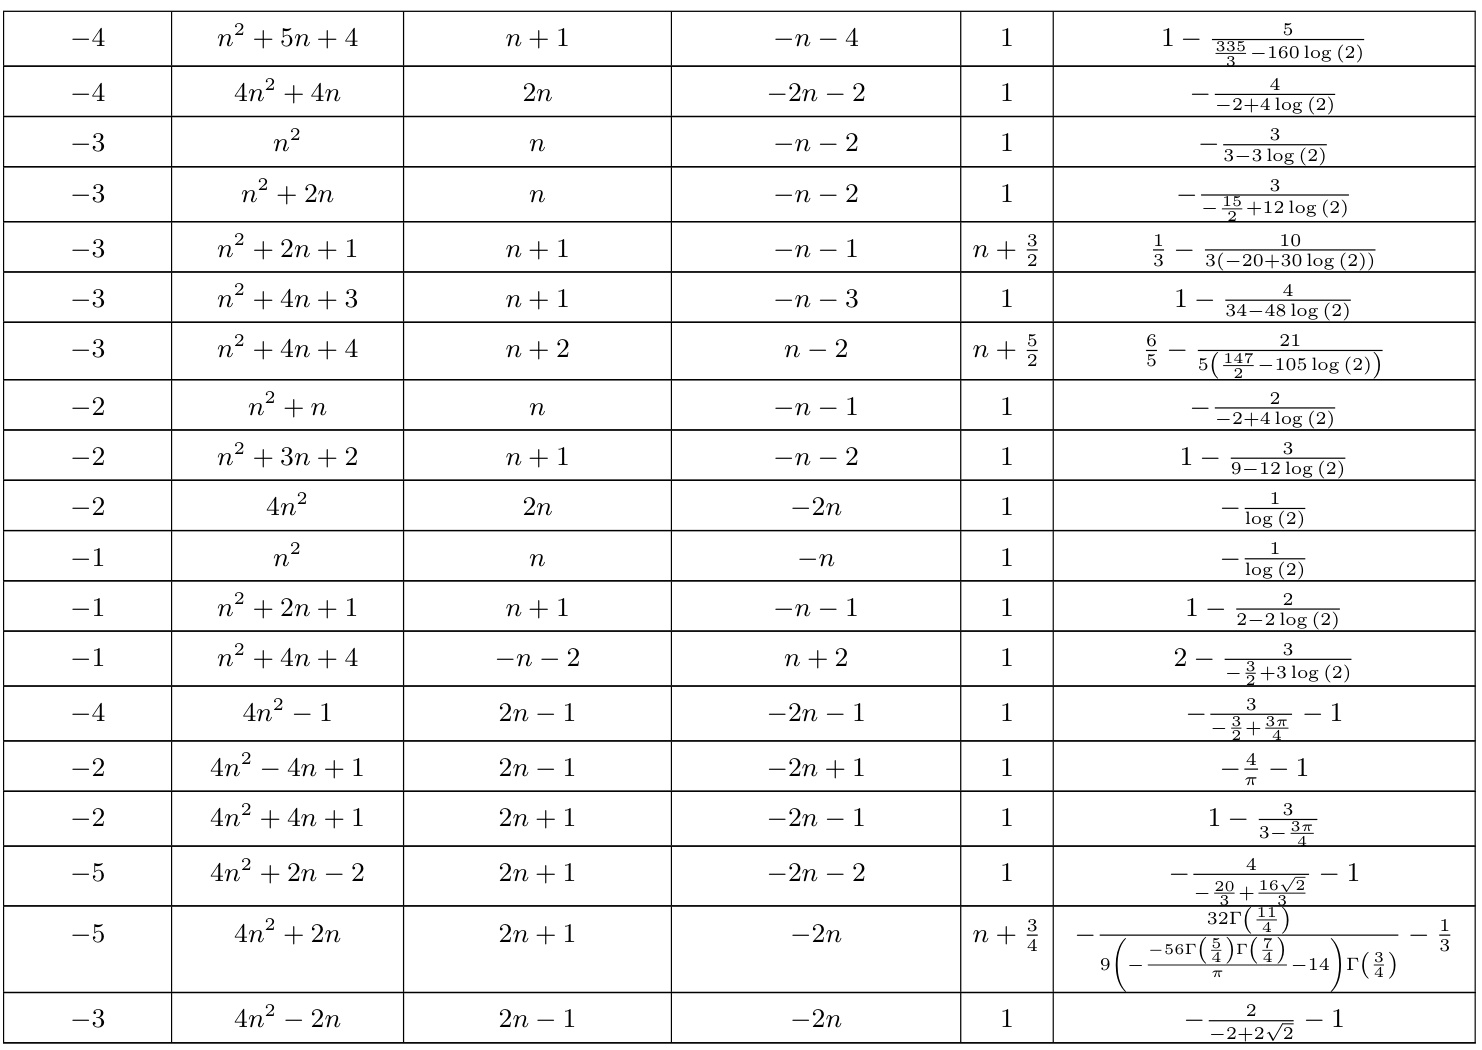
🔼 This table presents a list of formulas for mathematical constants that were automatically generated by the system and then analytically proven. The table shows the polynomials used to define the continued fraction, the convergence dynamics (h1(n), h2(n)), and the resulting mathematical constant. Lines 1, 4, and 7 represent infinite families of formulas, derived from patterns discovered in the dataset. Appendix A.2 provides details on the methods used for analytical proof.
read the caption
Table 5: This is a table showing the automatically generated conjectured formulas that were analytically proven. For the method of proving, see appendix A.2. Note that lines 1, 4 and 7 are proven infinite families of formulas, generalized from the cases found in the dataset.
🔼 This table presents formulas for mathematical constants that were automatically generated and then analytically proven. Each row shows a continued fraction formula, along with its constituent polynomials an and bn, helper polynomials h1(n) and h2(n), a function f(n), and the resulting mathematical constant. Note that some rows represent infinite families of formulas, derived from specific cases found in the data.
read the caption
Table 5: This is a table showing the automatically generated conjectured formulas that were analytically proven. For the method of proving, see appendix A.2. Note that lines 1, 4 and 7 are proven infinite families of formulas, generalized from the cases found in the dataset.
Full paper#