TL;DR#
Visual reinforcement learning (RL) struggles with high-dimensional state spaces, leading to issues in exploration and exploitation. While consistency models have shown promise in online state-based RL, their application to visual RL remains unexplored, and existing methods are unstable, especially with high-dimensional spaces and actor-critic frameworks. The non-stationary nature of online RL data also poses a significant challenge for the application of consistency models.
To address these issues, this paper proposes CP3ER, a novel consistency policy that incorporates prioritized proximal experience regularization and sample-based entropy regularization. This approach effectively stabilizes training and improves sample efficiency by creating an appropriate proxy policy for regularization and uses weighted sampling. CP3ER achieves state-of-the-art results across multiple visual RL benchmark tasks. This is the first work to successfully extend consistency models to visual RL, demonstrating their potential for addressing the key challenges in this field.
Key Takeaways#
Why does it matter?#
This paper is crucial because it bridges the gap between consistency models and visual reinforcement learning (RL), a field currently facing challenges in sample efficiency and training stability. The proposed CP3ER method achieves state-of-the-art results, showcasing the potential of consistency models for visual RL and opening new avenues for research in this important area. Its focus on sample efficiency is particularly relevant given the high cost of data collection in visual RL. Furthermore, the identified instability issues in existing consistency-based RL methods highlight a previously overlooked challenge.
Visual Insights#
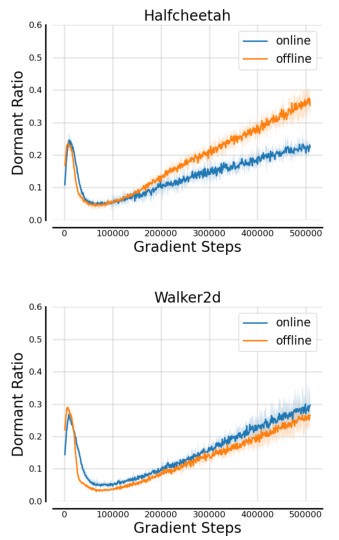
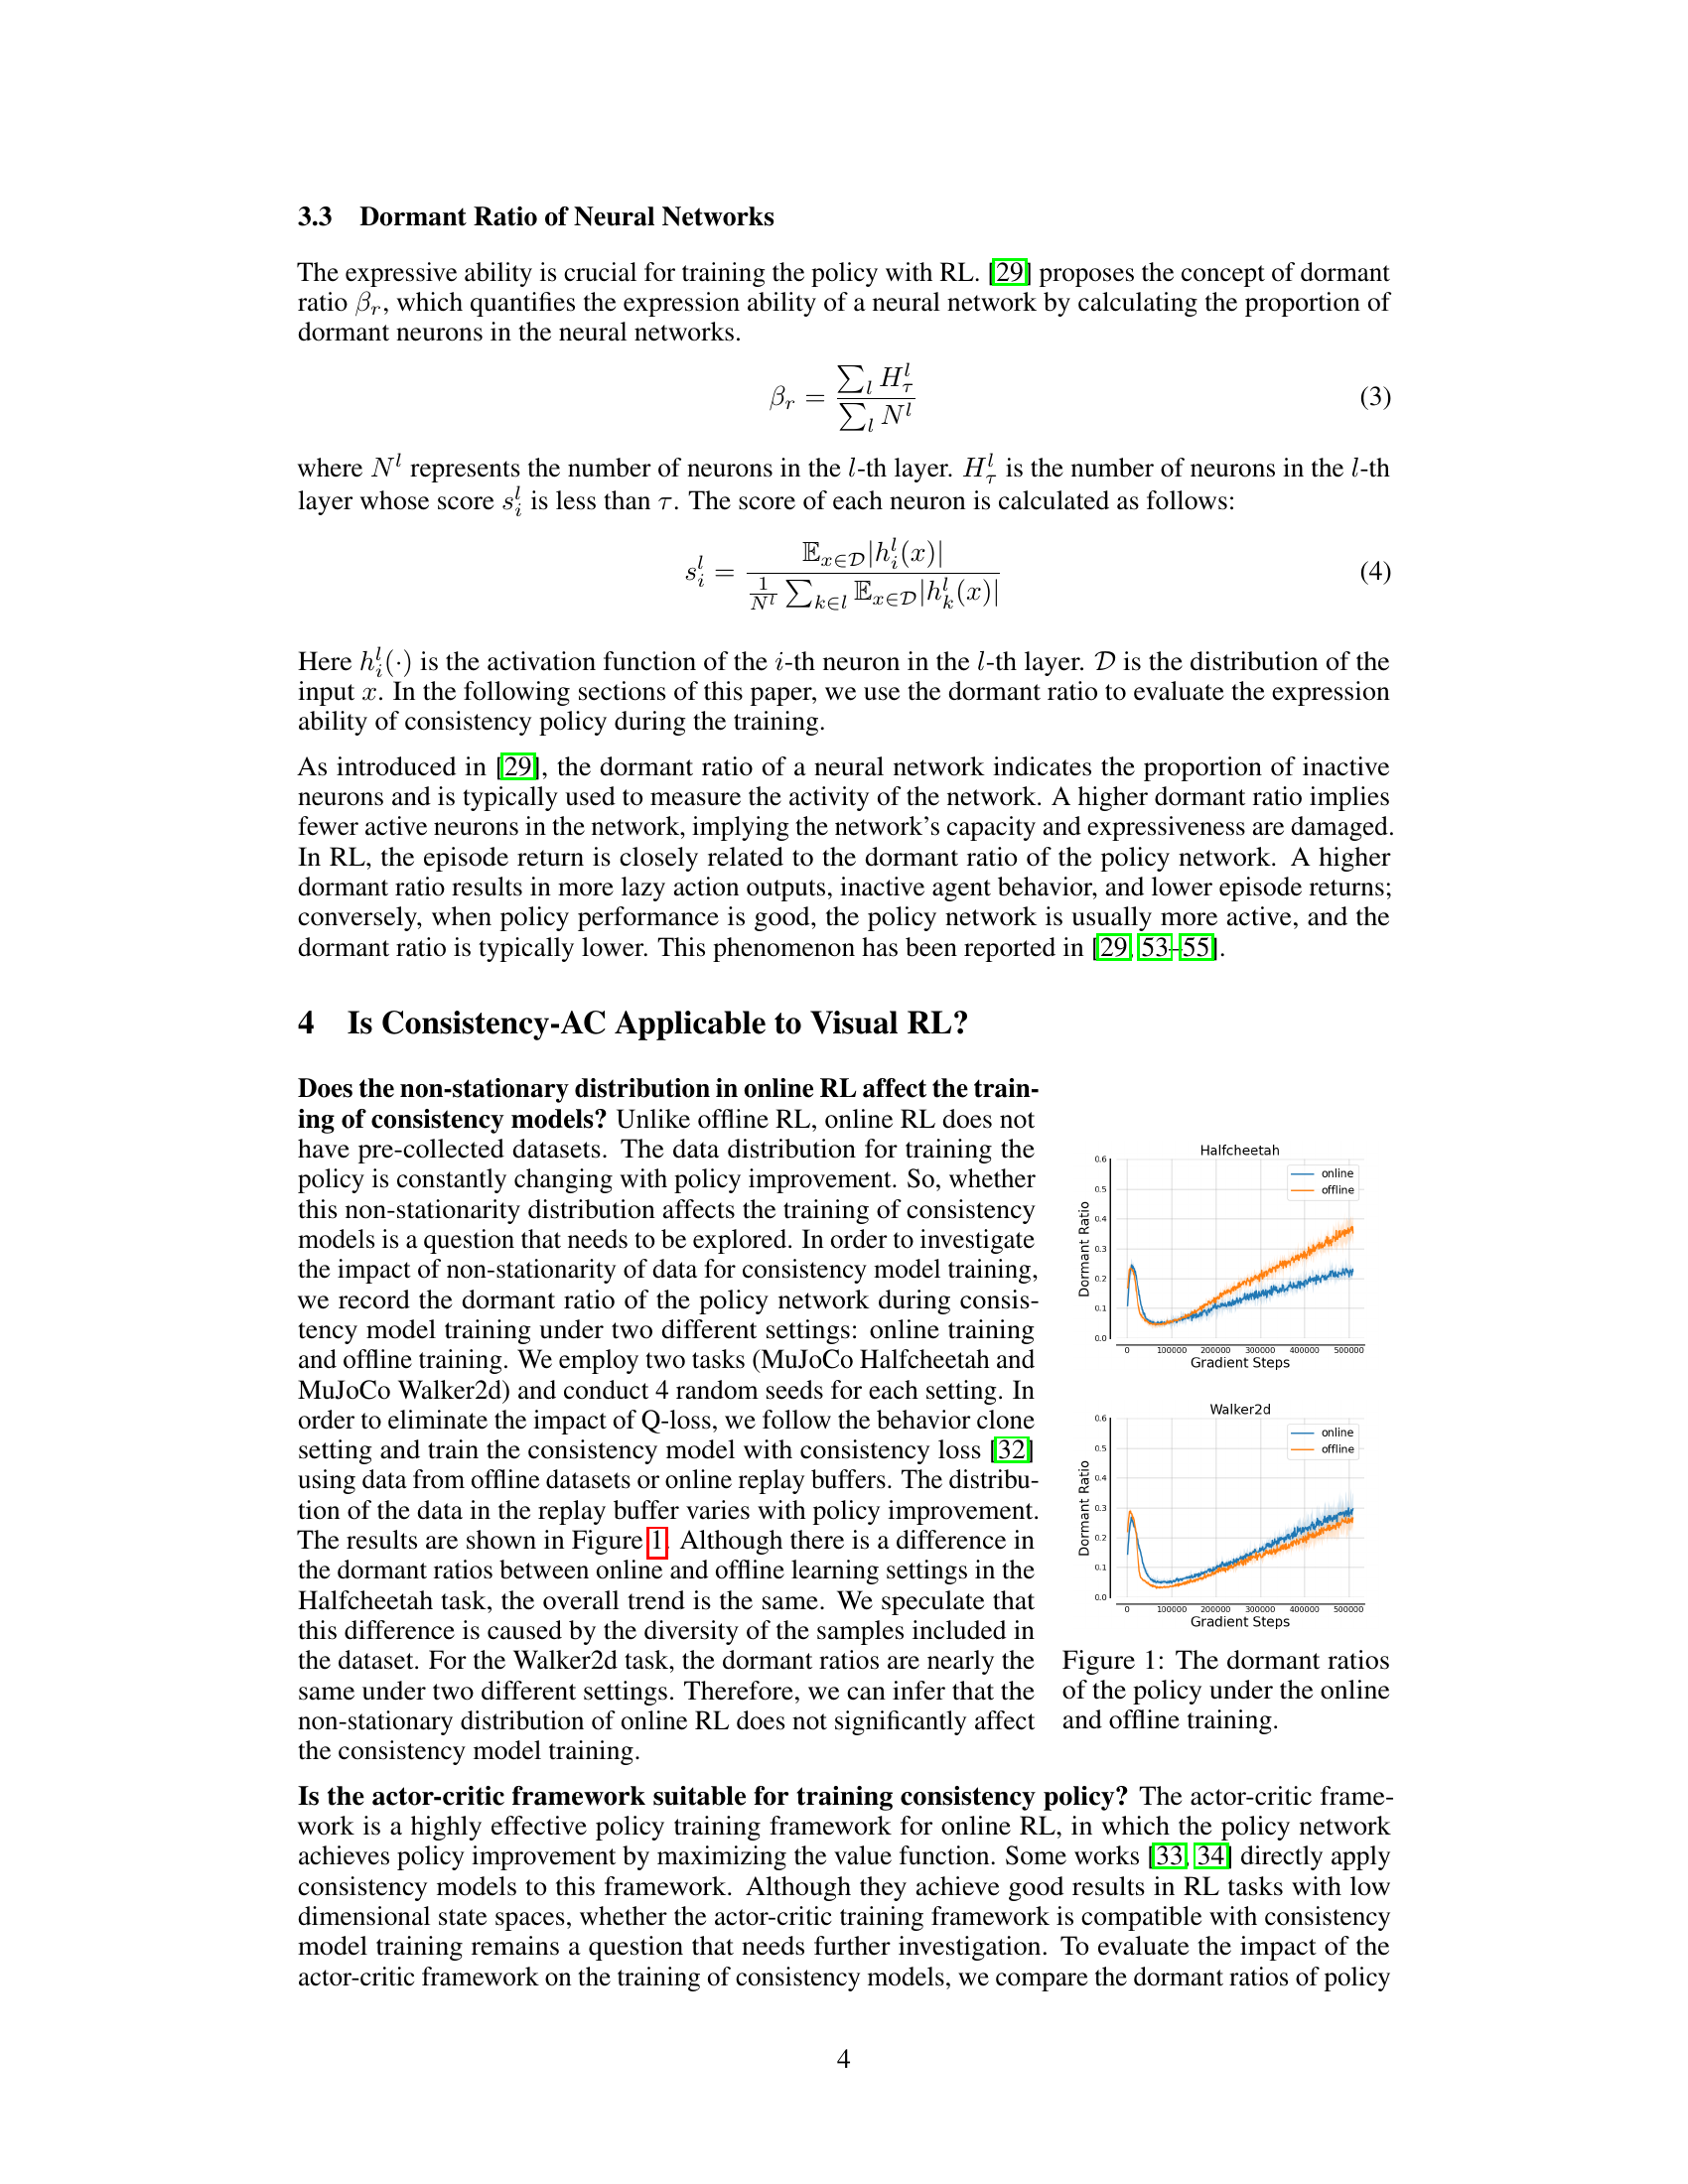
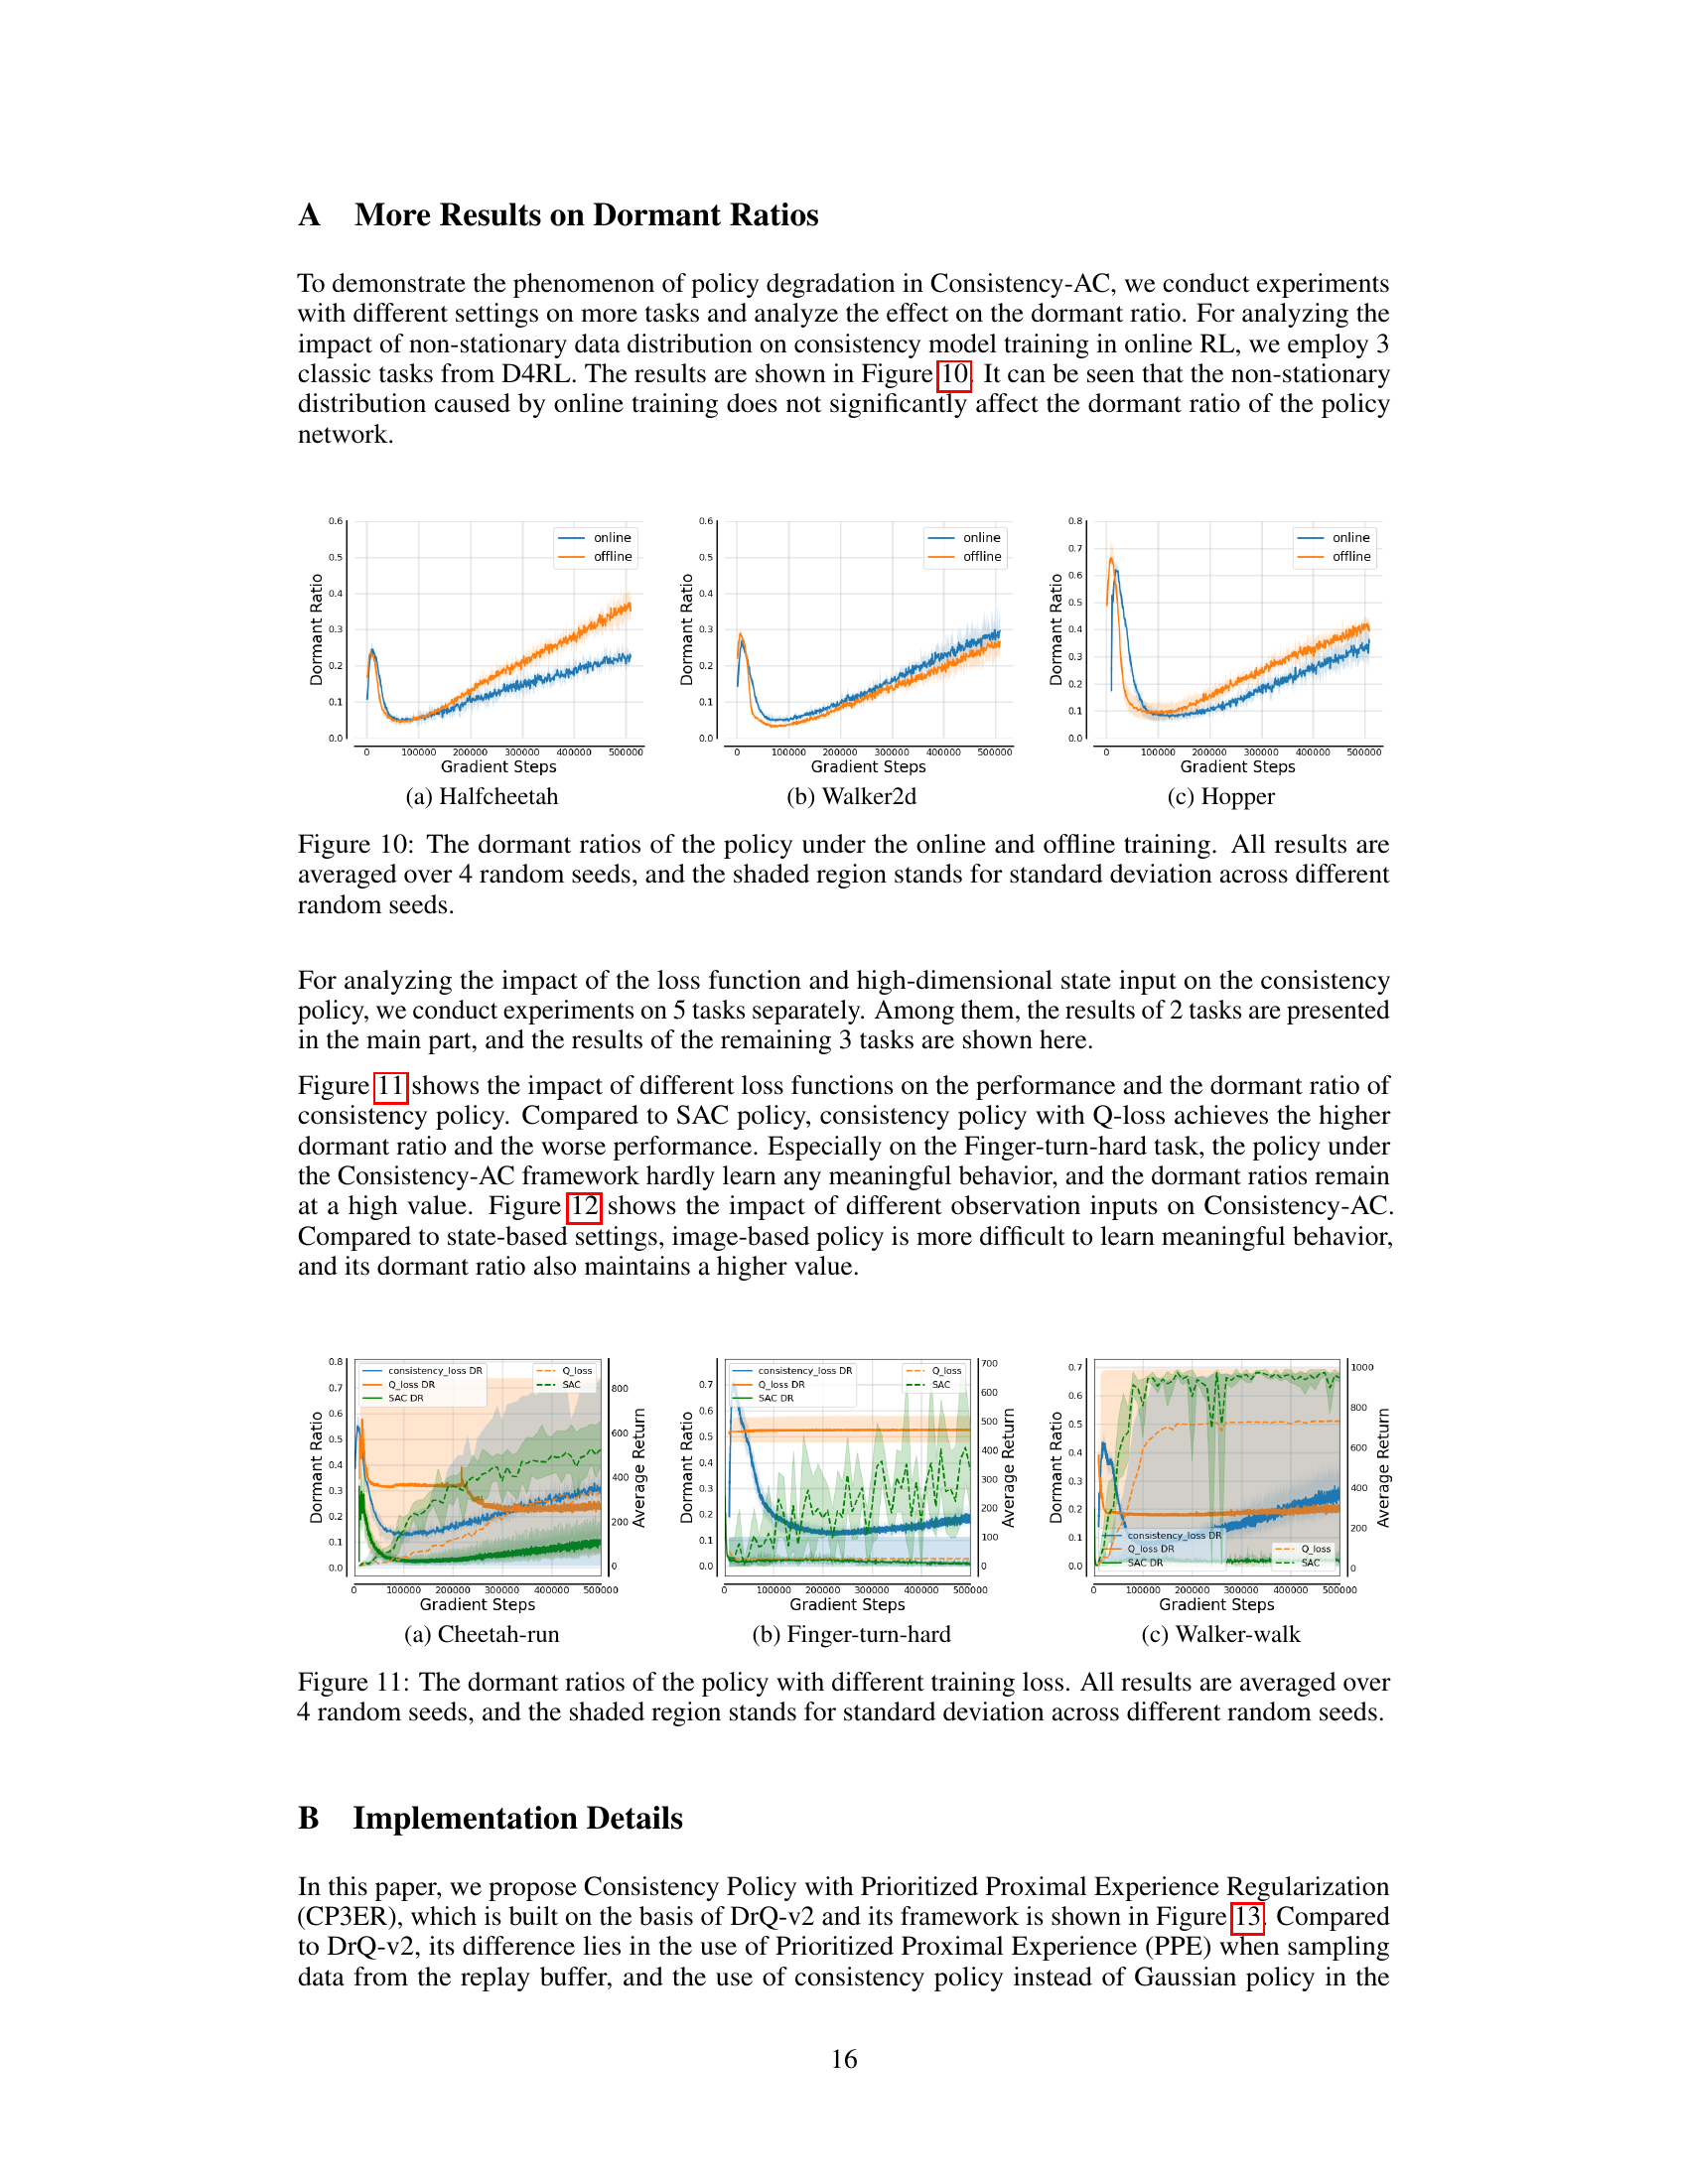
🔼 This figure displays the dormant ratios of the policy network during both online and offline training. The dormant ratio is a metric that reflects the network’s expressive ability; higher ratios indicate more inactive neurons and thus reduced expressiveness. The graph shows the dormant ratio plotted against the number of gradient steps in the training process. Separate lines are shown for online and offline training, with shaded regions representing the standard deviation across four different random seeds. This visualizes the impact of non-stationary data distribution (in online RL) on the stability and expressiveness of the consistency policy network, showing whether the non-stationary data significantly affects training.
read the caption
Figure 10: The dormant ratios of the policy under the online and offline training. All results are averaged over 4 random seeds, and the shaded region stands for standard deviation across different random seeds.
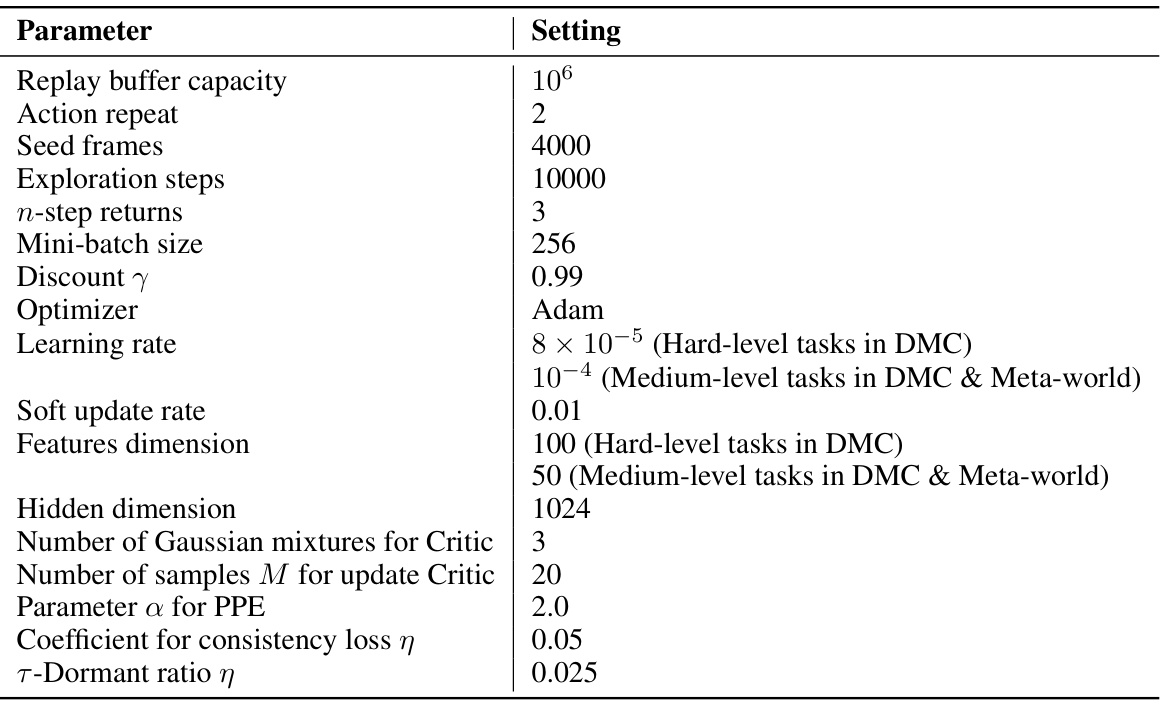
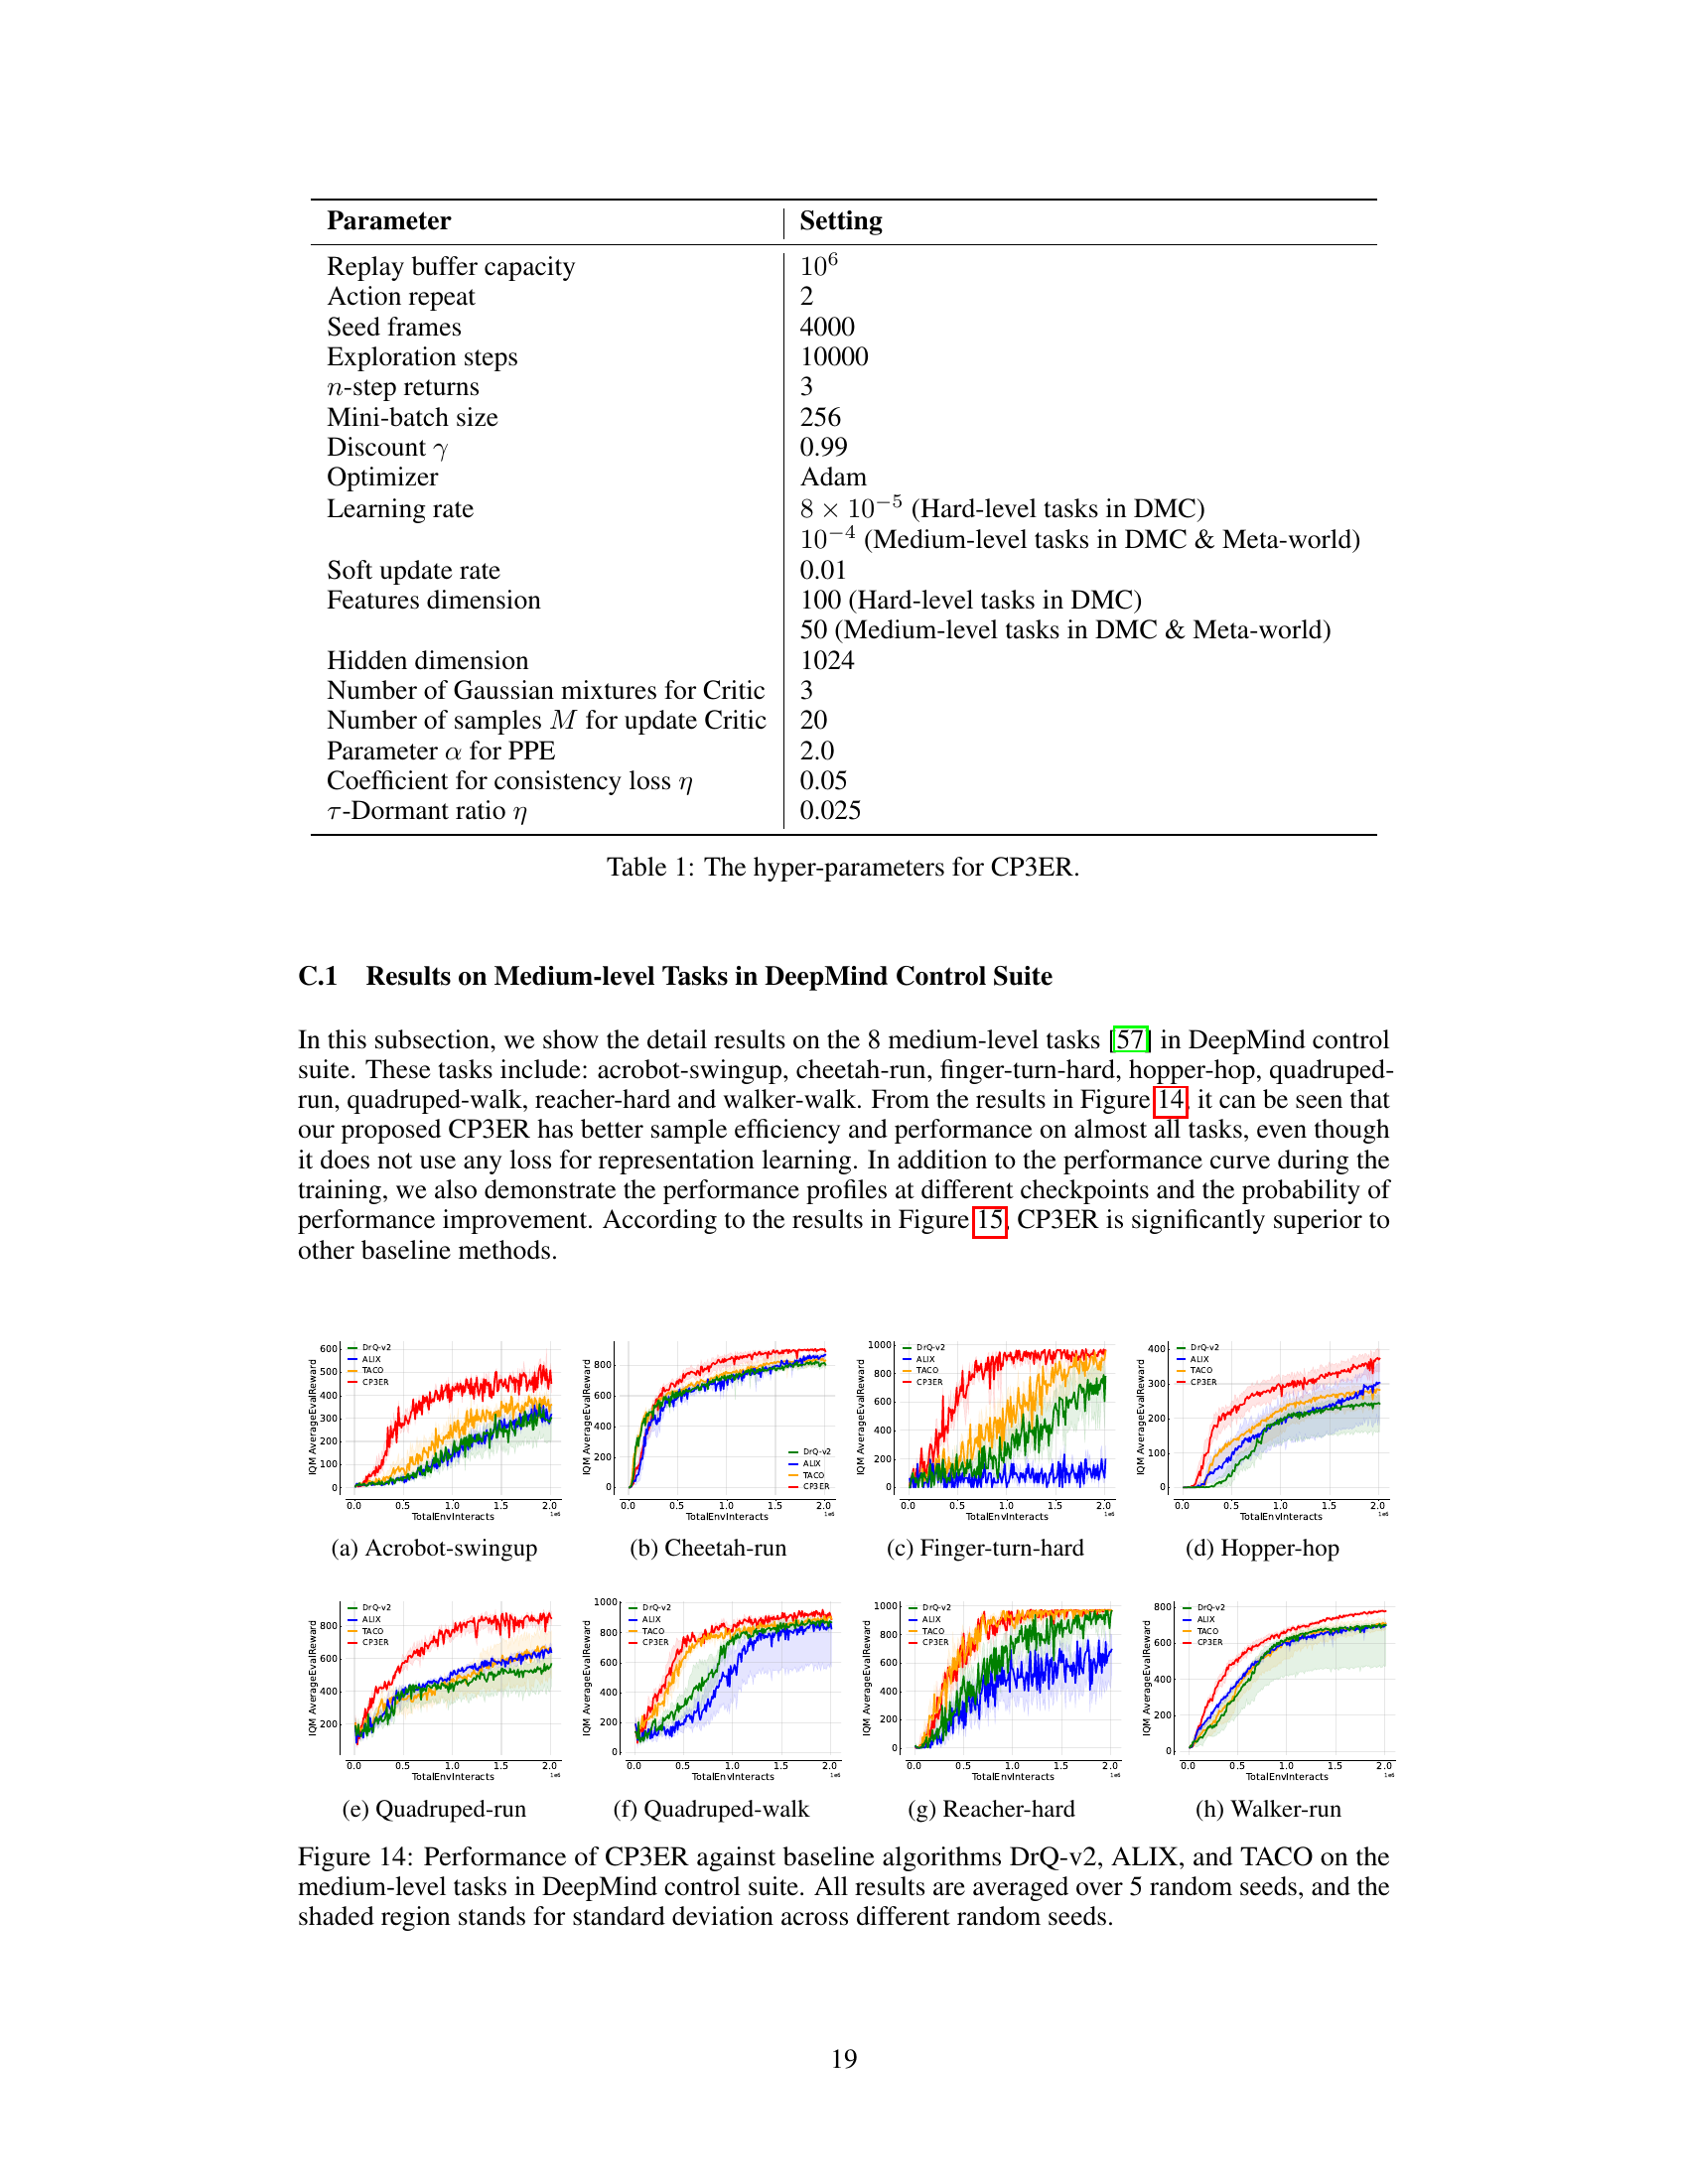
🔼 This table lists the hyperparameters used in the CP3ER algorithm. It includes parameters related to the replay buffer, training process, network architecture, and regularization. Note that some parameters, such as the learning rate and feature dimension, have different settings for different task difficulty levels (hard vs. medium).
read the caption
Table 1: The hyper-parameters for CP3ER.
In-depth insights#
Visual RL Stability#
Visual Reinforcement Learning (RL) faces significant challenges due to high-dimensional state spaces inherent in visual data. This dimensionality leads to instability in training, making it difficult to achieve both effective exploration and exploitation. Sample inefficiency is a major concern as vast amounts of data are required to train effective policies. The non-stationarity of the data distribution further exacerbates these issues, as the policy and environment dynamics change over time. Addressing these challenges requires techniques to improve training stability, enhancing the robustness of learning algorithms to high-dimensional inputs and non-stationary data, and boosting sample efficiency. Prioritized experience replay, entropy regularization, and carefully designed policy architectures are crucial aspects of enhancing stability.
CP3ER Framework#
The CP3ER framework, designed for visual reinforcement learning, tackles the instability and inefficiency inherent in high-dimensional state spaces. It builds upon consistency models, offering a time-efficient alternative to traditional diffusion models. The core innovation lies in incorporating prioritized proximal experience regularization (PPER) to stabilize training and improve sample efficiency. Unlike previous methods that directly apply the Q-loss within an actor-critic framework, CP3ER introduces sample-based entropy regularization to mitigate the issues caused by Q-loss, preventing the policy network from prematurely collapsing into local optima. PPER, by using weighted sampling from the replay buffer, further refines sample efficiency, focusing on data points relevant to the current policy. The integration of a mixture of Gaussian (MoG) for value estimation improves accuracy and robustness. Overall, CP3ER presents a sophisticated approach combining the benefits of consistency models with effective regularization strategies to improve sample efficiency and stability, paving the way for more reliable performance in complex visual RL environments.
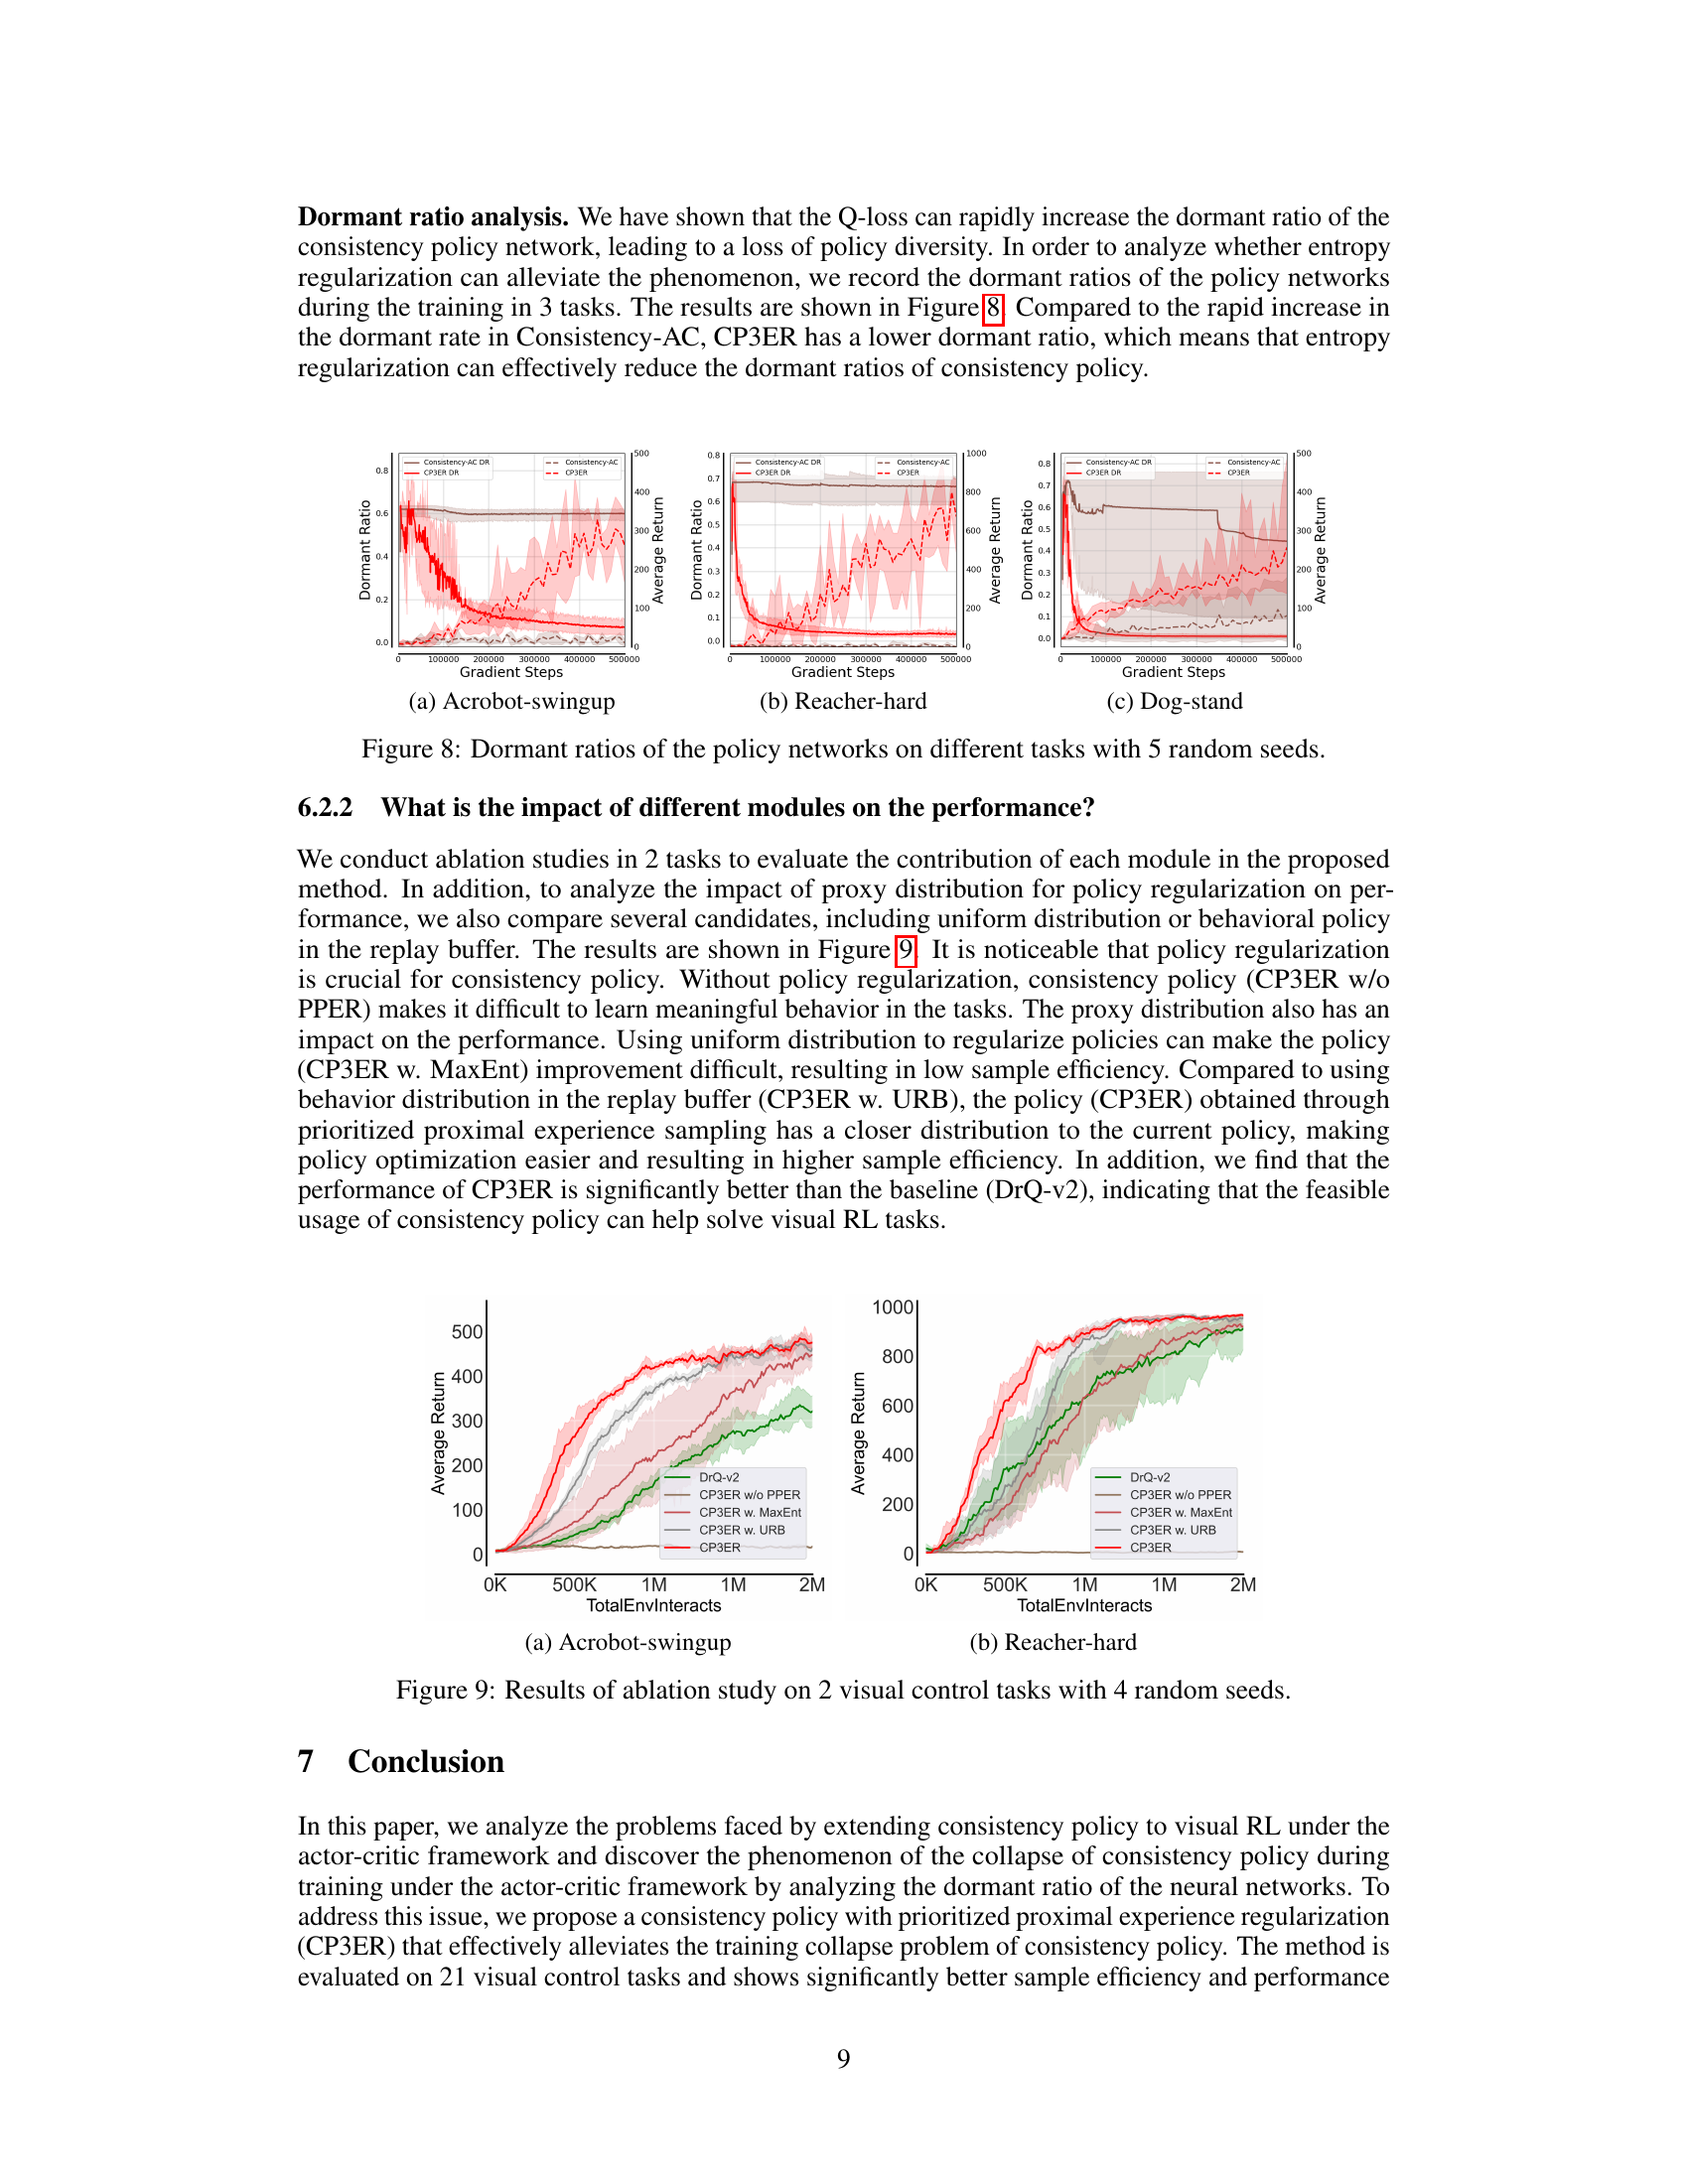
Policy Regularization#
Policy regularization, in the context of reinforcement learning, addresses the challenge of unstable or inefficient policy learning, particularly in high-dimensional state spaces. It aims to stabilize the training process by constraining or regularizing the policy’s behavior, preventing it from converging to suboptimal local optima or exhibiting erratic exploration. Several techniques are employed, such as entropy regularization, which encourages exploration by maximizing policy entropy, and proximal policy optimization (PPO), which limits the policy update at each step to ensure stability. Prioritized proximal experience regularization further refines this, weighting samples in the training process to prioritize those closer to the current policy, improving sample efficiency. The choice of regularization technique and its parameters significantly impact the learning process. The effectiveness of policy regularization is particularly apparent in visual reinforcement learning where high dimensionality poses substantial hurdles, making it a crucial aspect for achieving both stable and efficient policy learning.
High-Dim State Space#
The challenges posed by high-dimensional state spaces in reinforcement learning (RL), especially in visual RL, are significant. High dimensionality drastically increases the complexity of both exploration and exploitation, demanding far greater computational resources and potentially leading to unstable training. Traditional methods, often relying on simplistic policy representations like Gaussian distributions, struggle to capture the nuances of complex behaviors in such spaces, resulting in poor sample efficiency and suboptimal policies. The paper addresses this by exploring consistency models and suggests a sample-based entropy regularization technique, showing promising results in stabilizing training. The use of prioritized proximal experience regularization further improves sample efficiency, highlighting the effectiveness of advanced techniques in dealing with high-dimensional state spaces. The high dimensionality of visual data is a key factor in this challenge; it underscores the need for novel solutions beyond simple parametric approximations.
Future Work#
Future research directions stemming from this work on generalizing consistency policies to visual reinforcement learning (RL) could explore several promising avenues. Improving the exploration capabilities of consistency-based policies is crucial, potentially through incorporating techniques like entropy regularization or more sophisticated exploration strategies. Investigating the impact of different architectural choices on policy stability and performance is another key area. A more in-depth understanding of the interaction between the actor-critic framework and consistency models is needed to address the observed instability and potentially develop more robust training methods. Finally, applying the approach to more complex and diverse visual RL tasks such as robotics and navigation, while carefully considering factors like real-world data limitations, would be valuable. Thorough theoretical analysis of the method’s convergence and generalization properties would bolster its scientific rigor.
More visual insights#
More on figures
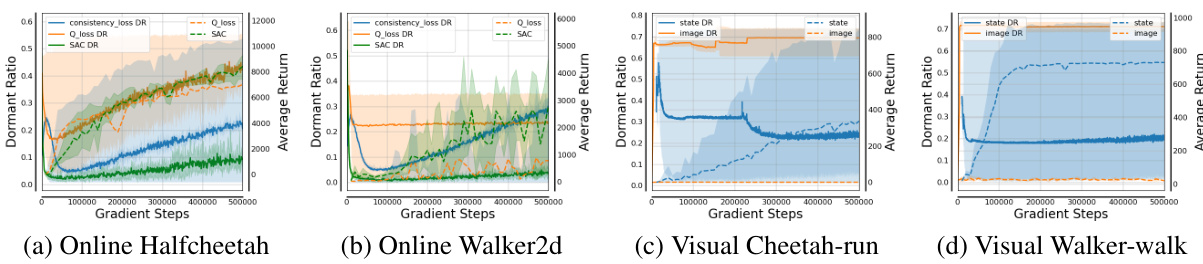
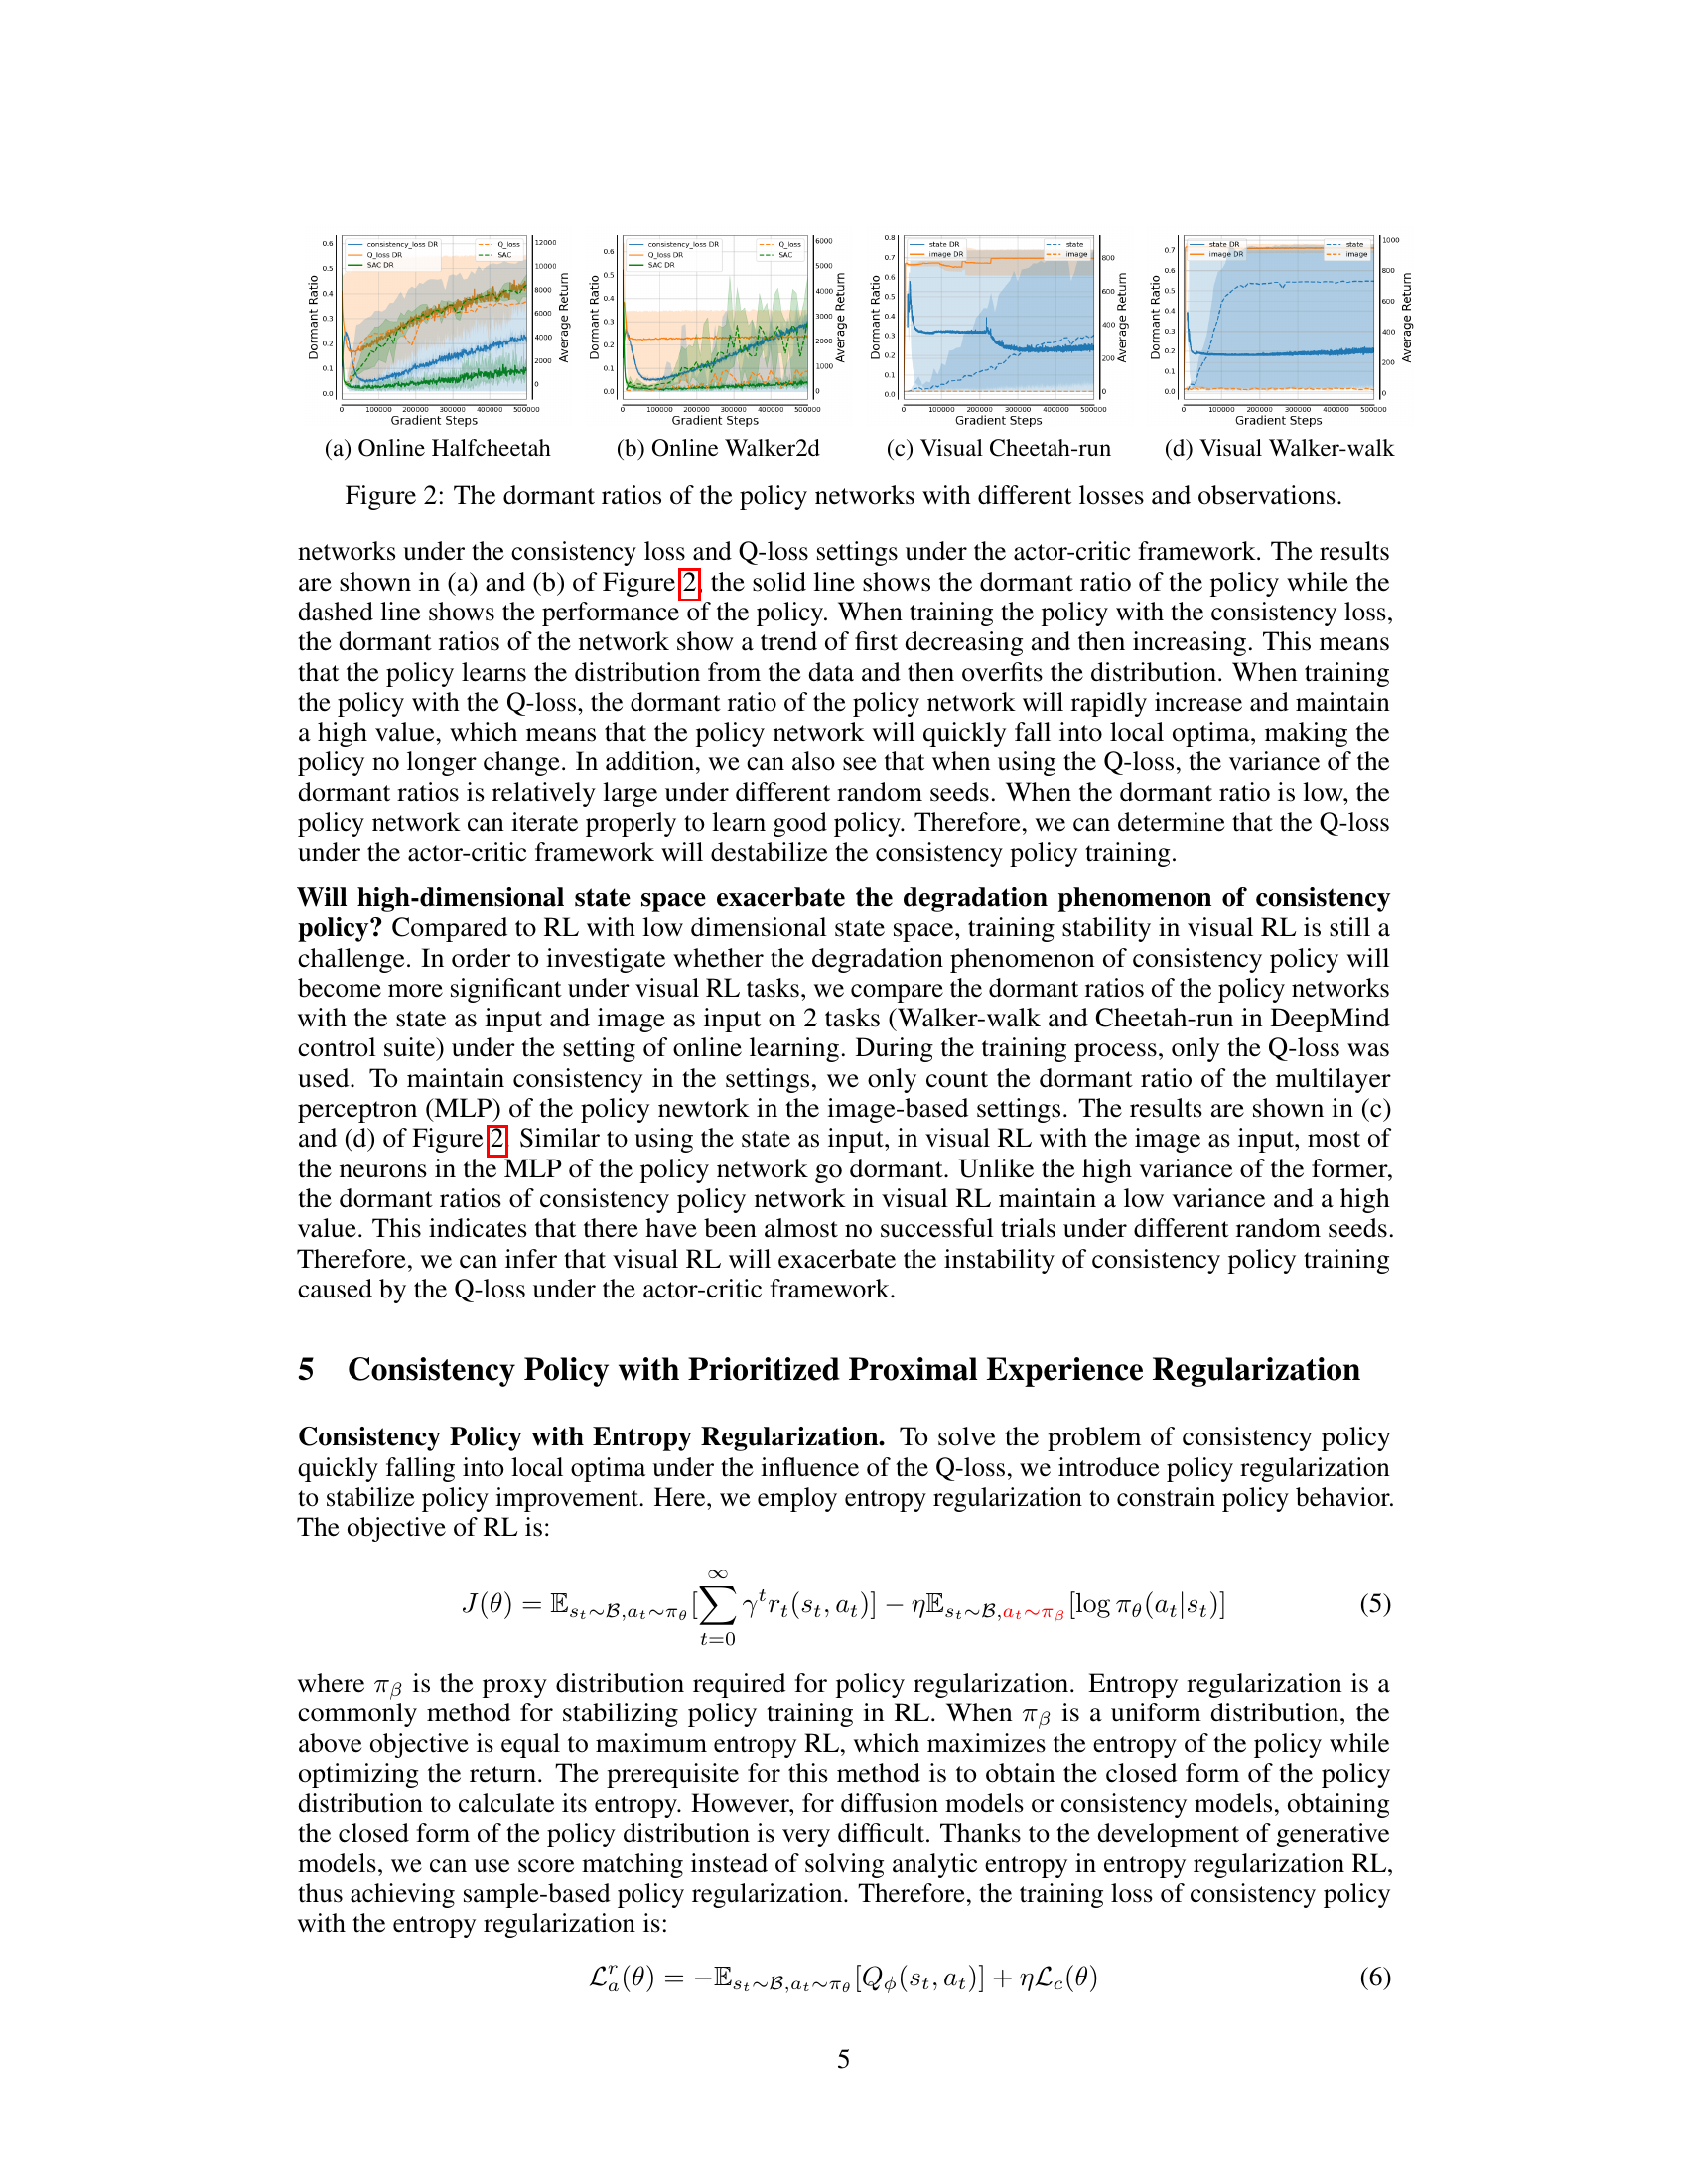
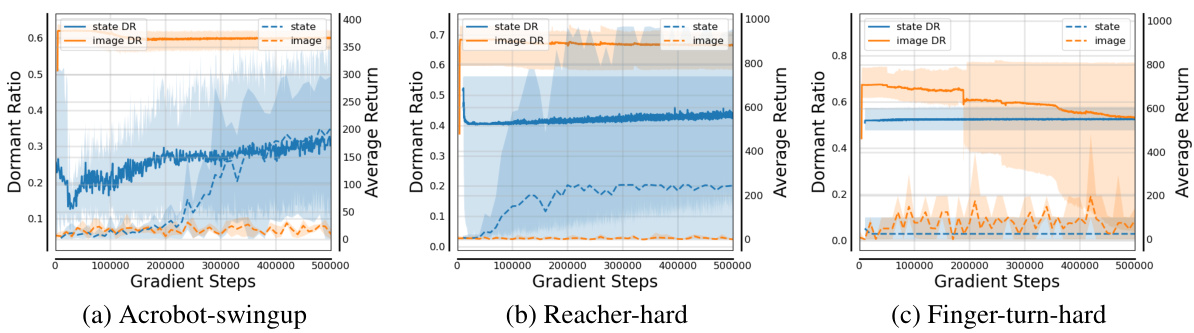
🔼 This figure visualizes the dormant ratios of policy networks trained under various conditions. The top row (a) and (b) shows dormant ratios for online Halfcheetah and Walker2d tasks using consistency loss and Q-loss, respectively, with different random seeds. The bottom row (c) and (d) shows a comparison between using state (low-dimensional) and image (high-dimensional) data as input for the same visual RL tasks, again comparing the consistency loss and Q-loss methods.
read the caption
Figure 2: The dormant ratios of the policy networks with different losses and observations.
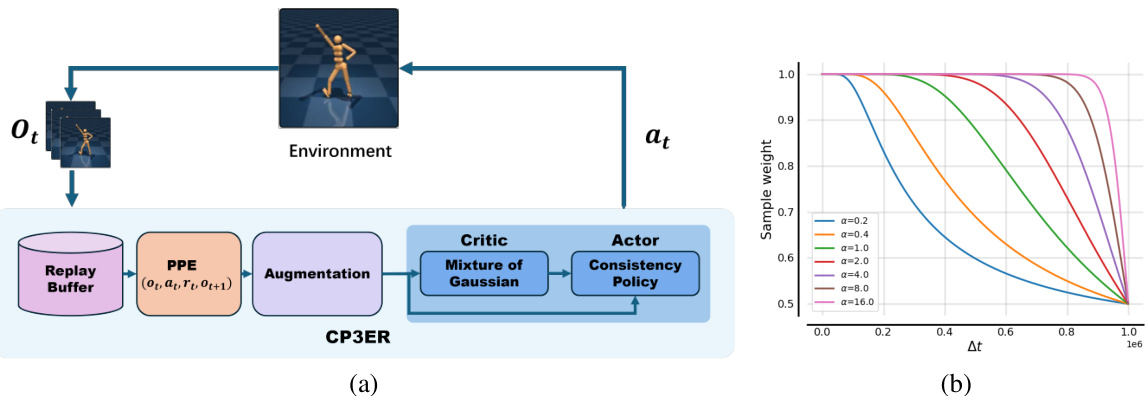
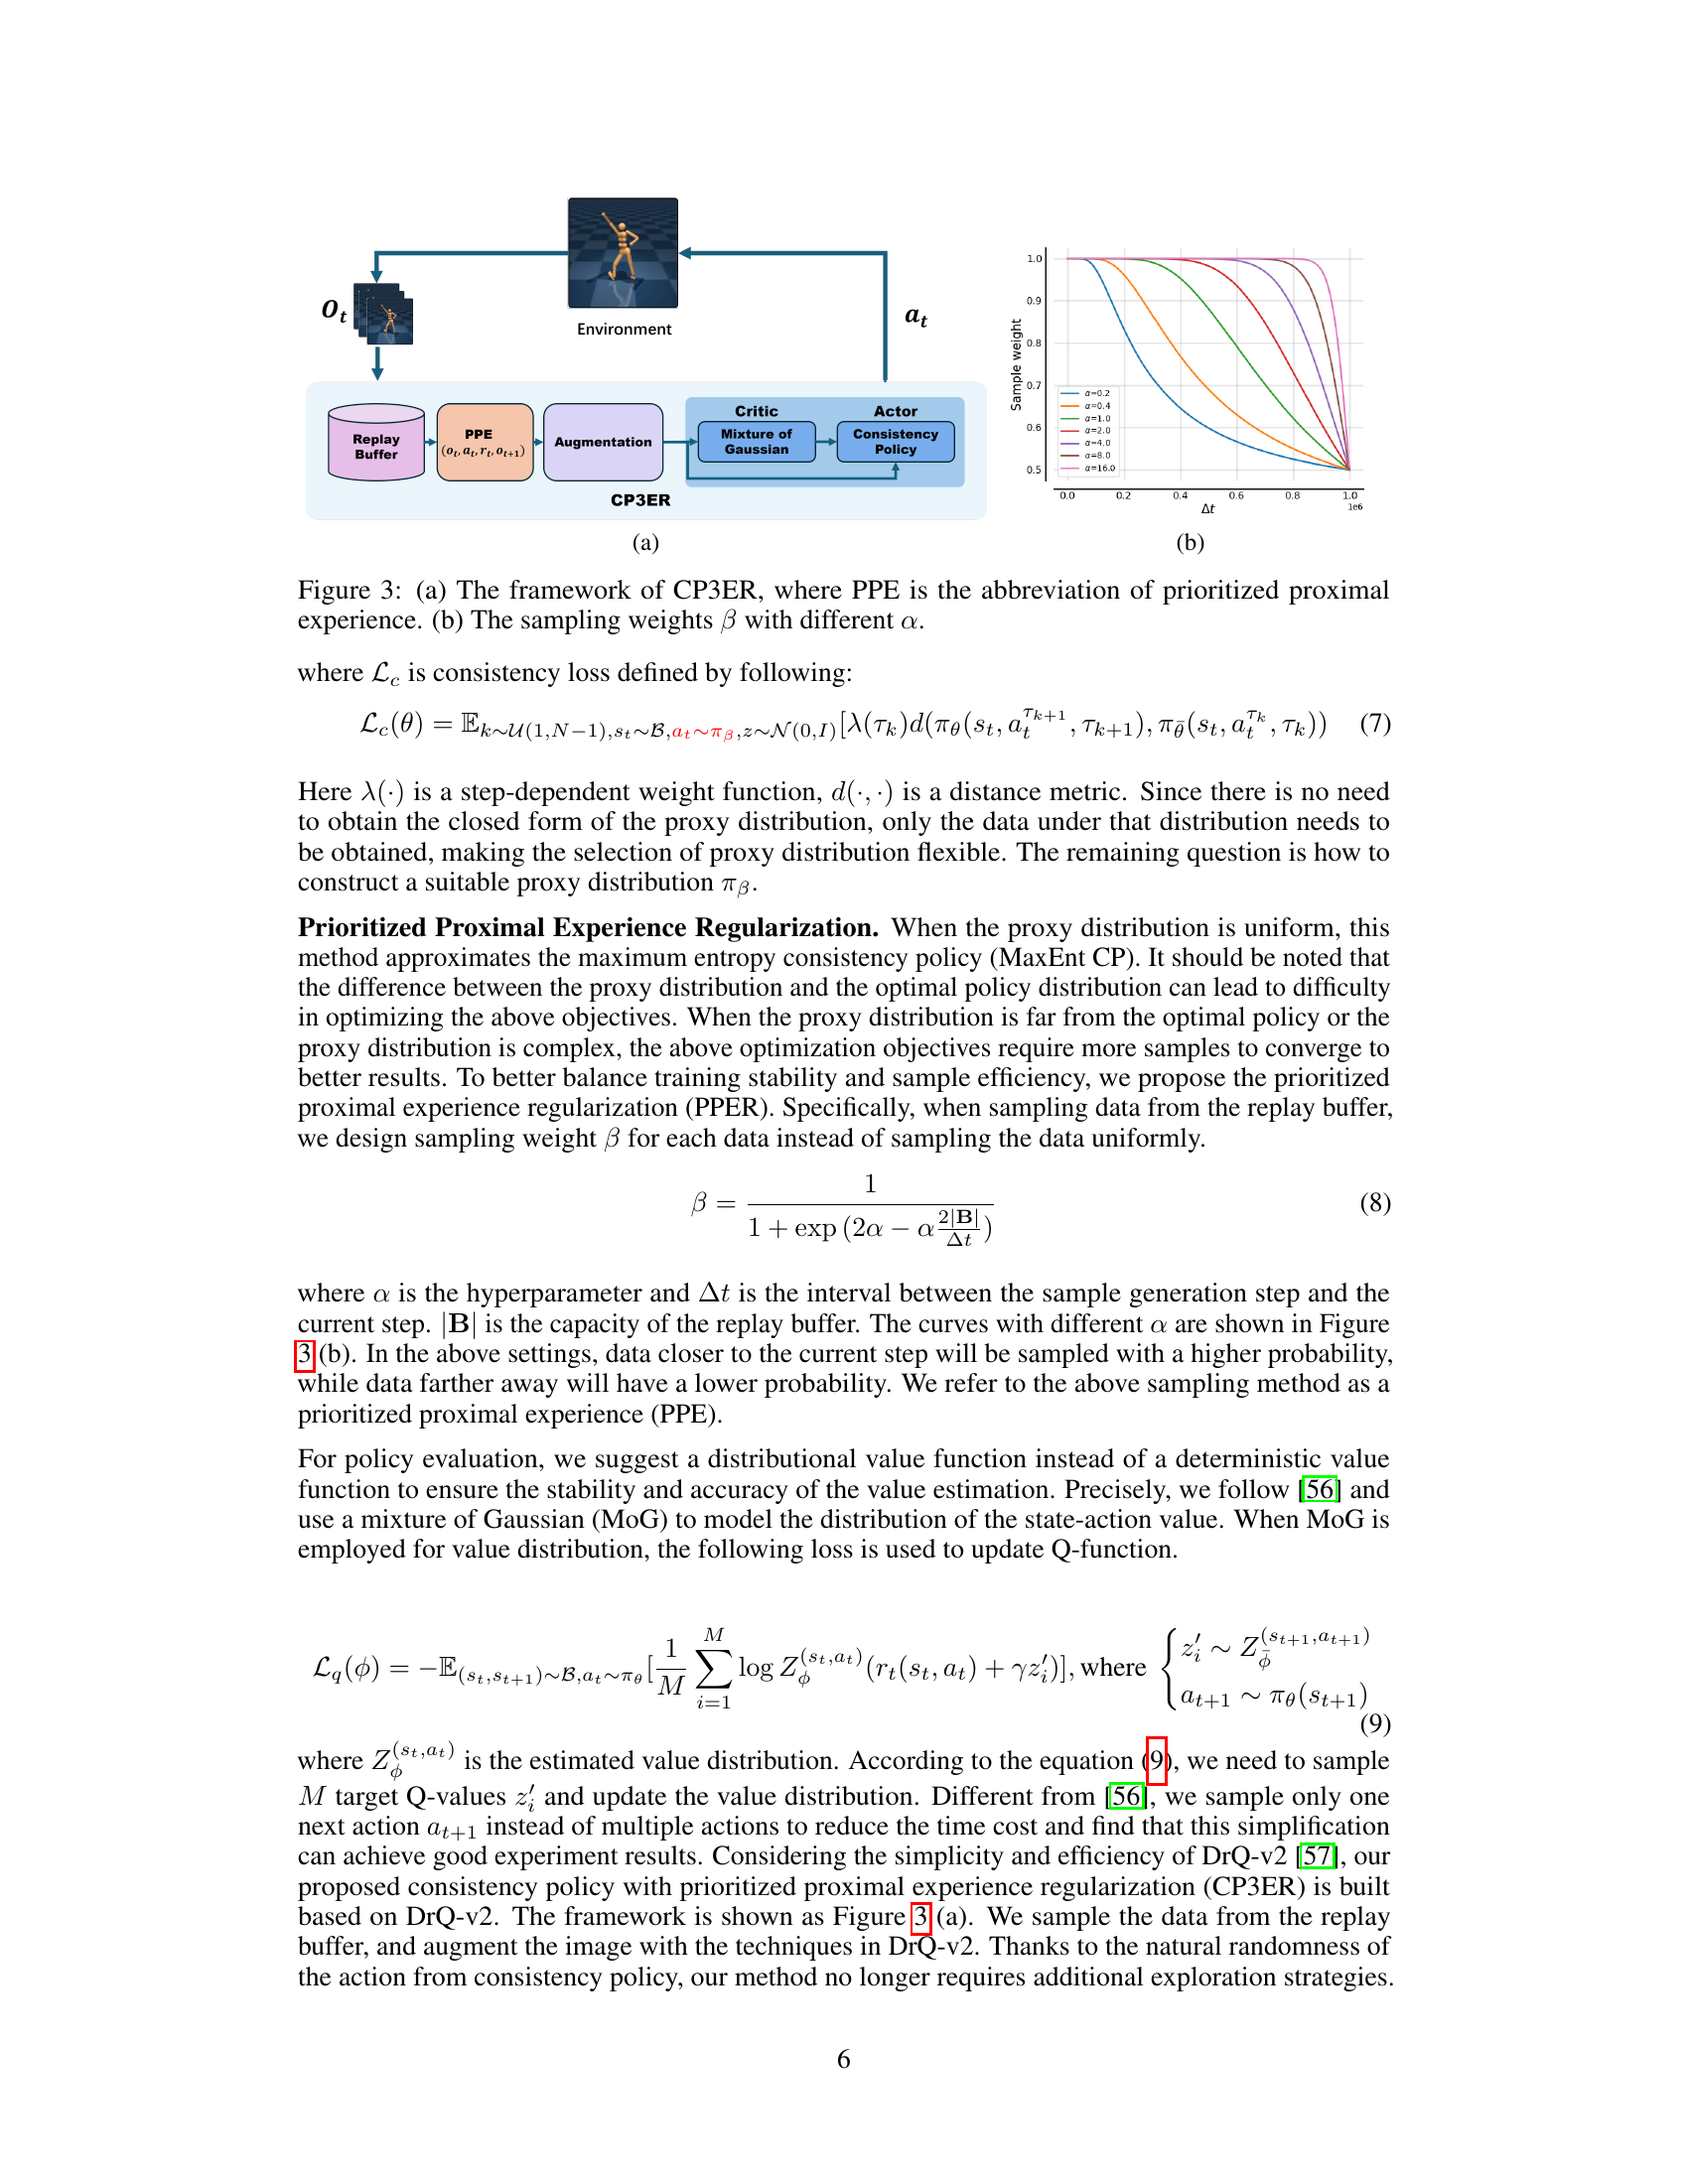
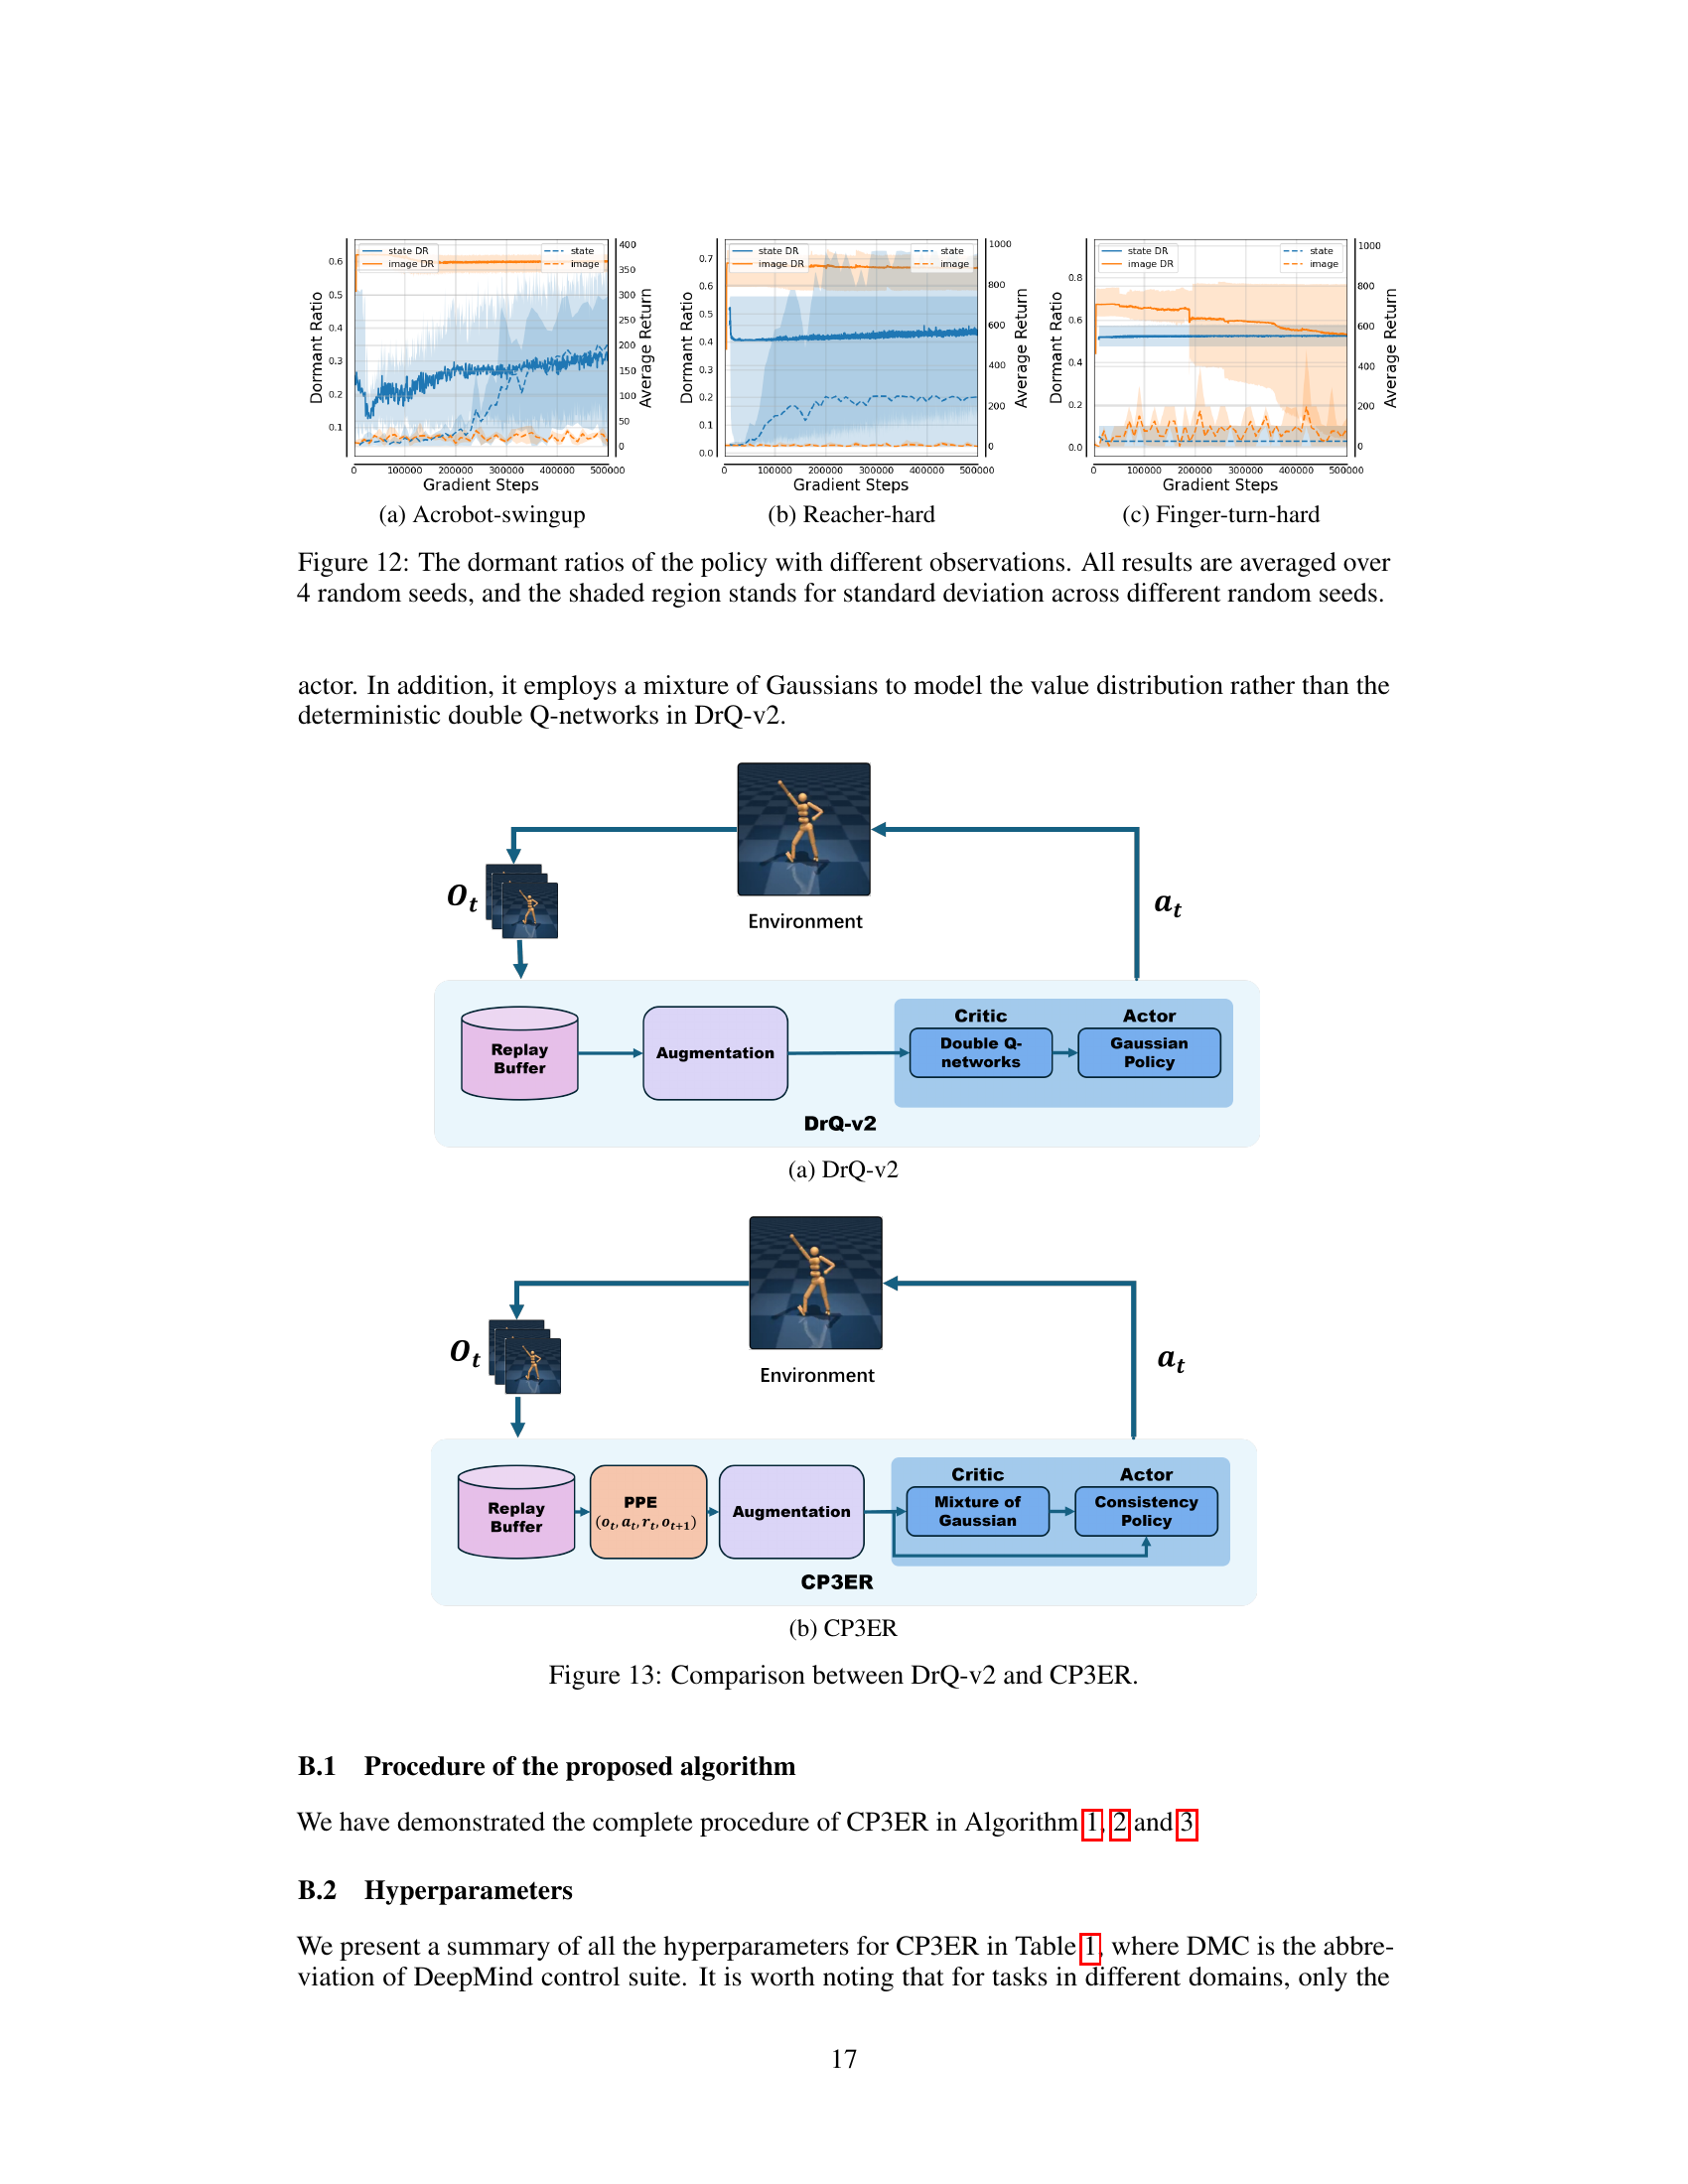
🔼 This figure shows the framework of the proposed CP3ER method, which uses prioritized proximal experience (PPE) for sample-efficient policy regularization and a consistency policy in an actor-critic framework. Panel (a) illustrates the overall architecture, highlighting the integration of PPE and consistency models into DrQ-v2 for sample-efficient training. Panel (b) shows how the sampling weights β vary with different values of α, demonstrating the effect of the hyperparameter α on the sampling strategy.
read the caption
Figure 3: (a) The framework of CP3ER, where PPE is the abbreviation of prioritized proximal experience. (b) The sampling weights β with different α.
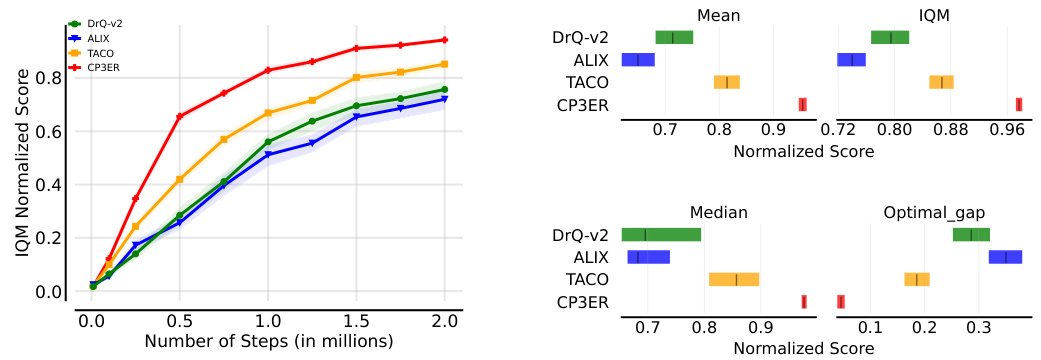
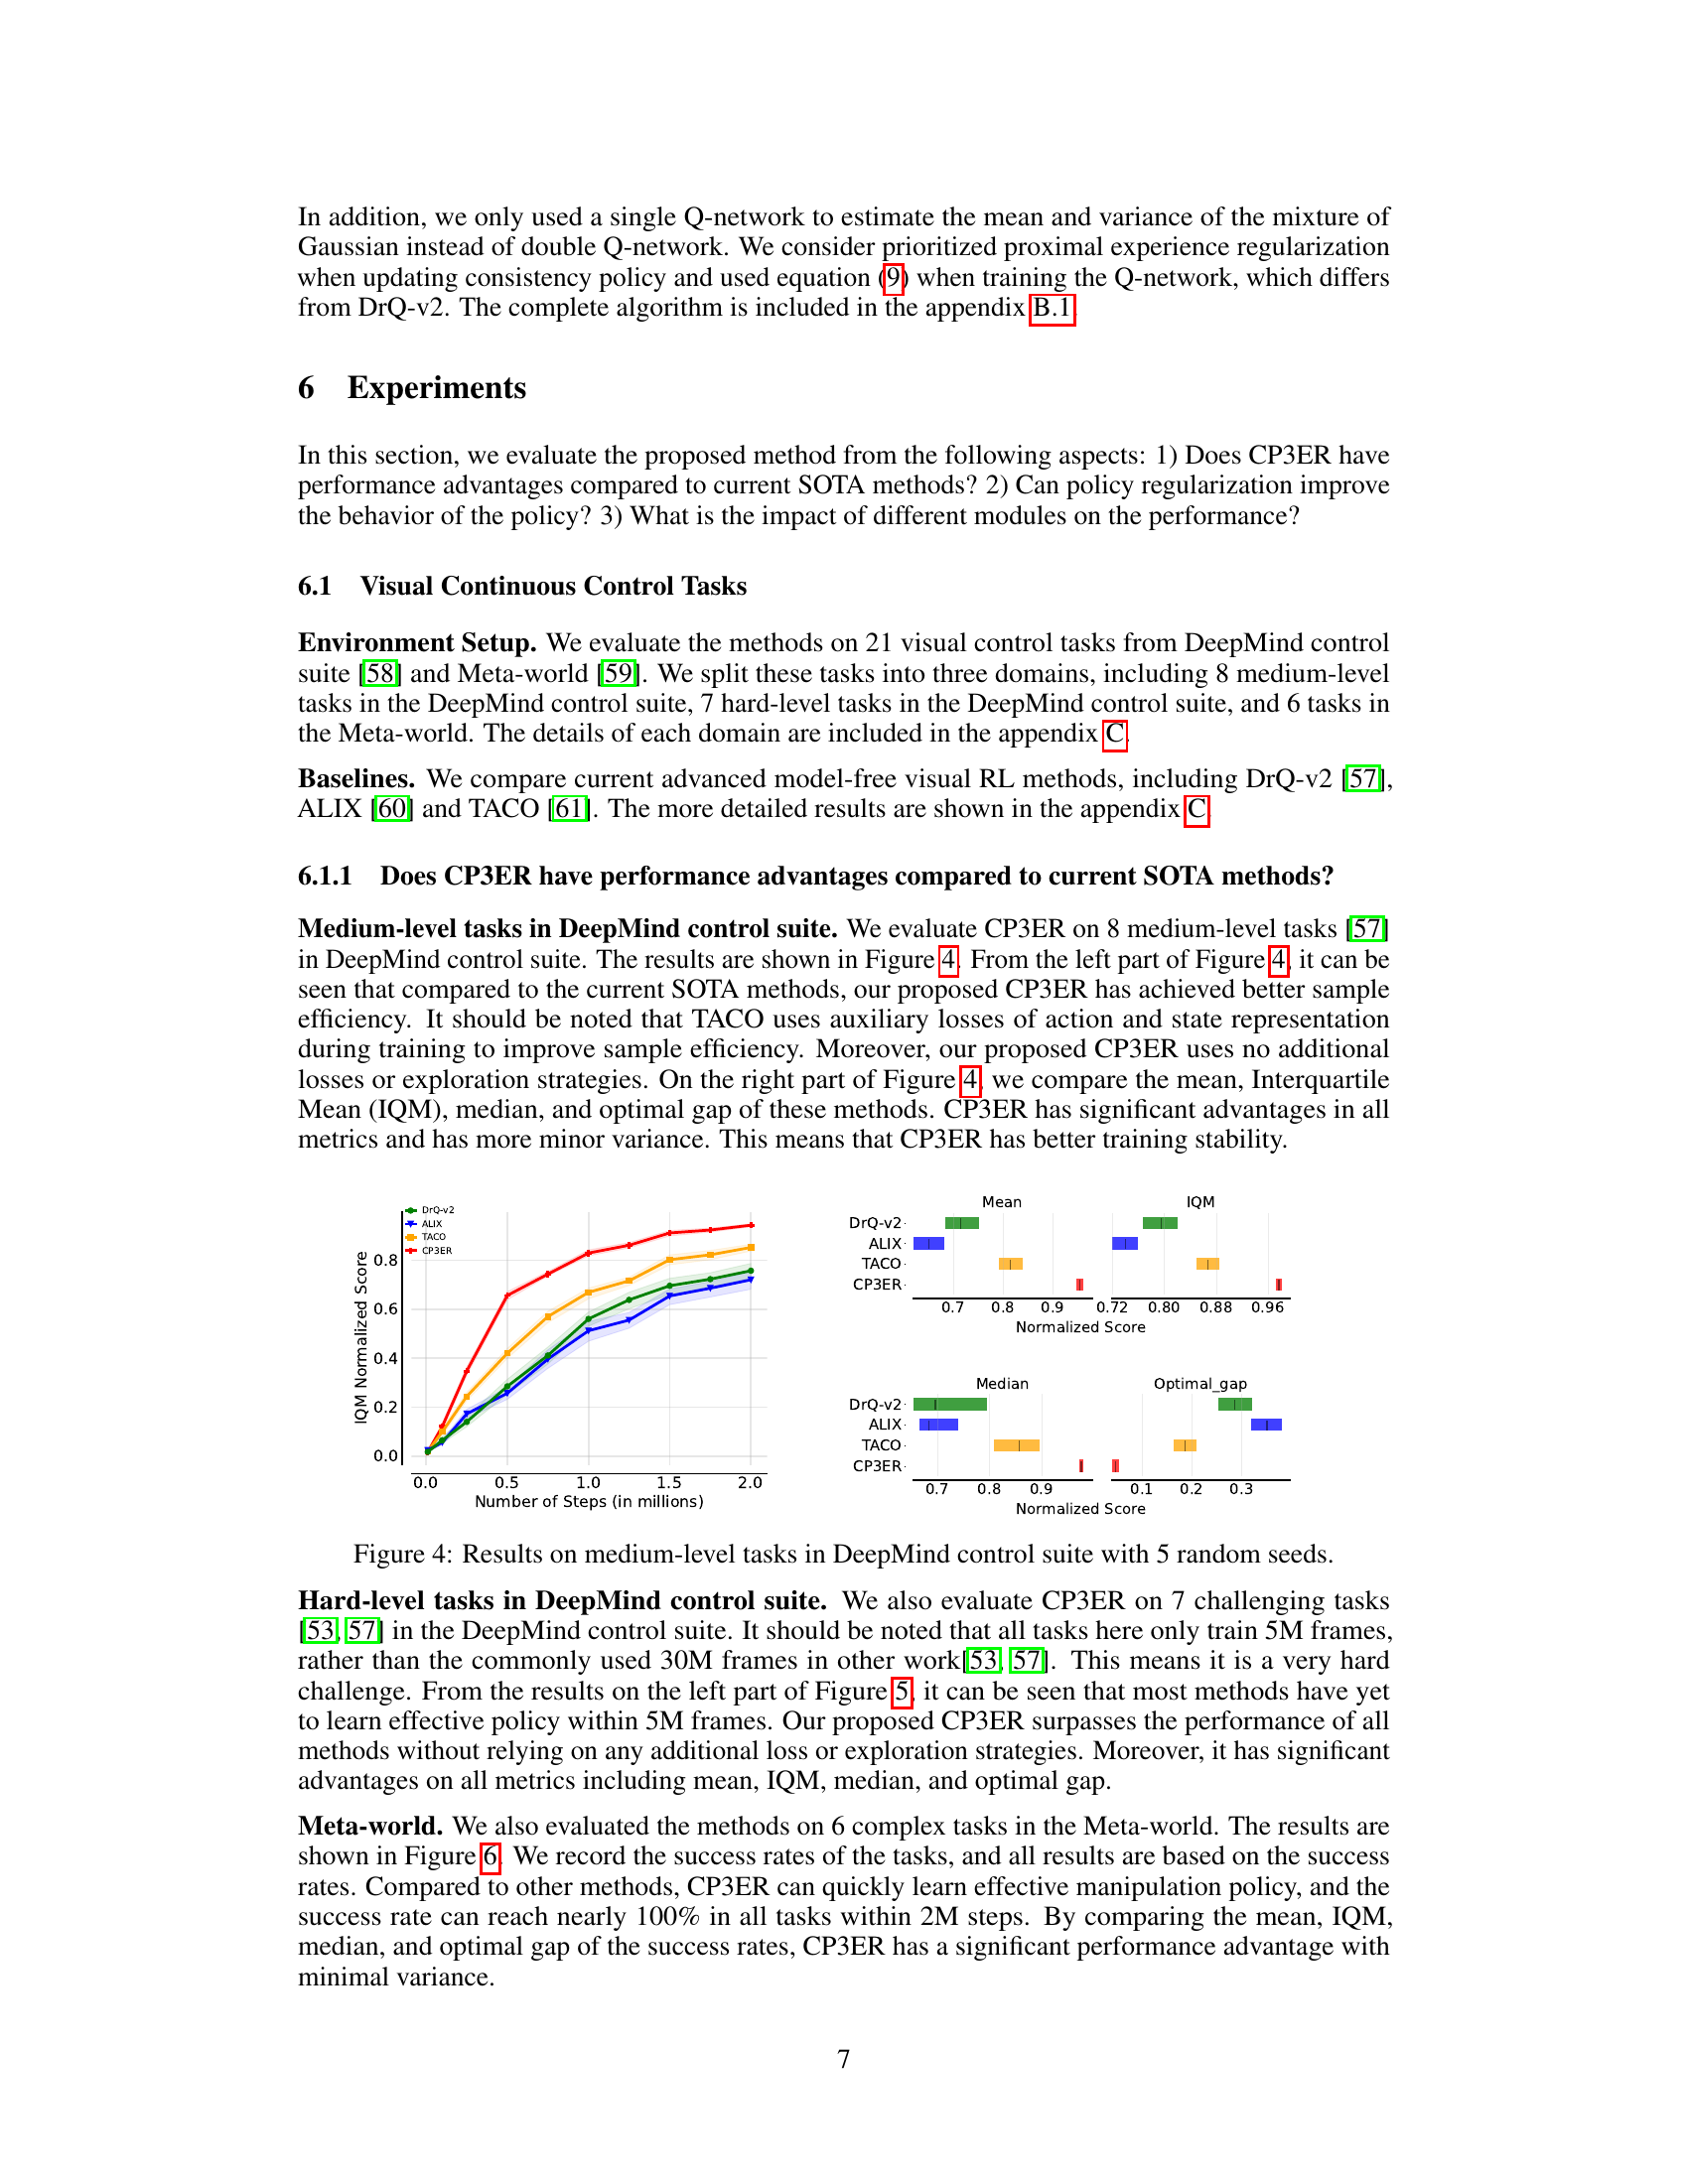
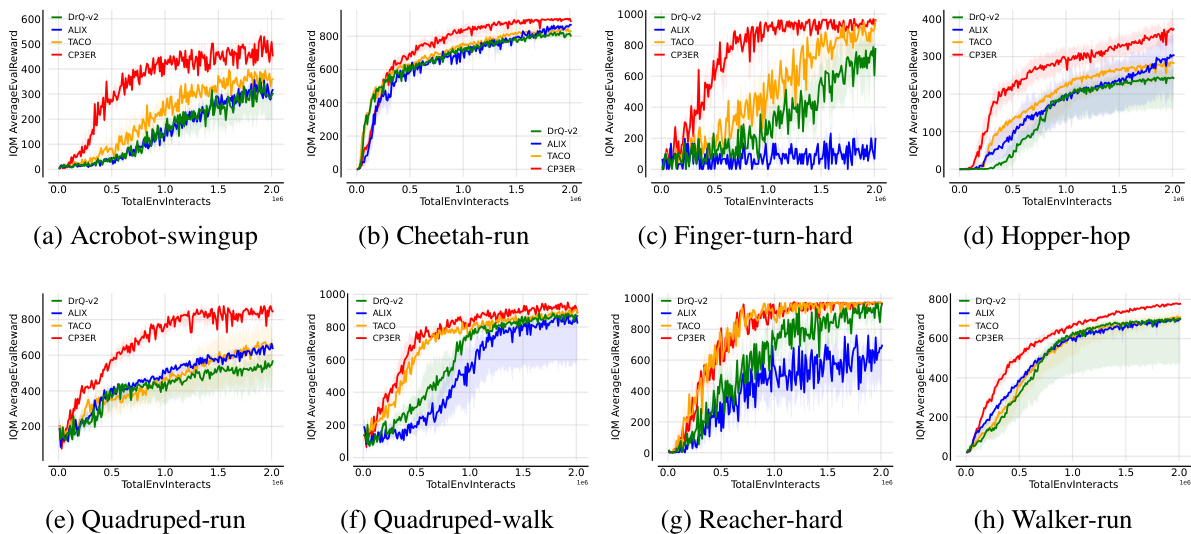
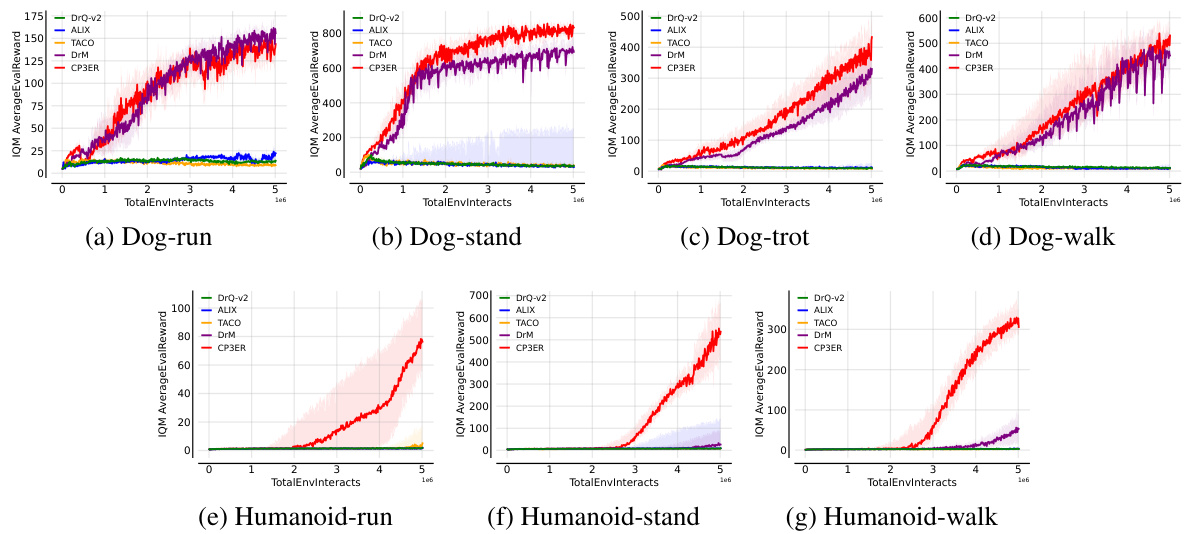
🔼 The figure shows the results of CP3ER and other baseline methods on 8 medium-level tasks in the DeepMind control suite. The left panel displays learning curves showing the IQM normalized score versus the number of training steps (in millions). Error bars represent the standard deviation across five different random seeds. The right panel provides a comparison of the mean, interquartile mean (IQM), median, and optimal gap (difference between the best performance and the mean performance) across the methods, highlighting CP3ER’s superior performance and stability.
read the caption
Figure 4: Results on medium-level tasks in DeepMind control suite with 5 random seeds.
🔼 This figure presents the results of the CP3ER method compared to other state-of-the-art methods on 8 medium-level tasks from the DeepMind control suite. The left panel shows the learning curves (IQM normalized score vs. number of steps in millions), indicating CP3ER’s superior sample efficiency. The right panel provides a detailed comparison of the mean, interquartile mean (IQM), median, and optimal gap across all methods, highlighting CP3ER’s overall superior performance and reduced variance, suggesting greater training stability.
read the caption
Figure 4: Results on medium-level tasks in DeepMind control suite with 5 random seeds.
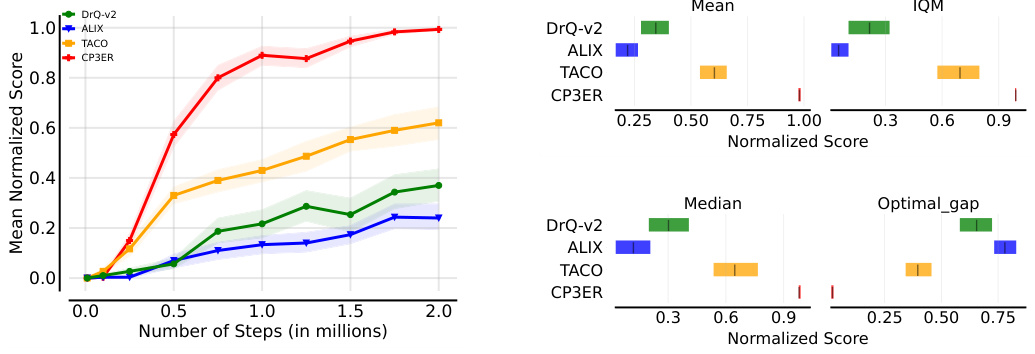
🔼 This figure displays the results of the CP3ER method compared to DrQ-v2, ALIX, and TACO on eight medium-level tasks from the DeepMind control suite. The left panel shows the learning curves, illustrating the normalized score (IQM) against the number of steps (in millions). The right panel presents a comparison of the mean, interquartile mean (IQM), median, and optimal gap for each method across the tasks, highlighting CP3ER’s superior performance and stability. The shaded regions represent standard deviations across five different random seeds.
read the caption
Figure 4: Results on medium-level tasks in DeepMind control suite with 5 random seeds.
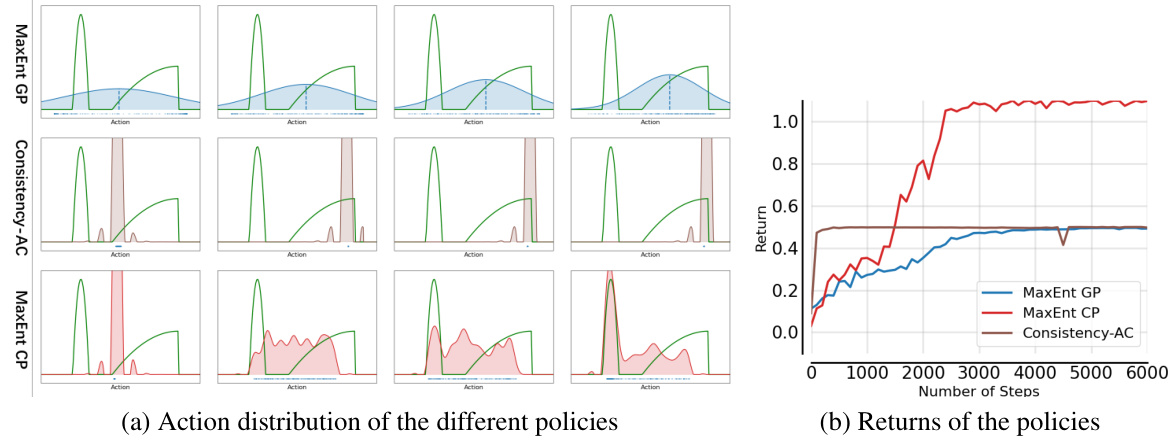
🔼 This figure shows the action distributions and returns of different policies during training on a 1D continuous bandit problem. The three policies compared are MaxEnt GP (maximum entropy Gaussian policy), Consistency-AC (consistency policy trained with the actor-critic framework and Q-loss), and MaxEnt CP (maximum entropy consistency policy). The left panel shows that MaxEnt GP maintains a relatively broad action distribution, reflecting good exploration. Consistency-AC shows a sharp peak at the optimal action, indicating quick convergence to a local optimum with limited exploration. MaxEnt CP, with policy regularization, shows a broader distribution than Consistency-AC while still centering around the optimal action, achieving a better balance between exploration and exploitation. The right panel shows that MaxEnt GP explores more widely, initially having lower returns but eventually reaching a higher level than Consistency-AC, which quickly converges to a local optimum but remains at a lower return level. MaxEnt CP performs similarly to MaxEnt GP, showing a slower rise but eventually achieving comparable performance. The figure highlights the effect of policy regularization in stabilizing and improving the performance of the consistency policy.
read the caption
Figure 7: Results on the toy example. Left part is action distributions during training, while right is returns of different policies.
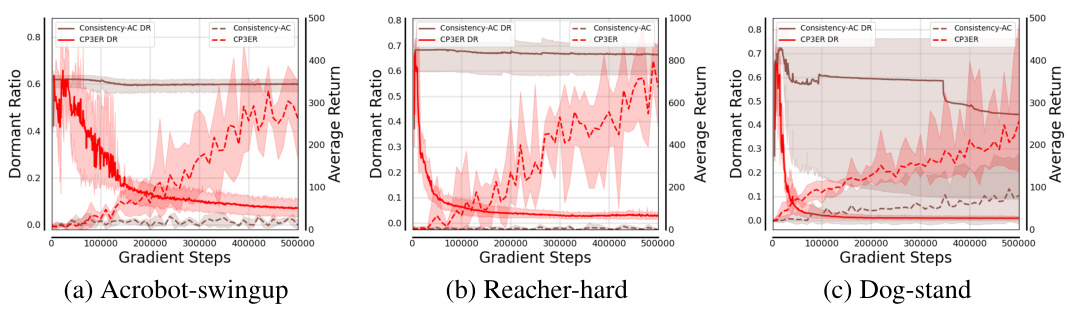
🔼 The figure compares the dormant ratios (a measure of neural network inactivity) of consistency policy trained with and without entropy regularization across three different tasks: Acrobot-swingup, Reacher-hard, and Dog-stand. Each line represents the average dormant ratio across 5 different random seeds. The shaded areas indicate standard deviations for each model. The results suggest that entropy regularization helps maintain a lower dormant ratio and therefore a more active and expressive policy network.
read the caption
Figure 8: Dormant ratios of the policy networks on different tasks with 5 random seeds.
🔼 This figure compares the dormant ratios of policy networks trained with different loss functions (consistency loss and Q-loss) and using different input types (state and image). The dormant ratio is a metric that indicates the proportion of inactive neurons in a neural network, with lower values representing more active and expressive networks. The results show that the Q-loss leads to a significant increase in the dormant ratio, particularly in visual RL with high-dimensional state space, suggesting reduced expressive ability and instability. The study highlights the impact of loss functions and input types on the performance of consistency policy in online RL.
read the caption
Figure 2: The dormant ratios of the policy networks with different losses and observations.
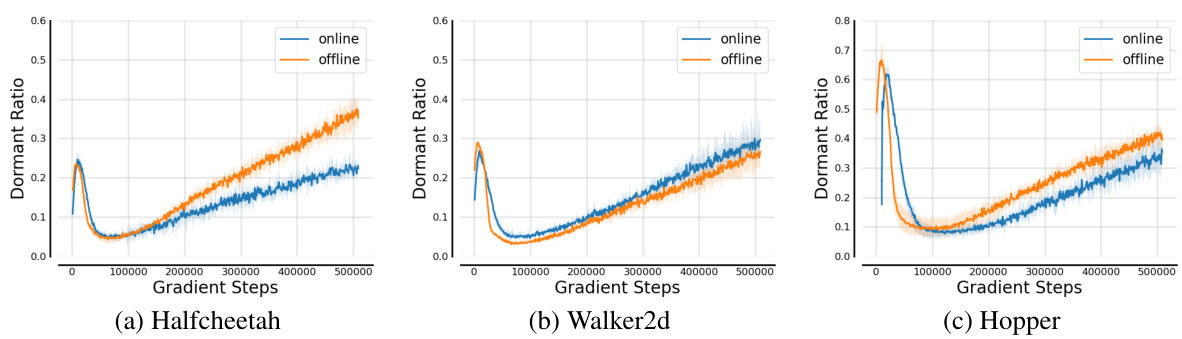
🔼 This figure displays the dormant ratios of a policy network under two training scenarios: online and offline. The online scenario reflects the non-stationary data distribution typical of reinforcement learning, while the offline scenario uses a pre-collected dataset. Four random seeds were used for each training type. The shaded region shows the standard deviation for each data point, indicating the variability of the results.
read the caption
Figure 10: The dormant ratios of the policy under the online and offline training. All results are averaged over 4 random seeds, and the shaded region stands for standard deviation across different random seeds.
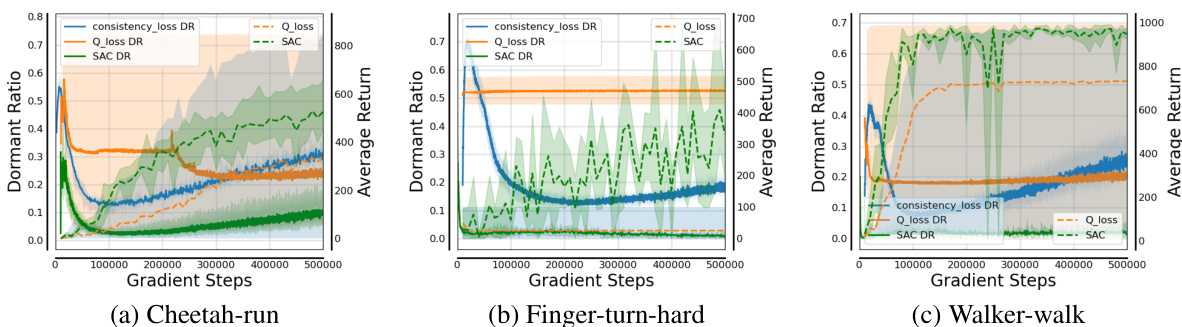
🔼 This figure shows the dormant ratios of policy networks trained with different loss functions (consistency loss and Q-loss) and using different observations (state and image). The dormant ratio is a metric to quantify the expression ability of a neural network. A higher dormant ratio indicates that fewer neurons are active, implying reduced network capacity and expressiveness. The results indicate that using Q-loss in the actor-critic framework leads to a higher dormant ratio, especially in visual RL, suggesting that Q-loss destabilizes policy training by limiting policy network’s expression ability. The non-stationary distribution in online RL does not significantly affect the consistency policy training.
read the caption
Figure 2: The dormant ratios of the policy networks with different losses and observations.
🔼 The figure shows the dormant ratios of the policy networks when training with Consistency-AC and CP3ER on three different tasks (Acrobot-swingup, Reacher-hard, and Dog-stand). The results demonstrate that CP3ER maintains lower dormant ratios than Consistency-AC, indicating improved stability and preventing the network from falling into local optima. The shaded regions represent standard deviations across five different random seeds, highlighting the robustness of CP3ER.
read the caption
Figure 8: Dormant ratios of the policy networks on different tasks with 5 random seeds.
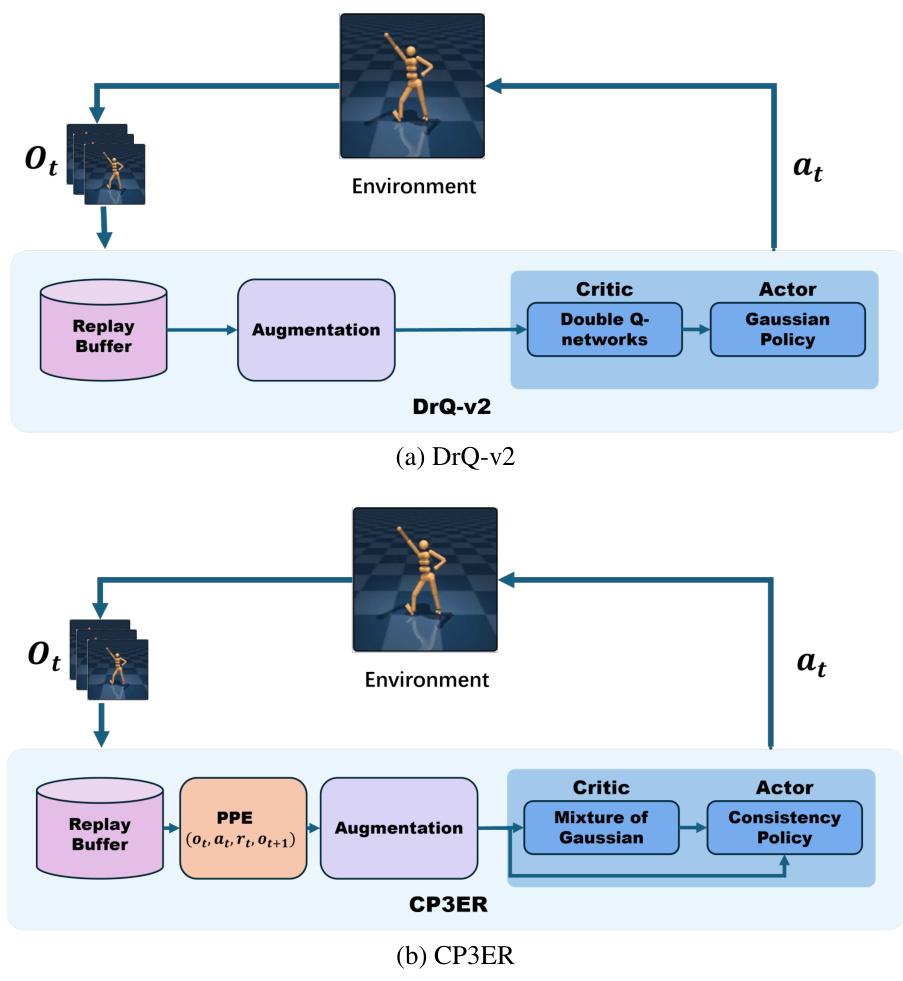
🔼 This figure illustrates the architecture of the proposed Consistency Policy with Prioritized Proximal Experience Regularization (CP3ER) method and the sampling weight function. (a) shows the overall framework, highlighting the prioritized proximal experience (PPE) sampling from the replay buffer, image augmentation, and the actor-critic network with a consistency policy and a mixture of Gaussian critic. (b) shows how the sampling weight β varies with different values of α, demonstrating the prioritized sampling strategy.
read the caption
Figure 3: (a) The framework of CP3ER, where PPE is the abbreviation of prioritized proximal experience. (b) The sampling weights β with different α.
🔼 This figure shows the dormant ratios of policy networks trained with different loss functions (consistency loss and Q-loss) and using different observations (state and image) for two online RL tasks: Halfcheetah and Walker2d. It demonstrates that the Q-loss in the actor-critic framework leads to a rapid increase in the dormant ratio, especially significant in visual RL (image-based) settings with high-dimensional state space, indicating that the Q-loss destabilizes the policy training by reducing the policy network’s expressive ability. The figure also shows that the non-stationary distribution of online RL data does not significantly affect consistency model training.
read the caption
Figure 2: The dormant ratios of the policy networks with different losses and observations.
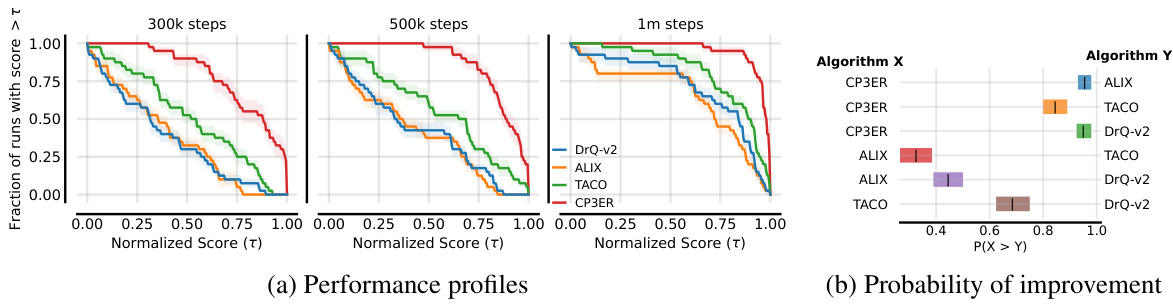
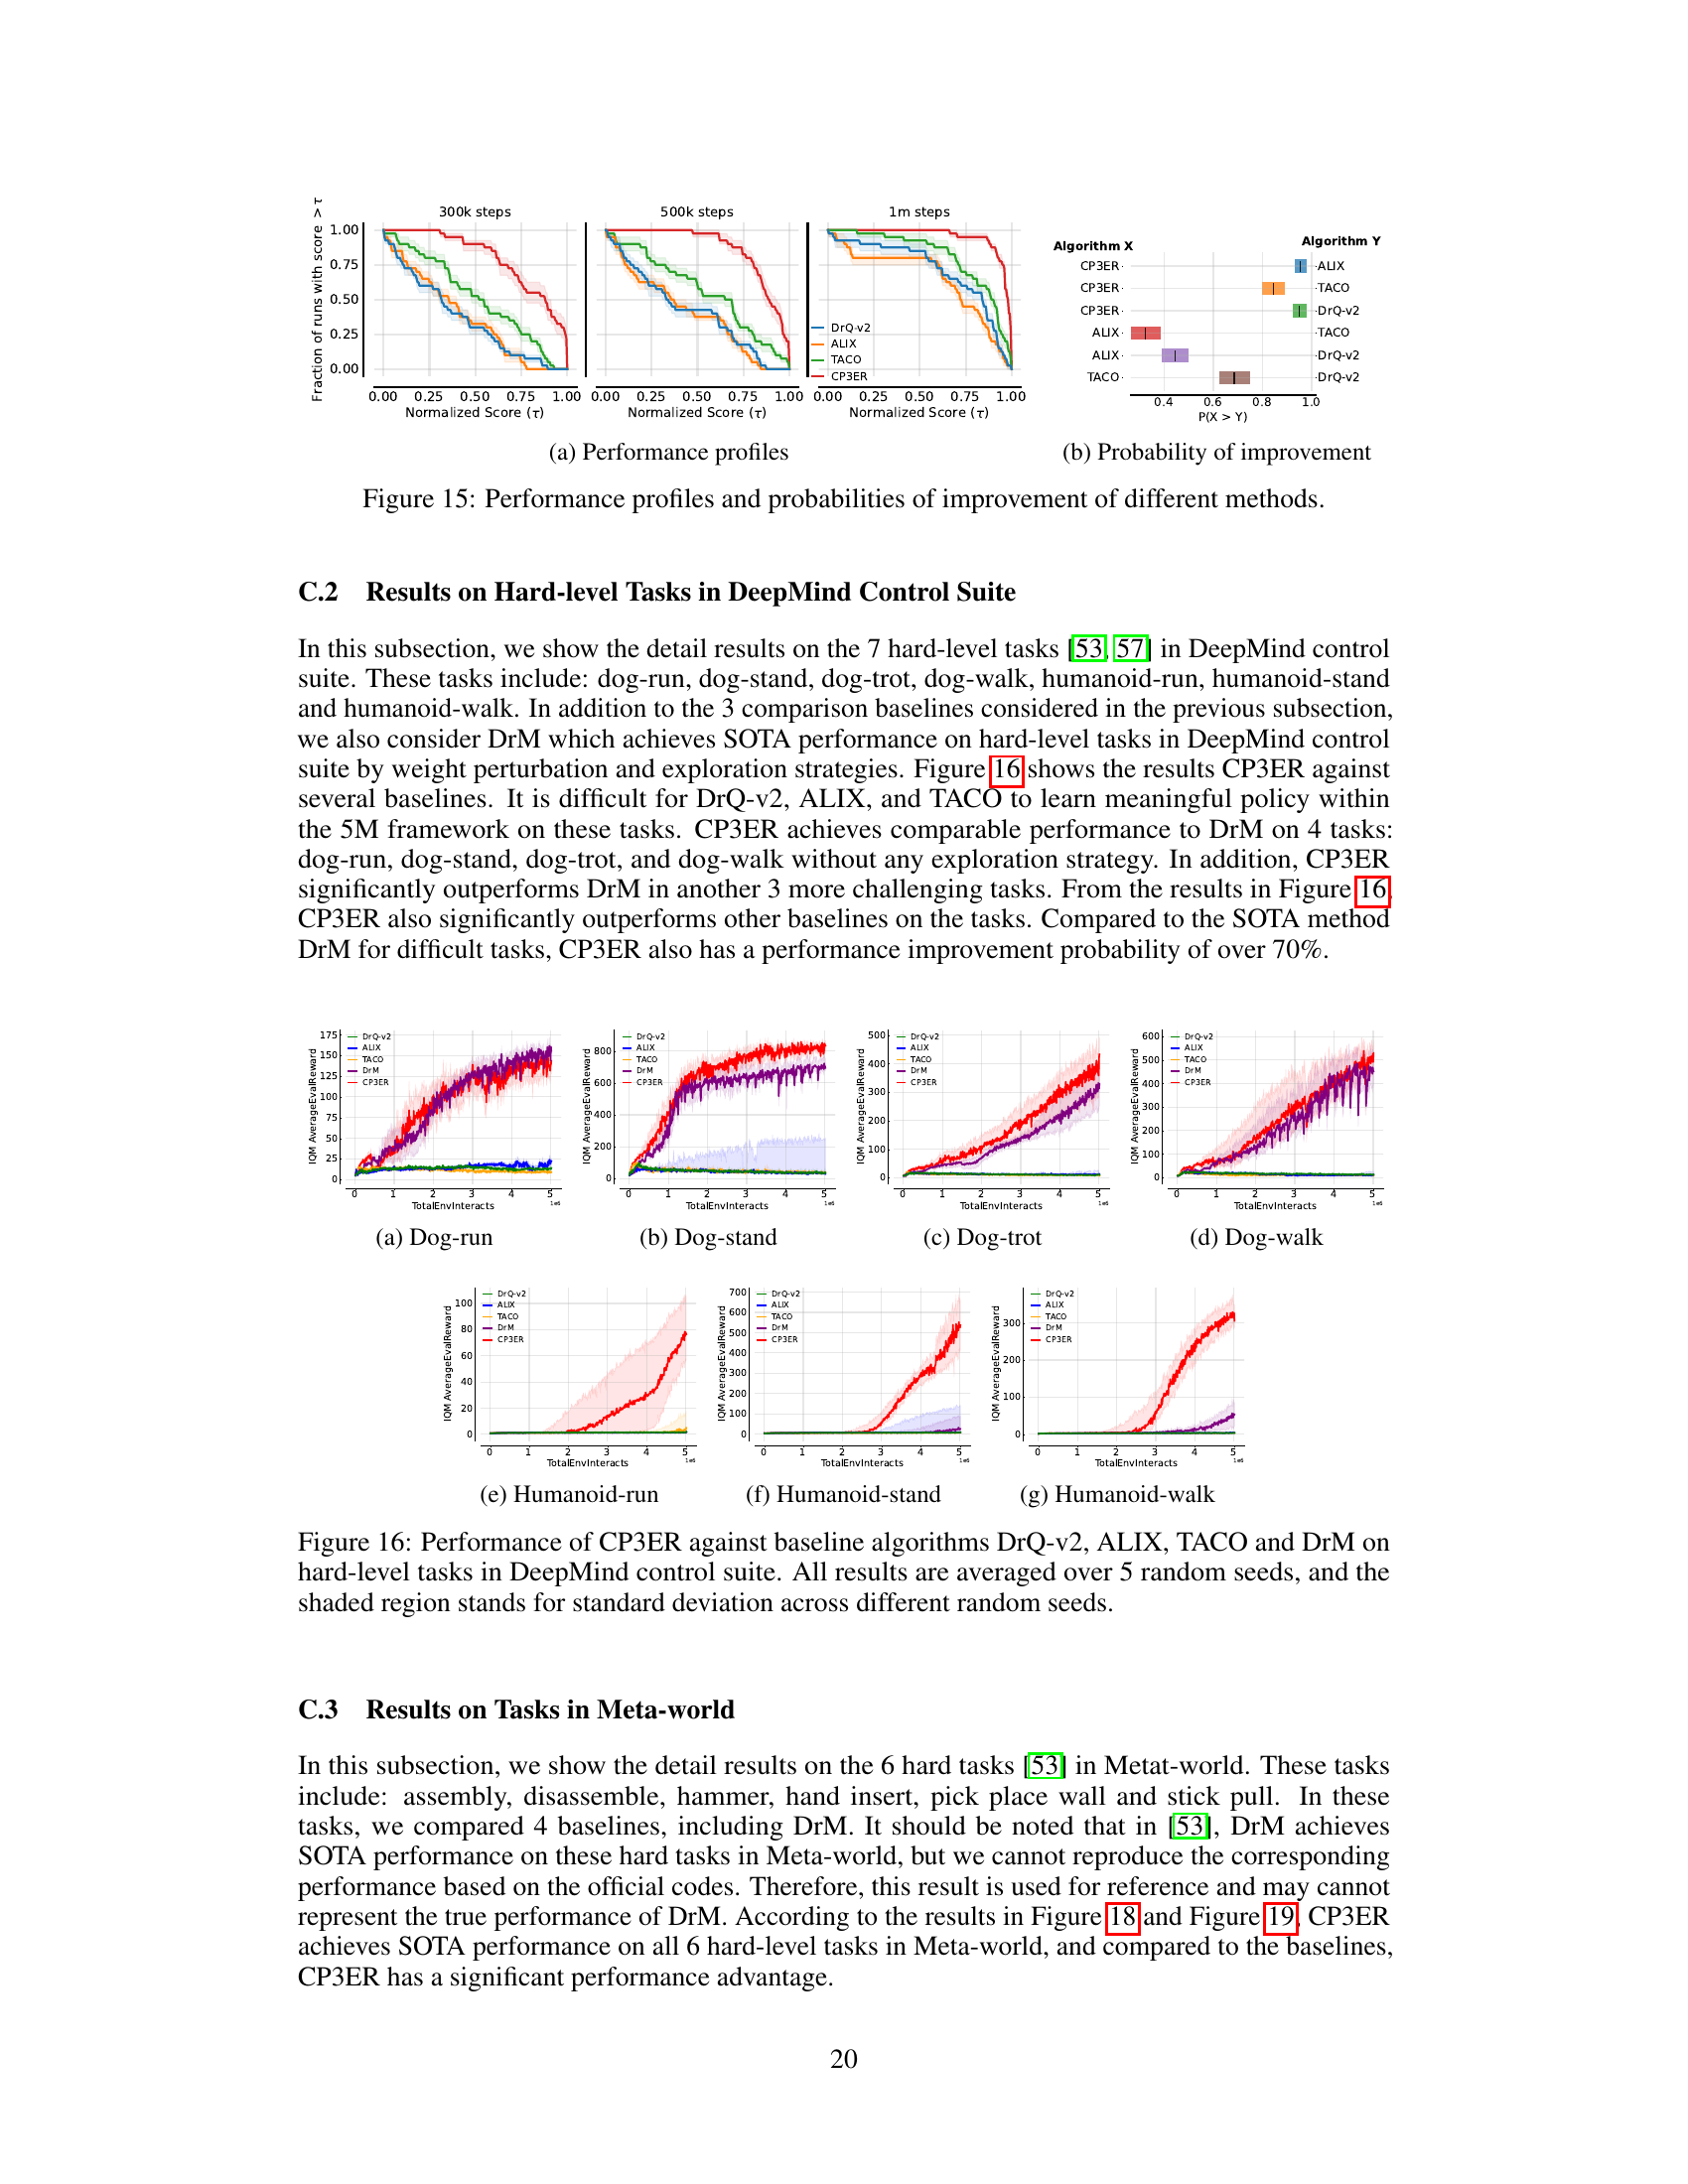
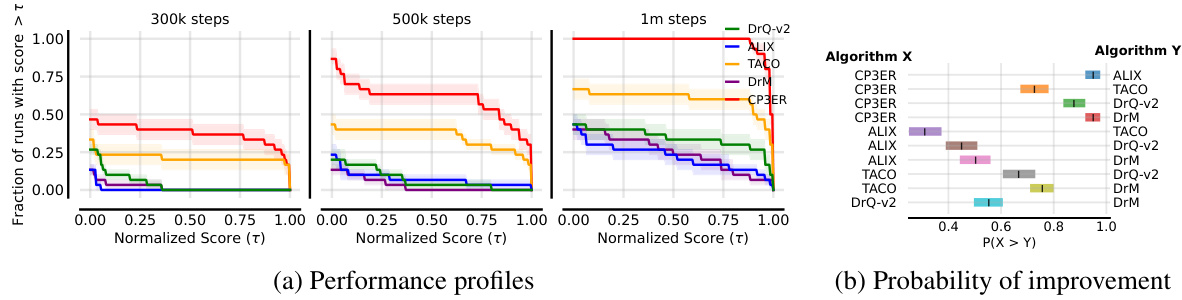
🔼 This figure shows the performance profiles and probabilities of improvement for different methods on the medium-level tasks. The performance profiles plot the fraction of runs with a score greater than a certain threshold (τ) across different time steps. The probability of improvement calculates the probability that a method performs better than another method. CP3ER shows better performance compared to other baselines in both measures.
read the caption
Figure 15: Performance profiles and probabilities of improvement of different methods.
🔼 The figure shows the dormant ratios of policy networks trained with different loss functions (consistency loss and Q-loss) and using different observations (state and image) in online RL tasks. The dormant ratio is a measure of the proportion of inactive neurons in a neural network, indicating its expressive ability. The results illustrate that the Q-loss in the actor-critic framework leads to a sharp increase in the dormant ratio, significantly impairing the policy’s ability to learn complex behaviors, especially in visual RL with high-dimensional state spaces. In contrast, the consistency loss shows a more stable dormant ratio, indicating better training stability.
read the caption
Figure 2: The dormant ratios of the policy networks with different losses and observations.
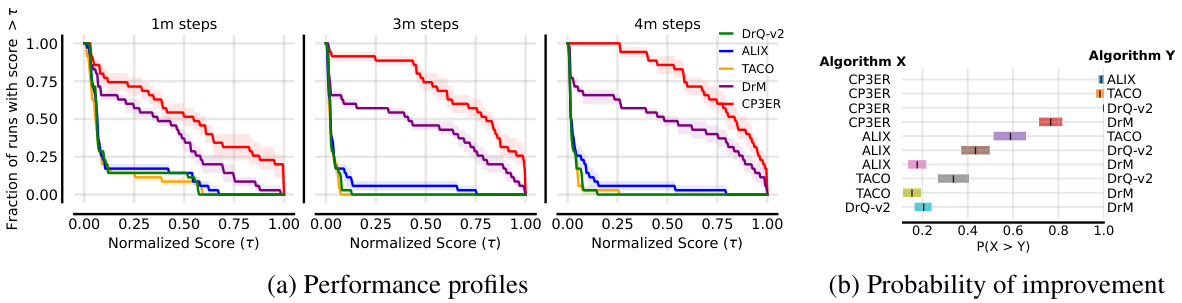
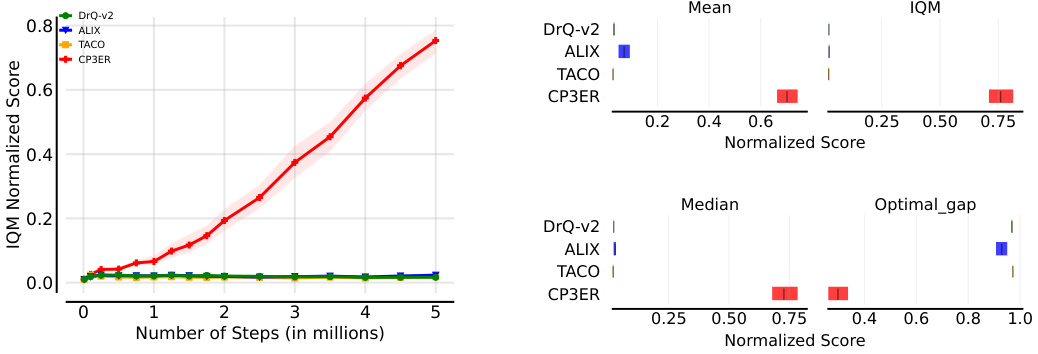
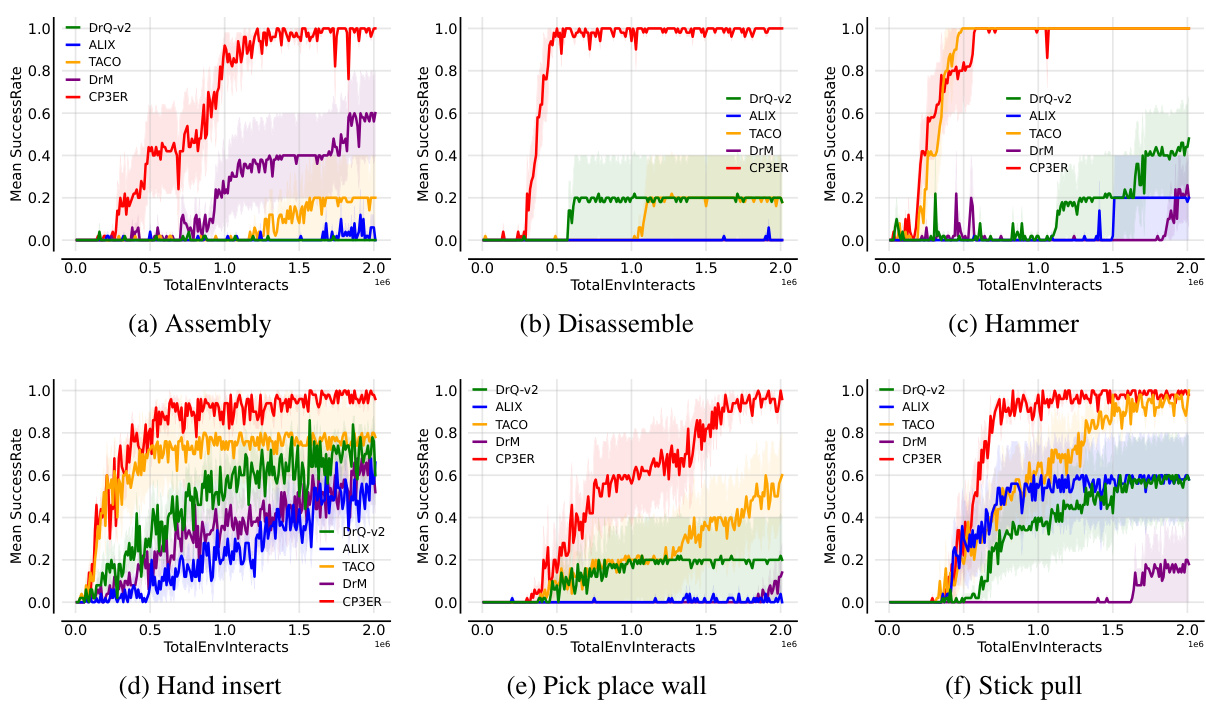
🔼 This figure compares the performance of CP3ER against four baseline algorithms (DrQ-v2, ALIX, TACO, and DrM) across different checkpoints. The left side shows performance profiles, illustrating the cumulative fraction of runs achieving a certain normalized success rate. The right side shows the probability of improvement, indicating the likelihood of CP3ER outperforming each baseline algorithm.
read the caption
Figure 17: Performance profiles and probabilities of improvement of different methods.
🔼 The figure shows the dormant ratios of policy networks trained with different loss functions (consistency loss and Q-loss) and using different observations (state and image) in online RL. The results demonstrate the instability of the policy training in visual RL using Q-loss due to the high-dimensional state space and actor-critic framework, which leads to a sharp increase in the dormant ratio and a loss of complex expression ability. The plots show the dormant ratios across gradient steps for different tasks, highlighting the impact of the Q-loss on the consistency policy training in visual RL.
read the caption
Figure 2: The dormant ratios of the policy networks with different losses and observations.
🔼 The figure shows the performance profiles and probabilities of improvement for different reinforcement learning methods on a set of tasks. The performance profiles show the fraction of runs that achieved a normalized score greater than a given threshold, while the probabilities of improvement show the probability that one method outperformed another. The results indicate that the CP3ER method shows superior performance compared to other methods across different thresholds and tasks.
read the caption
Figure 15: Performance profiles and probabilities of improvement of different methods.
More on tables
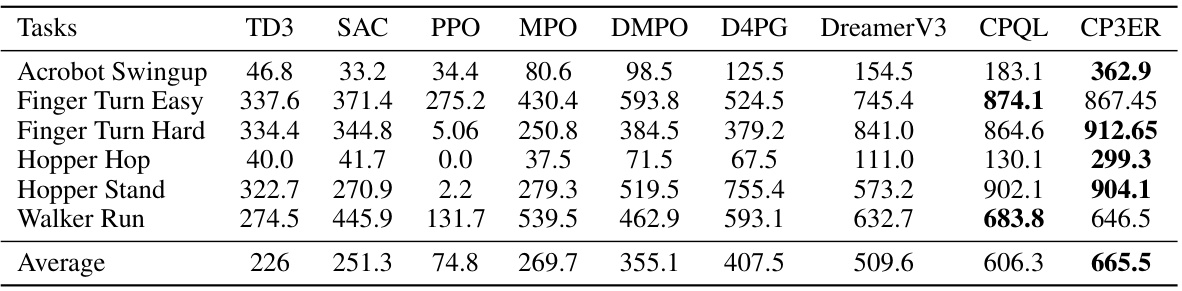
🔼 This table compares the performance of CP3ER against other state-of-the-art methods (TD3, SAC, PPO, MPO, DMPO, D4PG, DreamerV3, CPQL) on six state-based reinforcement learning tasks from the DeepMind control suite. The metrics used for comparison are the average scores achieved on each task. It demonstrates the relative performance of CP3ER compared to existing methods.
read the caption
Table 2: Comparison of CP3ER and other methods on state-based RL tasks in DeepMind control suite.
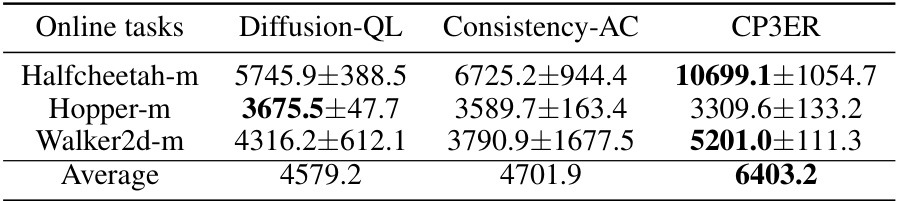
🔼 This table compares the performance of CP3ER against two other methods, Diffusion-QL and Consistency-AC, on three online reinforcement learning tasks: Halfcheetah-m, Hopper-m, and Walker2d-m. The results are presented as average scores ± standard deviation. CP3ER demonstrates significantly higher average scores on all three tasks compared to the other methods, indicating its superior performance in online reinforcement learning.
read the caption
Table 3: Comparison of CP3ER with diffusion/consistency based RL methods.
Full paper#