↗ OpenReview ↗ NeurIPS Homepage ↗ Chat
TL;DR#
Current Latent Consistency Models (LCMs) suffer from inconsistencies in multi-step sampling, limited control over generation parameters like CFG, and poor performance in few-step generation. These limitations hinder the efficient and high-quality generation of images and videos.
The proposed Phased Consistency Models (PCMs) overcome these issues by dividing the generation process into multiple phases. This method enables deterministic multi-step sampling, improves controllability via optional CFG removal, and enhances efficiency through adversarial training. PCMs show improved performance over LCMs in various image generation scenarios, achieving comparable 1-step generation results to state-of-the-art methods and reaching the state-of-the-art in few-step video generation.
Key Takeaways#
Why does it matter?#
This paper is important because it addresses limitations in existing latent consistency models (LCMs) for image and video generation. By proposing Phased Consistency Models (PCMs), it offers a more efficient and versatile approach, achieving state-of-the-art results in both image and video generation. This opens new avenues for research in multi-step diffusion model improvements and has significant practical implications.
Visual Insights#

This figure shows several examples of image and video generation results using Phased Consistency Models (PCMs). The left side shows text-to-image generation results with different numbers of steps (1, 2, 4, 8, 16 steps). The right side shows text-to-video generation results with 2 steps. Each image and video shows a different prompt and demonstrates the model’s ability to generate high-quality and diverse samples, even in a small number of steps.

This table presents a comparison of the Fréchet Inception Distance (FID) scores, calculated using both Stable Diffusion v1-5 features (FID-SD) and CLIP features (FID-CLIP), for various image generation methods. The methods compared are InstaFlow, SD-Turbo, LCM, CTM, and the proposed PCM method. Performance is evaluated across different numbers of inference steps (1, 2, 4, 8, 16) for both the COCO-30K and CC12M-30K datasets. The table allows for a quantitative assessment of the image quality and generation efficiency of different models under various settings.
In-depth insights#
Phased Consistency#
The concept of “Phased Consistency” introduces a novel approach to enhance the efficiency and stability of diffusion models, particularly addressing limitations in existing consistency models. It suggests dividing the iterative refinement process into distinct phases or sub-trajectories, enforcing self-consistency within each phase rather than across the entire trajectory. This strategy mitigates the accumulation of stochastic errors inherent in multi-step sampling, leading to more stable and consistent generation results across different numbers of inference steps. Furthermore, the modular design allows for flexible adaptation to various tasks, potentially including video generation, and offers enhanced controllability through techniques like classifier-free guidance. The phased approach presents a significant improvement over previous methods, demonstrating superior performance in both image and video synthesis while maintaining or surpassing the quality of single-step generation techniques.
Multi-step Refinement#
Multi-step refinement in image generation models, as discussed in the context of diffusion models, focuses on iteratively improving the quality of generated images. Initial generation stages often produce low-resolution or noisy results, necessitating refinement steps. Each step refines the image, incorporating additional details and reducing noise, using various methods that might include adjusting parameters like the classifier-free guidance (CFG) scale or introducing additional loss functions. This iterative approach contrasts with one-step methods, which aim to produce a high-quality image directly. The effectiveness of multi-step refinement depends significantly on the model architecture, the specific refinement techniques used, and the computational cost associated with multiple iterations. Phased Consistency Models (PCMs), for instance, are specifically designed for multi-step refinement and offer a way to manage the trade-off between efficiency and image quality by phasing the refinement process. A key challenge lies in balancing the computational burden of multiple refinement steps against the achieved improvement in image quality. Understanding the convergence properties and error accumulation in each refinement step is crucial for designing efficient and effective multi-step refinement strategies.
Adversarial Loss#
The incorporation of an adversarial loss function is a crucial aspect of the research, significantly enhancing the model’s performance. The primary goal is to improve distribution consistency, especially in low-step generation settings. By introducing an adversarial game between the generator and a discriminator, the model is pushed to generate samples that better match the true data distribution. This technique is particularly useful for overcoming the limitations of the self-consistency property that underpins consistency models; that property can lead to suboptimal results in scenarios with limited steps. The adversarial loss acts as a regularizer, fine-tuning the output distribution and leading to improved sample quality. The choice of discriminator architecture (latent vs. pixel-based) is a significant design decision discussed in the paper and has implications for both computational cost and performance quality. The implementation of the adversarial loss involves careful consideration of both hyperparameters and training strategies to ensure stability and avoid any detrimental effects on the primary training objective.
Controllability Limits#
Controllability in AI models, especially generative ones, refers to the degree to which their outputs can be precisely steered towards a desired outcome. Controllability limits arise when the model’s behavior becomes unpredictable or resistant to user guidance. This can stem from several factors. The model architecture itself might lack sufficient capacity to accurately translate complex instructions into fine-grained control over generation. Inadequate training data can limit the model’s ability to learn the nuances needed for precise control, leading to unexpected outputs even with detailed prompts. Additionally, inherent stochasticity in the generative process can introduce variability, making it difficult to guarantee consistent results across multiple generations, even with identical inputs. Finally, the presence of confounding factors such as poorly chosen hyperparameters, noisy data, or limitations in the input representation can further restrict controllability and create unpredictable behaviors. Addressing controllability limits requires careful attention to model design, training procedures, and the management of inherent stochasticity.
Future Directions#
Future research could explore more sophisticated phased strategies, moving beyond the current linear approach to allow for adaptive phase adjustments based on the complexity of the input or the generation progress. This might involve incorporating a learned phase allocation mechanism or exploring hierarchical phasing. Another avenue is to investigate novel loss functions that better capture the subtleties of distribution consistency. The current adversarial loss, while effective, could be further improved by incorporating perceptual metrics or leveraging advanced generative models. Further research could also focus on extending PCMs to other generative models, such as GANs or VAEs, to broaden its applicability and explore the potential synergistic benefits of combining different generative paradigms. Finally, a thorough investigation into the trade-off between efficiency and sample quality across different numbers of phases is crucial for optimizing PCMs for various applications.
More visual insights#
More on figures

This figure shows three key limitations of Latent Consistency Models (LCMs) and how the proposed Phased Consistency Models (PCMs) address them. The limitations highlighted are inconsistencies in results across different inference steps (blurriness at low and high steps), limited controllability (CFG values restricted, insensitivity to negative prompts), and inefficiency (poor performance at few-step generation). Each limitation is demonstrated with examples comparing LCM and PCM results.

This figure provides a visual comparison of four different types of diffusion models: standard diffusion models, consistency models, consistency trajectory models, and phased consistency models (PCMs). The left panel shows how each model approaches the task of fitting the data distribution. The right panel shows a simplified illustration of the forward stochastic differential equation (SDE) and the reverse-time probability flow ordinary differential equation (PF-ODE) trajectories. The figure highlights the key differences between the models and shows how PCMs address some of the limitations of previous models.

This figure illustrates the training process of Phased Consistency Models (PCMs). It shows how the model is trained by combining multiple ODE sub-trajectories and how the self-consistency property is enforced on each sub-trajectory. The figure also shows the optional use of classifier-free guidance (CFG) during training. The figure includes an encoder, an ODE solver, a discriminator, and an EMA update module. It also shows how the ODE trajectory is split into multiple sub-trajectories.

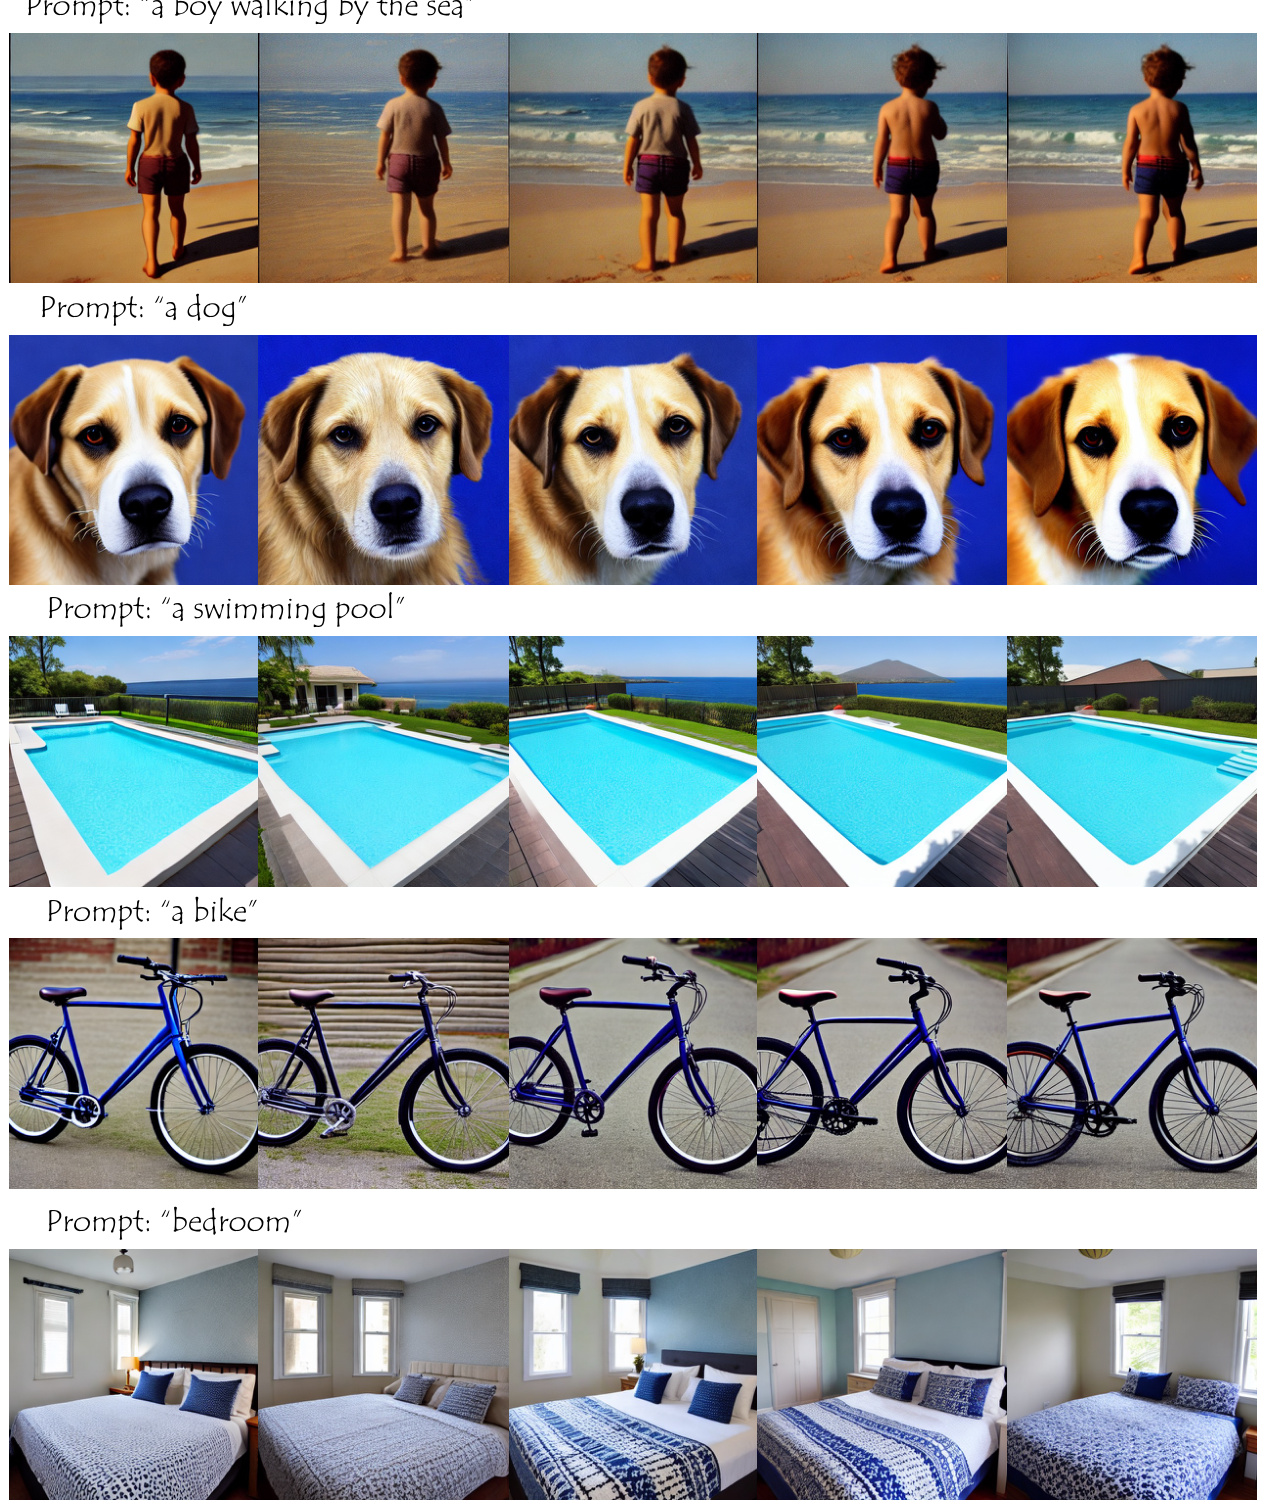
This figure shows image and video generation results using Phased Consistency Models (PCMs) with different numbers of steps (1, 2, 4, 8, 16). It demonstrates the ability of PCMs to generate high-quality images and videos with fewer steps than traditional methods. The left side shows text-to-image generation, and the right side shows text-to-video generation. The results highlight the model’s stability and speed across various inference steps.

This figure demonstrates the effectiveness of Phased Consistency Models (PCMs) in generating high-quality images and videos. It shows examples of images and videos generated using PCMs with different numbers of steps (1-step, 2-step, 4-step, 8-step, 16-step). The results highlight PCM’s ability to produce stable and fast generation across various step settings, outperforming existing methods in both image and video generation.

This figure demonstrates the phased consistency model’s (PCM) ability to generate stable and high-quality images and videos across various numbers of steps (1, 2, 4, 8, 16). It visually compares the results of PCM with those of other methods across different inference step settings, showcasing its superior performance in image and video generation. The left panel demonstrates text-to-image generation and the right shows text-to-video generation.

This figure shows examples of image and video generation results using Phased Consistency Models (PCMs). The left side demonstrates text-to-image generation, showcasing the consistency of results across different numbers of sampling steps (1-step, 2-step, 4-step, 8-step, 16-step). The right side shows text-to-video generation, highlighting PCM’s ability to produce stable and high-quality videos with fewer steps.
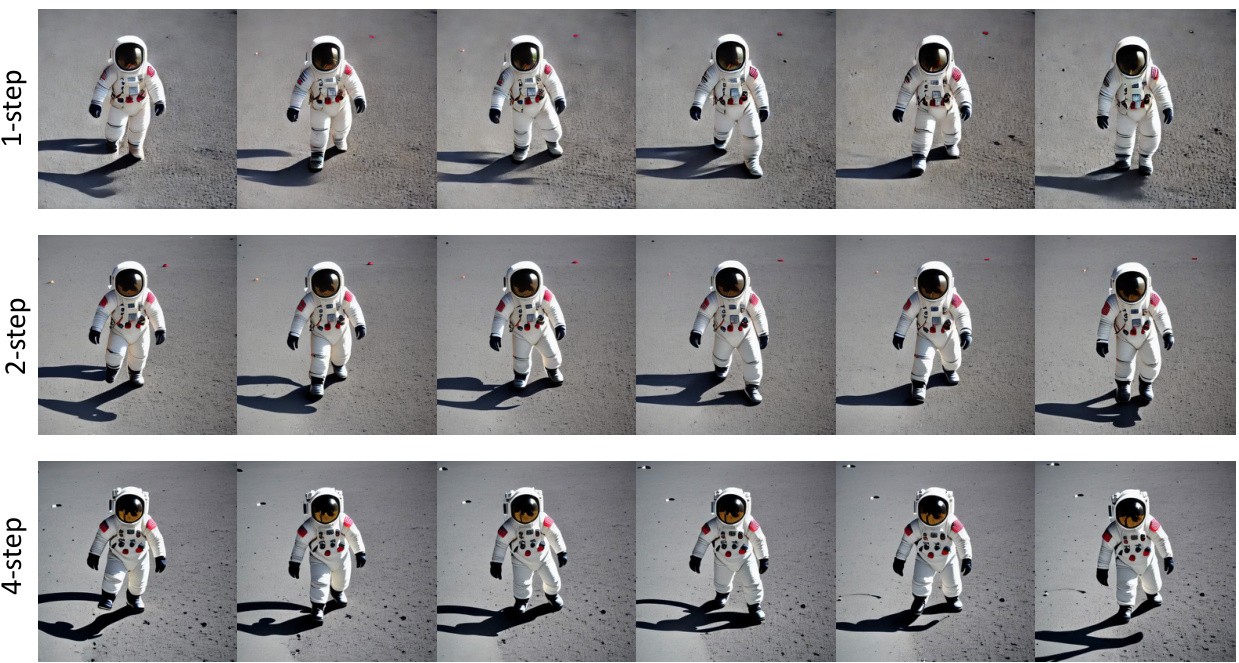
This figure shows the results of image and video generation using Phased Consistency Models (PCMs) with different numbers of steps (1-step, 2-step, 4-step, 8-step, 16-step). It visually demonstrates the model’s ability to generate high-quality images and videos efficiently, even with a small number of steps. The results include both text-to-image and text-to-video generation examples, showcasing the versatility of the PCM approach.

This figure shows the results of image and video generation using Phased Consistency Models (PCMs) with different numbers of steps. The left side demonstrates image generation, showcasing improvements in stability and speed compared to existing methods. The right side illustrates video generation, highlighting the model’s ability to produce high-quality videos in fewer steps. The figure visually demonstrates one of the paper’s main contributions: creating a method for stable and efficient image and video generation.
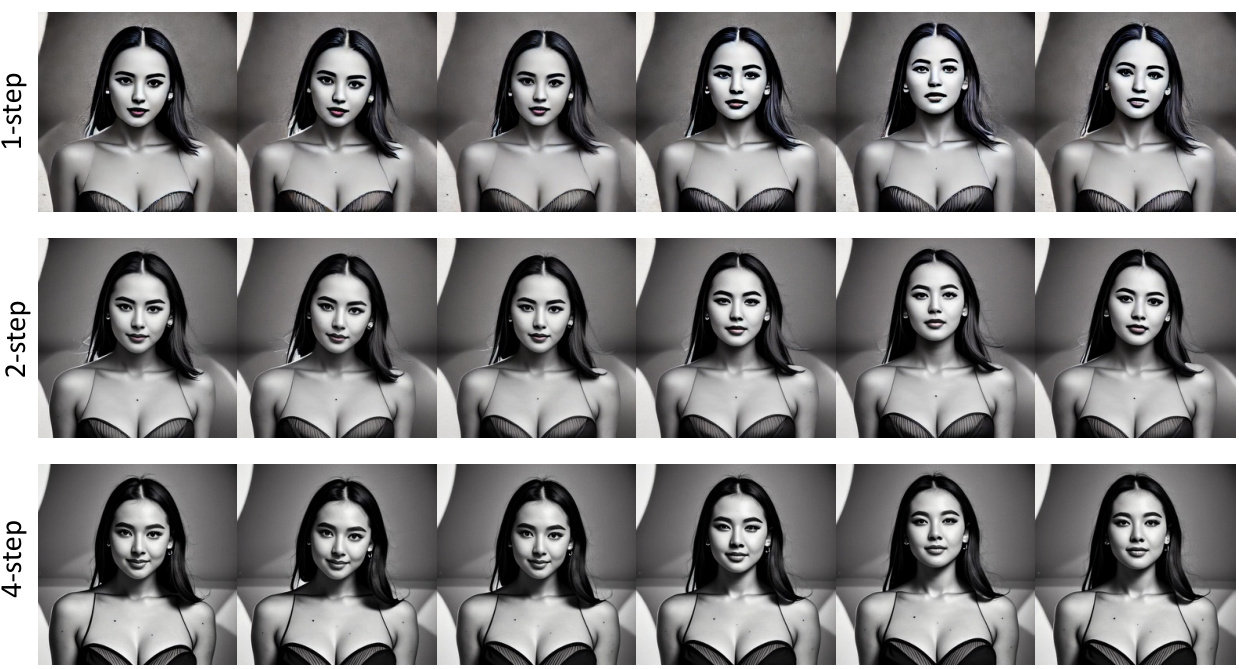
This figure shows several image and video generation results using Phased Consistency Models (PCMs). It visually demonstrates the model’s ability to generate stable and high-quality results across different numbers of steps (1-step, 2-step, 4-step, 8-step, and 16-step) for both image and video generation. The samples show a variety of subjects and styles, highlighting the versatility of the PCM approach.

This figure shows examples of image and video generation results using Phased Consistency Models (PCMs). The top row demonstrates text-to-image generation with different numbers of steps (8-step, 4-step, 2-step, and 1-step). The bottom row shows text-to-video generation results with 2-step and 16-step. It visually demonstrates the ability of PCMs to produce stable and high-quality results even with fewer steps than traditional methods.
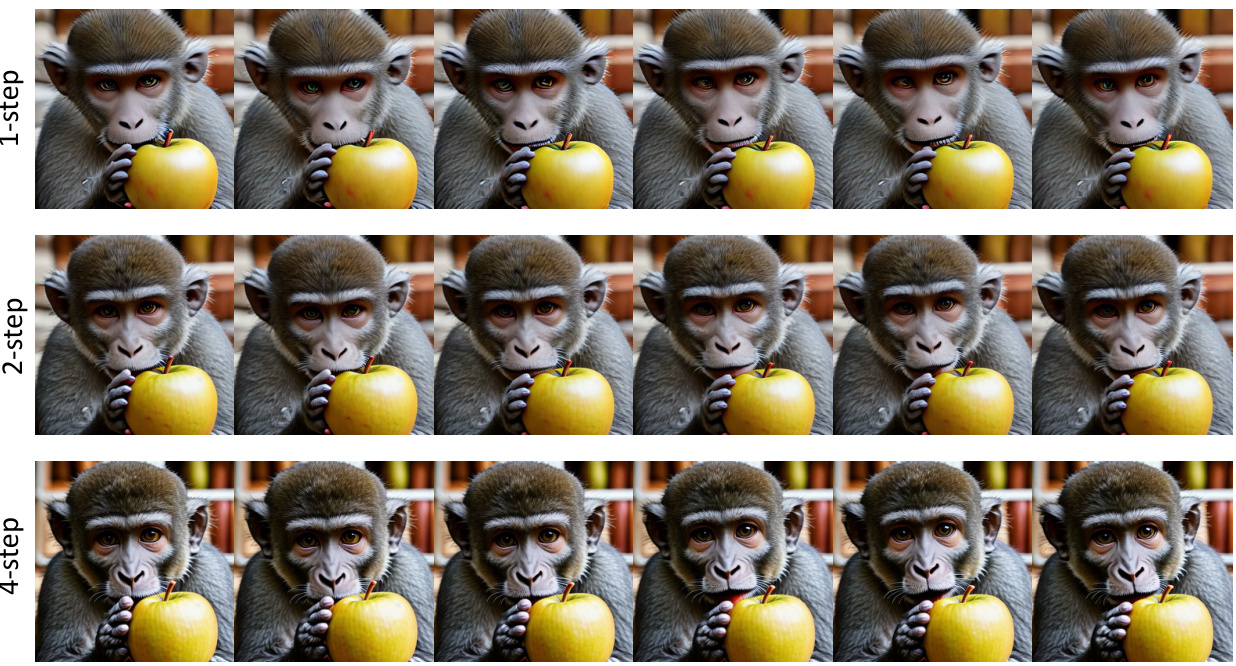
This figure shows the results of image and video generation using Phased Consistency Models (PCMs). It visually demonstrates the ability of PCMs to produce stable and high-quality results across different numbers of generation steps (1-step, 2-step, 4-step, 8-step, 16-step), for both image and video generation. The results suggest that PCMs are efficient at generating high-quality results, even with fewer steps, compared to other methods. This figure is a visual summary of the effectiveness and efficiency of the PCM approach.

This figure shows the results of image and video generation using Phased Consistency Models (PCMs). The top row demonstrates text-to-image generation with 1, 2, 4, and 8 steps. The bottom row demonstrates text-to-video generation with 2 and 16 steps. The figure highlights the stability and speed of PCMs in generating high-quality images and videos.

This figure showcases the results of Phased Consistency Models (PCMs) in generating both images and videos. It visually demonstrates the stable and fast generation capabilities of the model, highlighting improvements over existing methods, especially in the context of multi-step generation. The figure includes examples of image generation at 1, 2, 4, and 8 steps for text-to-image and 2, 8, and 16 steps for text-to-video, offering a visual comparison of the model’s output at varying stages of the generative process. The visual comparison highlights the speed and stability offered by PCMs.

This figure shows the results of image and video generation using Phased Consistency Models (PCMs). The left side shows the image generation results with different numbers of steps (1-step, 2-step, 4-step, 8-step, 16-step) using PCMs. The right side shows the video generation results with 2-step and 16-step PCMs. The figure highlights the stability and speed of image and video generation achieved by PCMs.

This figure shows the results of image and video generation using Phased Consistency Models (PCMs). The top row shows results of text-to-image generation with different numbers of steps (8, 4, 2, and 1). The bottom row shows results of text-to-video generation with different numbers of steps (16, 2). The images showcase the improved stability and speed offered by the PCM model compared to previous methods. The improved consistency is visible as the image and video quality remain high even when using only a few steps in the generation process.

This figure showcases the results of Phased Consistency Models (PCMs) on image and video generation. It visually compares the outputs of PCMs with different numbers of steps (1-step, 2-step, 4-step, 8-step, and 16-step) for both image and video generation. The image generation examples demonstrate the consistency and quality of images generated at various steps, highlighting PCM’s ability to produce high-quality results even with fewer steps. The video generation examples show the temporal consistency and smoothness of the video generated by PCMs. Overall, the figure illustrates PCM’s efficiency and effectiveness in producing stable and high-quality outputs for both image and video generation tasks.

This figure shows examples of image and video generation results using Phased Consistency Models (PCMs). The top row showcases text-to-image generation, demonstrating the model’s ability to produce stable and high-quality images across various numbers of generation steps (1-step to 16-step). The bottom row shows text-to-video generation, highlighting the model’s capacity to generate coherent and smooth videos. The visual comparison aims to illustrate PCM’s effectiveness in creating consistent results across different generation settings, emphasizing its speed and stability.
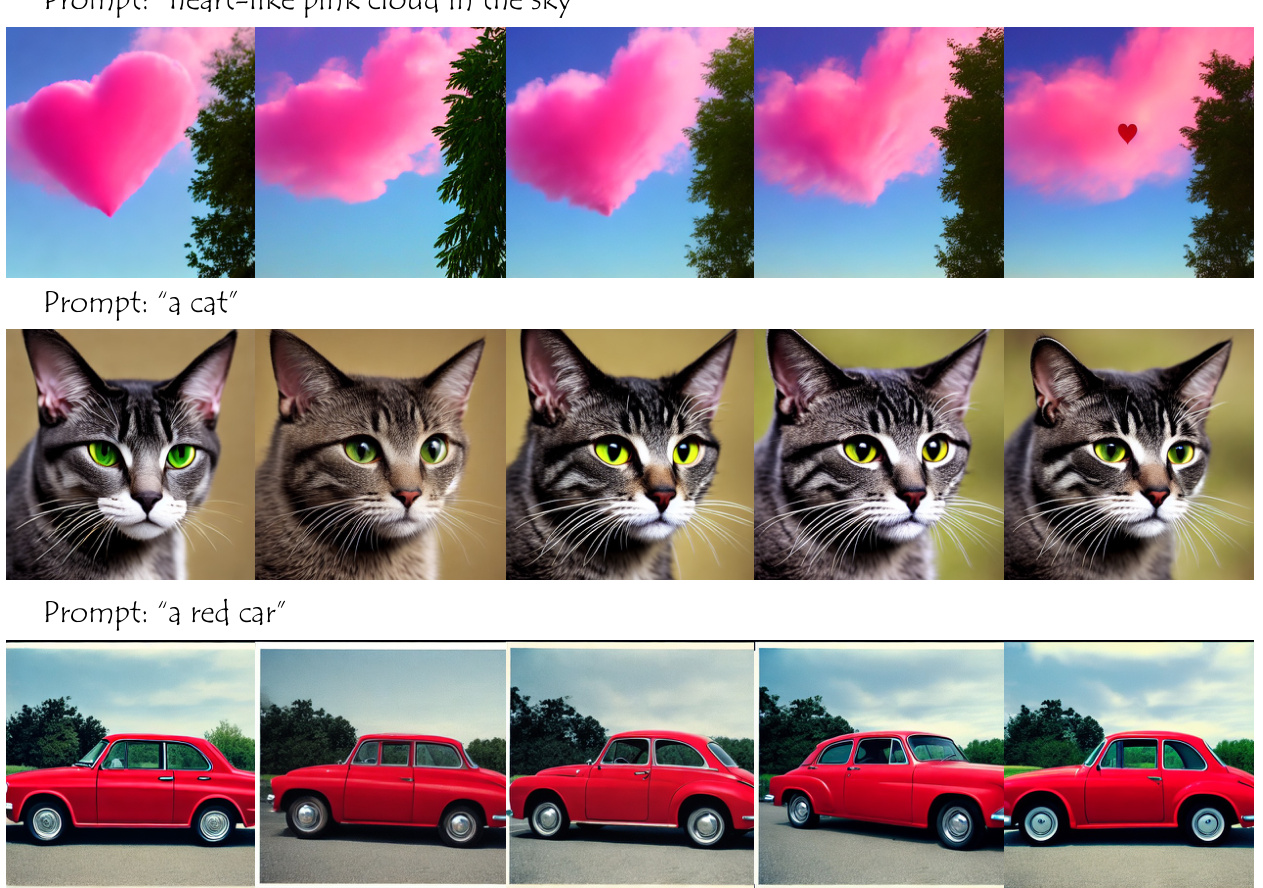
This figure shows examples of image and video generation results obtained using Phased Consistency Models (PCMs). The top row displays image generation results across different numbers of steps (8-step, 4-step, 2-step, 1-step) using the PCM, illustrating that the PCM can produce relatively stable and consistent image outputs irrespective of the number of steps. The bottom row shows video generation results in the text-to-video scenario using a 2-step PCM, indicating that the model can generate high-quality videos at a speed that significantly surpasses previous methods.
This figure showcases the results of Phased Consistency Models (PCMs) in generating both images and videos. It visually demonstrates the model’s ability to produce stable and high-quality outputs even with a reduced number of generation steps (1-step to 16-step). The left side shows image generation results across various step numbers and the right side shows video generation results.

This figure shows examples of image and video generation results using Phased Consistency Models (PCMs). It visually demonstrates the model’s ability to produce stable and high-quality outputs across various inference steps (1-step, 2-step, 4-step, 8-step, 16-step), showcasing its speed and efficiency compared to previous methods. Both image and video generations are presented, highlighting the versatility of PCMs.

This figure shows the results of image and video generation using Phased Consistency Models (PCMs). The left side demonstrates image generation with various numbers of steps (1-step, 2-step, 4-step, 8-step, 16-step), showcasing the model’s ability to produce stable and high-quality images even with fewer steps. The right side shows a similar comparison for video generation, highlighting PCMs’ effectiveness in producing coherent and temporally consistent videos.

This figure showcases the results of Phased Consistency Models (PCMs) in both image and video generation. It visually compares the image generation quality across different numbers of steps (1, 2, 4, 8, 16) using PCMs. The figure also demonstrates PCM’s applicability to video generation, displaying example results of text-to-video generation.

This figure shows the results of image and video generation using Phased Consistency Models (PCMs). The left side shows the image generation results for different numbers of steps (1-step, 2-step, 4-step, 8-step, 16-step) comparing PCM with other methods. The right side shows video generation results comparing PCMs with other methods.

This figure shows the results of image and video generation using Phased Consistency Models (PCMs). It visually demonstrates the model’s ability to produce stable and high-quality results across various numbers of generation steps (1-step, 2-step, 4-step, 8-step, and 16-step), both for images and videos. The images highlight the model’s performance on generating diverse subjects such as animals and people. The video results showcase the temporal consistency and quality of the generated video sequences. The figure provides a clear visual summary of the model’s capabilities.

This figure shows image and video generation results from the proposed Phased Consistency Models (PCMs). It demonstrates the ability of PCMs to generate stable and high-quality images and videos across various numbers of inference steps (1-step, 2-step, 4-step, 8-step, 16-step), showcasing improvements in stability and speed compared to previous methods. The image and video generation examples visually represent the model’s performance in handling different prompts and generating consistent outputs, even at lower inference steps.

This figure shows the results of image and video generation using Phased Consistency Models (PCMs). The left side shows image generation results with different numbers of steps (1, 2, 4, 8, 16 steps), demonstrating the stability and speed of the method. The right side shows video generation results, showcasing its versatility and state-of-the-art performance in generating high-quality videos.

This figure showcases the results of Phased Consistency Models (PCMs) in image and video generation. It visually compares the results across different numbers of sampling steps (1-step, 2-step, 4-step, 8-step, 16-step) for both image and video generation, highlighting the model’s ability to produce stable and high-quality results even with fewer steps than traditional methods. The left side shows text-to-image generation, while the right shows text-to-video generation, demonstrating the versatility of the PCM approach.

This figure shows the results of image and video generation using Phased Consistency Models (PCMs). The top row shows image generation results, comparing the quality and consistency across different numbers of sampling steps (8-step, 4-step, 2-step, 1-step). The bottom row showcases the application of PCMs to video generation, illustrating the generation quality of video at 2-step and 16-step.

This figure showcases the results of Phased Consistency Models (PCMs) in generating both images and videos. It presents multiple image samples generated using PCMs with varying inference steps (1-step, 2-step, 4-step, 8-step, and 16-step), demonstrating the model’s stability and speed across different settings. Additionally, it includes examples of video generation using PCMs, highlighting the model’s effectiveness in producing coherent and high-quality video outputs.

This figure demonstrates the capability of Phased Consistency Models (PCMs) in generating high-quality images and videos efficiently. It showcases the results of PCMs across different numbers of generation steps (1-step, 2-step, 4-step, 8-step, 16-step) for both image and video generation. The image generation examples exhibit consistency across various numbers of steps, with improvements in quality and stability as the number of steps increases. The video generation examples show the models’ ability to create fluent and visually appealing videos, suggesting the effectiveness of PCMs in generating video data.

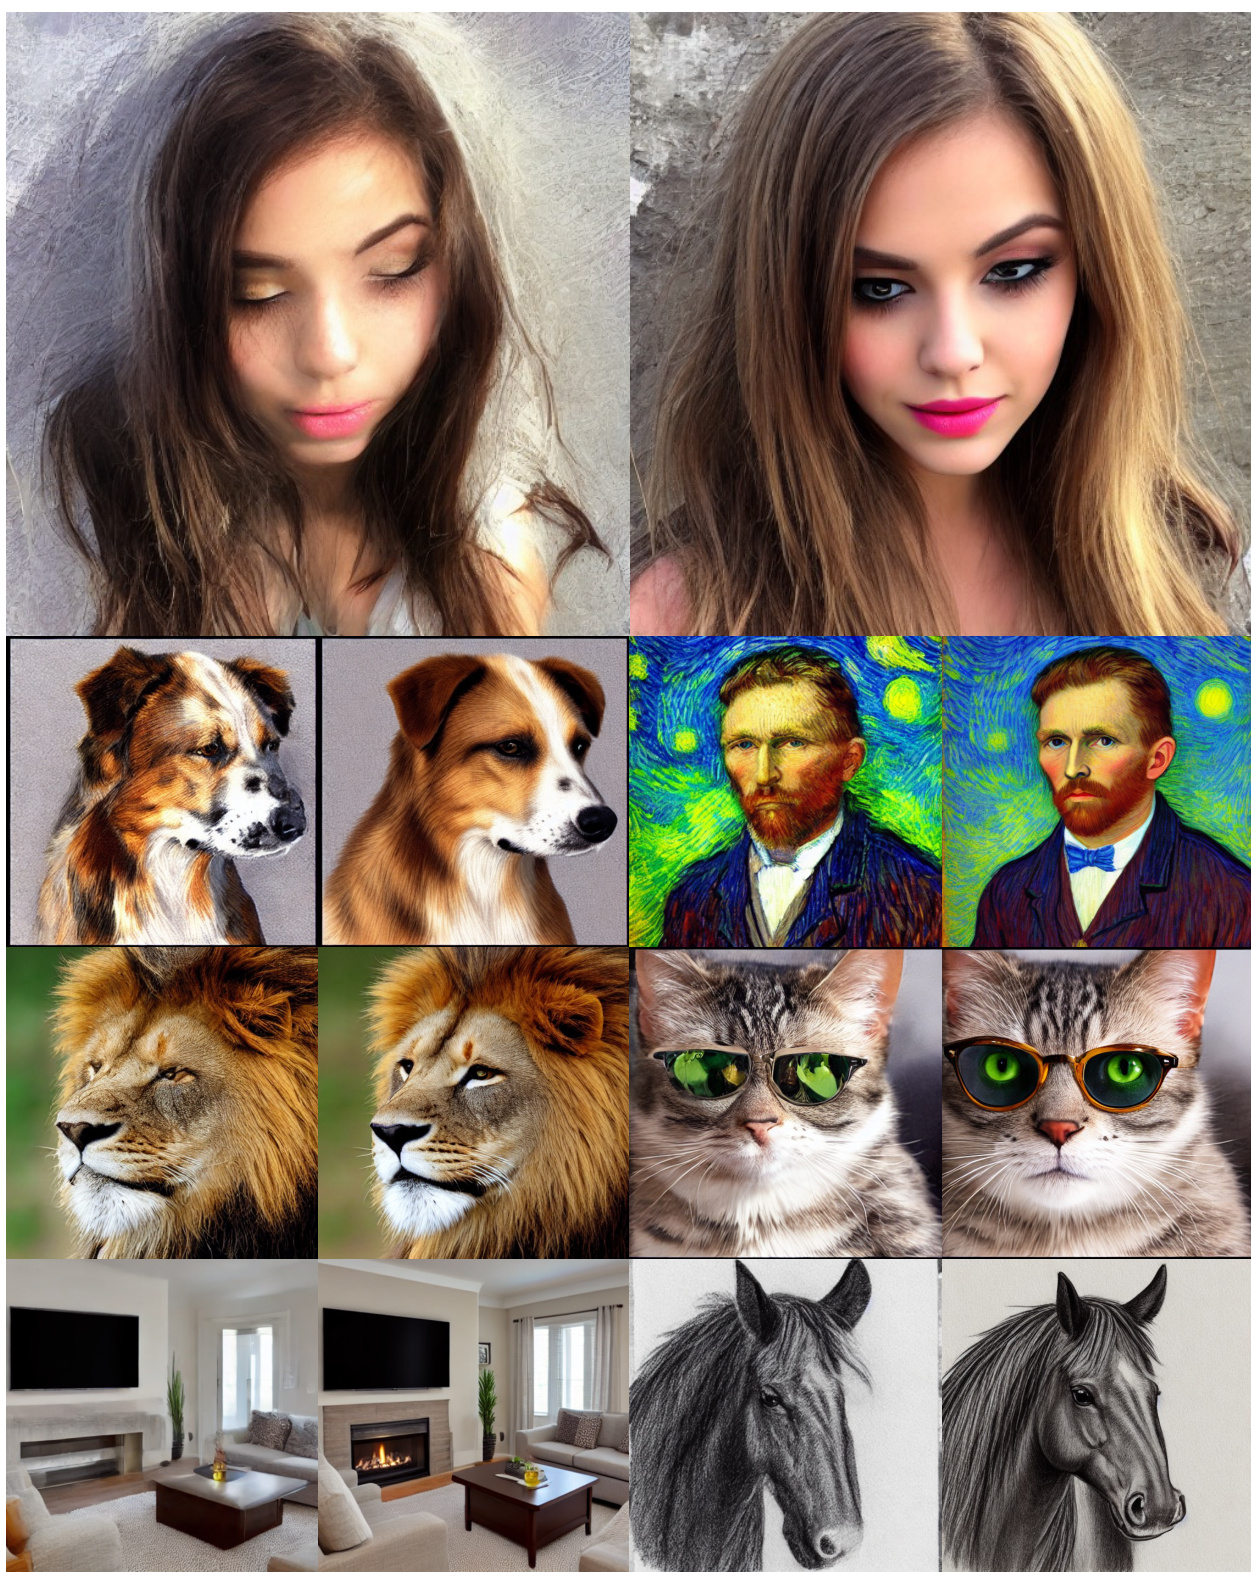
This figure shows a collage of images generated using the Phased Consistency Model (PCM) with Stable Diffusion v1-5, showcasing the model’s ability to generate diverse and high-quality images in just two steps. The images depict a range of subjects and styles, highlighting the versatility of the PCM.

This figure showcases the results of the Phased Consistency Model (PCM) for both image and video generation. The left side demonstrates image generation with varying numbers of steps (1, 2, 4, 8, 16), highlighting the model’s ability to produce consistent and high-quality images regardless of the number of steps. The right side illustrates text-to-video generation, demonstrating PCM’s capability to generate stable and high-quality videos in a few steps. The figure visually supports the paper’s claim that PCM improves both speed and stability of generation compared to existing methods.

This figure shows the results of image and video generation using Phased Consistency Models (PCMs). The left side displays image generation results at different numbers of steps (1, 2, 4, 8, 16-step), demonstrating improved stability and speed compared to existing Latent Consistency Models (LCMs). The right side shows video generation results from text prompts, highlighting PCM’s versatility and state-of-the-art performance in few-step video generation.

This figure demonstrates the capabilities of Phased Consistency Models (PCMs) in generating high-quality images and videos. It showcases examples of image generation with different numbers of steps (1-step, 2-step, 4-step, 8-step, 16-step), highlighting the model’s ability to produce stable and consistent results across varying step counts. Furthermore, it includes examples of text-to-video generation, showing PCMs’ versatility in handling different modalities.

This figure demonstrates the capability of Phased Consistency Models (PCMs) to generate both high-quality images and videos efficiently. It shows examples of image generation with different numbers of steps (1-step, 2-step, 4-step, 8-step, and 16-step) using PCMs, highlighting the model’s ability to achieve stable and fast generation even with fewer steps. The video generation results further showcase the versatility and state-of-the-art performance of PCMs in producing high-quality video outputs.

This figure shows examples of images and videos generated using Phased Consistency Models (PCMs). The left side displays images generated from text prompts, showcasing the model’s ability to produce stable and high-quality results across various numbers of steps in the generation process (1-step, 2-step, 4-step, 8-step, 16-step). The right side demonstrates the application of PCMs to video generation, highlighting the model’s capability to produce coherent and visually appealing video output.

This figure shows examples of image and video generation results obtained using Phased Consistency Models (PCMs). The left side showcases text-to-image generation results at various step counts (1, 2, 4, 8, and 16 steps), demonstrating the model’s ability to produce high-quality images with fewer steps than traditional methods. The right side displays results of text-to-video generation, showcasing the method’s versatility across different video generation tasks. Overall, this figure visually demonstrates the speed and stability of PCMs compared to other methods in generating both images and videos.

This figure showcases the capabilities of Phased Consistency Models (PCMs) in generating high-quality images and videos. It visually compares the results of PCMs against other methods (LCMs) across various numbers of generation steps (1-step, 2-step, 4-step, 8-step, and 16-step). The results demonstrate PCM’s ability to produce stable and high-quality outputs even with a smaller number of steps, improving both speed and visual fidelity, especially evident in the text-to-video generation examples.

This figure showcases the capabilities of Phased Consistency Models (PCMs) in generating both images and videos. The left side shows image generation results, demonstrating improvements in speed and stability across different numbers of sampling steps (1-step, 2-step, 4-step, 8-step, 16-step). The right side illustrates PCM’s application to video generation, also highlighting faster and more consistent results compared to traditional methods. The overall message is that PCMs lead to better and faster image and video generation across a variety of parameters.

This figure shows examples of images and videos generated using Phased Consistency Models (PCMs). The left side shows images generated from text prompts, demonstrating the model’s ability to produce high-quality and consistent results across different numbers of sampling steps. The right side shows videos generated using PCMs, showcasing the model’s capability for video generation.
This figure shows examples of image and video generation results using Phased Consistency Models (PCMs). The left side displays various image generation results with different numbers of steps (8-step, 4-step, 2-step, 1-step) showcasing image stability and quality across different inference steps. The right side showcases the model’s capabilities in text-to-video generation, demonstrating stable and fast video generation across various inference steps (16-step, 2-step). This visually demonstrates the key advantage of PCMs in generating stable results even with a small number of steps.
This figure shows the results of image and video generation using Phased Consistency Models (PCMs). The left side displays image generation results comparing PCMs with different numbers of steps (8-step, 4-step, 2-step, 1-step) against a standard Latent Consistency Model (LCM) of similar design. The right side shows video generation results using PCMs (16-step, 2-step) for text-to-video generation. The overall message is that PCMs produce stable results across various step sizes, unlike LCMs, and are suitable for both image and video generation.
This figure showcases the results of Phased Consistency Models (PCMs) in generating both images and videos. It displays examples generated using different numbers of steps (1, 2, 4, 8, 16 steps) for both image and video generation, highlighting the model’s ability to produce stable and high-quality results even with fewer steps compared to previous methods. The images demonstrate the model’s capacity for text-to-image generation, while the video examples illustrate its capability for text-to-video generation.
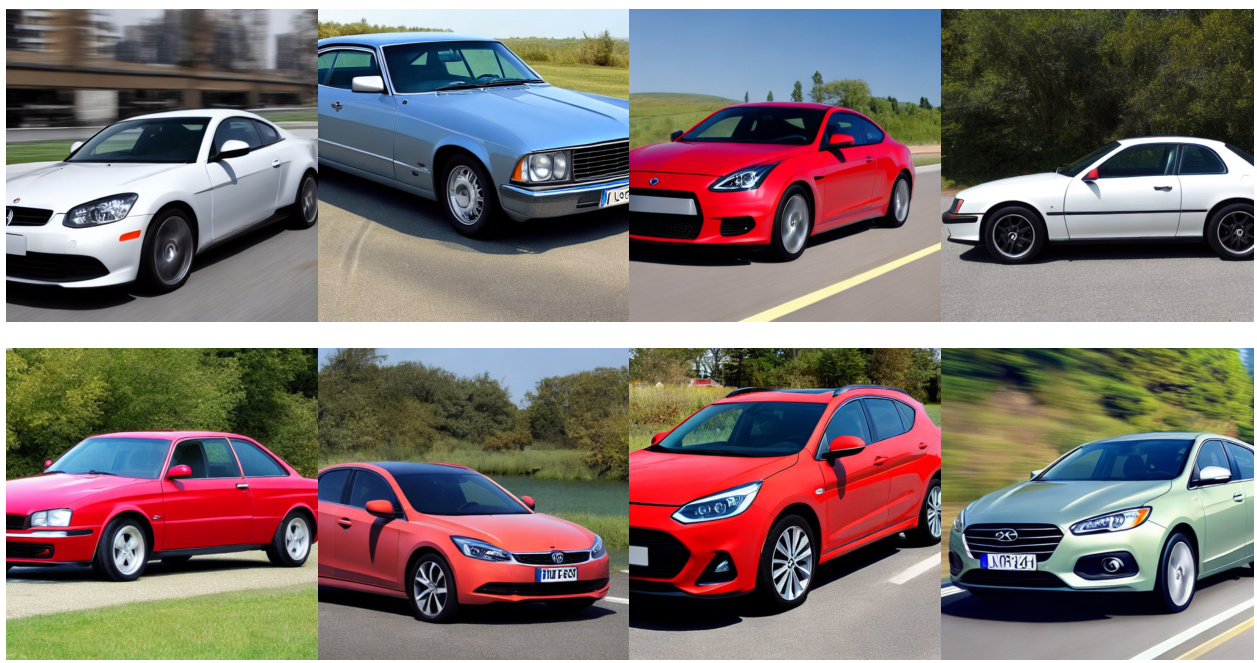
This figure shows examples of image and video generation results using Phased Consistency Models (PCMs). The top row showcases text-to-image generation with different numbers of steps in the generation process (8-step, 4-step, 2-step, 1-step). The bottom row shows text-to-video generation using PCMs. The results illustrate the model’s ability to produce high-quality outputs efficiently, even with a reduced number of steps.

This figure shows image and video generation results using Phased Consistency Models (PCMs). It visually demonstrates the model’s ability to produce stable and high-quality results across various numbers of generation steps (1-step, 2-step, 4-step, 8-step, 16-step), showcasing improvements in consistency and speed over existing methods. The top row displays image generation from text prompts, while the bottom showcases video generation, highlighting the model’s versatility.

This figure shows visual examples of image and video generation using Phased Consistency Models (PCMs). The top row showcases image generation with different numbers of steps (1-step, 2-step, 4-step, 8-step, 16-step) demonstrating the stable and fast generation capabilities of the model. The bottom row displays video generation results, further highlighting the model’s versatility and efficiency. The overall caption emphasizes the model’s ability to achieve stable and fast image and video generation.

This figure shows the results of image and video generation using Phased Consistency Models (PCMs). It demonstrates that PCMs are able to generate stable and high-quality images and videos even with a small number of steps. This is in contrast to previous methods, which often produce blurry or inconsistent results.
More on tables

This table compares the performance of different image generation methods using two metrics: FID (Fréchet Inception Distance) and FID-CLIP (FID using CLIP features). It shows the FID-SD (FID on Stable Diffusion v1-5), FID-CLIP, and CLIP score for 1, 2, 4, 8, and 16 inference steps. Lower FID scores indicate better image quality, and higher CLIP scores indicate better alignment with text prompts. The ‘Consistency’ column provides an additional metric indicating the consistency of generated images across different inference step settings. The methods compared include InstaFlow, SD-Turbo, CTM, LCM, TCD and the authors’ proposed method, PCM.

This table compares the Fréchet Inception Distance (FID) scores using the Stable Diffusion model for image generation on the CC12M-30K dataset. It shows a comparison of the FID scores for different methods (SDXL-Lightning, SDXL-Turbo, SDXL-LCM, SDXL-CTM, Ours, Ours*) and across different numbers of generation steps (1-step, 2-step, 4-step, 8-step, and 16-step). The lower the FID score, the better the performance of the model.

This table presents a quantitative comparison of video generation results using different methods. Specifically, it compares the CLIP Score (measuring text-video alignment), Flow Magnitude (measuring motion magnitude), and CLIP Consistency (measuring inter-frame consistency) for three different methods: DDIM, DPM, and AnimateLCM, as well as the proposed PCM method. The results are shown for 1-step, 2-step, and 4-step generation settings.

This table presents a comparison of the performance of different methods on Stable Diffusion XL for both one-step and two-step image generation. It uses FID (Fréchet Inception Distance), FID-CLIP (FID calculated with CLIP features), and CLIP score as metrics to evaluate image quality and text-image alignment. The ‘Consistency’ column shows a relative measure of how consistent image generation is across different inference steps. Lower FID and higher CLIP score values generally indicate better performance. The table allows readers to compare the performance of PCM to existing state-of-the-art methods (SDXL-Turbo, SDXL-Lightning, SDXL-LCM, SDXL-CTM) for different inference steps, providing insights into the effectiveness of PCM in various image generation scenarios.
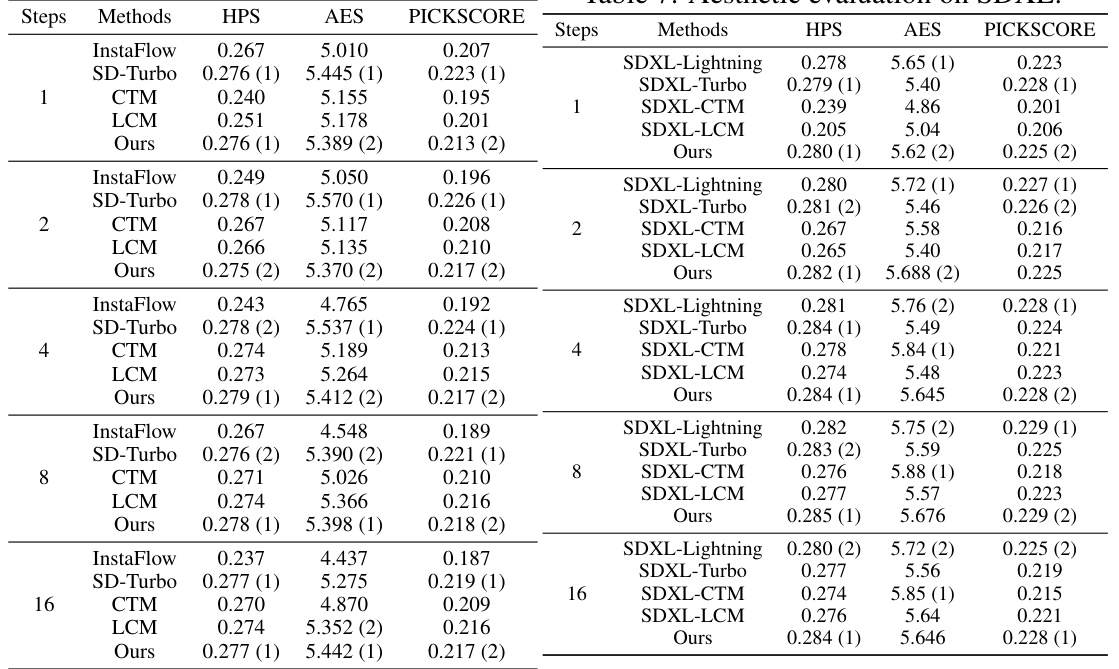
This table presents a quantitative comparison of different image generation methods based on Stable Diffusion v1-5, evaluated using FID (Fréchet Inception Distance) and FID-CLIP (FID calculated using CLIP features) scores. The methods are compared across various numbers of inference steps (1, 2, 4, 8, 16). Lower FID scores indicate better image quality. Higher CLIP scores indicate better alignment between the generated image and its text prompt. The table helps assess the relative performance of different consistency models (PCMs, LCMs, CTMs) against baselines and illustrates how image quality changes with the number of sampling steps.

This table presents the results of a human aesthetic evaluation comparing the proposed model with and without the adversarial consistency loss. The evaluation metrics used include HPS, AES, and PICKSCORE, assessing the aesthetic quality of images generated at different inference steps (1, 2, 4, 8, 16). The results demonstrate the positive effect of the adversarial consistency loss on image quality, as indicated by higher scores across all metrics and steps.

This table presents a quantitative comparison of different image generation methods based on Stable Diffusion v1-5, evaluated using FID (Fréchet Inception Distance) and FID-CLIP scores. The comparison considers various numbers of inference steps (1, 2, 4, 8, 16), across two datasets (COCO-30K and CC12M-30K). The results show the FID-SD and FID-CLIP scores for each method under different step settings, allowing for a direct comparison of performance in terms of image quality and alignment with text prompts.
Full paper#


