↗ OpenReview ↗ NeurIPS Homepage ↗ Hugging Face ↗ Chat
TL;DR#
Large language and vision models demand significant computational resources, hindering their deployment. Current model compression techniques often suffer from performance degradation due to misalignment with the true underlying structures in the weight matrices. This paper introduces the Block-Level Adaptive Structured (BLAST) matrix, a flexible approach that learns efficient structures either from data or existing weights.
BLAST boasts significant advantages over existing methods. It addresses the misalignment issue via flexible structures adaptable to various model types. Its efficiency stems from optimized matrix multiplication and well-defined gradients allowing easy integration into existing training frameworks. Empirical results show that BLAST successfully boosts performance while substantially reducing the computational complexity and memory footprint of medium-sized and large foundation models across language and vision tasks.
Key Takeaways#
Why does it matter?#
This paper is crucial for researchers focused on efficient deep learning inference; it presents a novel method to significantly reduce computational costs without major performance loss. This offers a new avenue of research to enhance the speed and efficiency of large-scale models, directly addressing the limitations of existing deep learning solutions. The adaptability of the method to different model architectures and the provided open-source code further extend its potential impact on the research community.
Visual Insights#

This figure compares image generation results from a diffusion model (DiT) using three different weight matrices: the original full-rank matrix, a low-rank approximation, and a BLAST matrix. All three models were compressed to 50% of their original parameter size and then retrained on ImageNet. The figure shows that the BLAST compressed model generates images of comparable quality to the original model, while the low-rank compressed model produces images with noticeable artifacts.
This table compares the performance of compressing a diffusion model’s weight matrices using different methods and then retraining it. It shows the Fréchet Inception Distance (FID) and Inception Score (IS) which are common metrics for assessing the quality of generated images. A lower FID score and a higher IS score are better, indicating that the generated images are more realistic and diverse, respectively. The compression ratio (CR) indicates how much smaller the compressed model is than the original model. The results indicate that using the BLAST matrix for compression resulted in better image quality compared to low-rank approximation after retraining.
In-depth insights#
BLAST Matrix Design#
The BLAST matrix design is a novel approach to creating efficient and flexible structured matrices for deep neural network inference. Its core innovation lies in the factorization of weight matrices into shared left and right factors coupled with block-wise diagonal factors. This design allows the matrix to represent various types of structures, offering significant flexibility by adaptively learning structures prevalent in the data or pre-existing matrices. The block-level structure enhances computational efficiency, enabling faster matrix-vector multiplications vital for efficient inference. The use of learnable diagonal coupling factors allows for diverse structures, unlike existing methods that impose specific structures, potentially misaligned with the underlying data. Furthermore, the design is optimized for GPU acceleration, avoiding the limitations of existing methods that may not be computationally efficient on standard hardware. Data-driven learning of the factors, either from scratch during training or by factorization of pre-trained weights, improves the accuracy and efficiency of the resulting compressed models.
Training & Compression#
The effectiveness of integrating structured matrices into deep neural network training and compression is a significant focus. Training from scratch using the proposed structured matrix allows the network to learn efficient weight representations directly during the training process, potentially improving performance while reducing model complexity. Compression of pre-trained weights offers a way to reduce the size of already existing large models. This involves factorizing the weights into a structured format, which allows for a smaller model size that can be easily deployed to resource-constrained environments. The process can be further improved by a subsequent re-training phase. The combination of training and compression techniques is particularly promising for large foundation models, aiming to balance model performance and computational efficiency. These methods are designed for GPU optimization, facilitating practical application and scalability.
Empirical Validation#
An empirical validation section would rigorously test the proposed method’s claims. It should present results on diverse, representative datasets, comparing performance against relevant baselines using appropriate metrics. Statistical significance should be established, ideally with error bars, p-values, or confidence intervals, to avoid overinterpreting results. The choice of baselines should be justified, ensuring a fair comparison. A strong validation would demonstrate robustness against various factors such as data size, model architecture, and hyperparameter settings. Ablation studies, removing or altering key components, would isolate the contribution of each part. The discussion should not only present the results, but also offer nuanced interpretation, addressing any limitations and unexpected findings, demonstrating an awareness of the experimental setup and potential biases. Overall, a strong empirical validation builds confidence in the method’s effectiveness and reliability, ultimately improving the research’s credibility and impact.
Limitations & Future#
The section ‘Limitations & Future Work’ in a research paper would critically assess the study’s shortcomings and propose avenues for future research. Limitations might include the scope of the datasets used (e.g., limited size, specific domains), the specific methodology’s constraints (e.g., computational cost, reliance on specific assumptions), or the generalizability of the findings to diverse settings. Addressing these limitations would be key; for example, exploring larger datasets, testing the method on different hardware or using alternative approaches to increase robustness or efficiency could be mentioned. Regarding Future Work, the authors could propose several exciting research directions. This could include extending the current approach to encompass other relevant tasks or model architectures, enhancing existing functionality (e.g., speed improvements, more accurate results), or developing novel techniques that tackle identified limitations. A strong conclusion would highlight the method’s potential and encourage follow-up research to validate findings and address remaining open questions.
Broader Impact#
The Broader Impact section of a research paper on efficient deep neural network inference using the BLAST matrix method should carefully consider both the positive and negative implications of this technology. On the positive side, increased efficiency translates to reduced energy consumption and cost, making AI more accessible and sustainable. This could particularly benefit resource-constrained settings like developing countries or edge devices. The improved efficiency also allows for the development of more powerful and complex AI models, potentially leading to advancements in various fields like healthcare, education, and scientific discovery. Conversely, there are potential risks. Improved efficiency might lower the barrier to entry for malicious applications of AI, such as the creation of realistic deepfakes or the development of more sophisticated autonomous weapons systems. Therefore, a responsible discussion of these potential risks, alongside mitigation strategies, is crucial for a comprehensive Broader Impact analysis.
More visual insights#
More on figures

This figure compares various existing structured matrices (Monarch, Low-Rank, Block-Diagonal, GBLR) with the proposed BLAST matrix. It visually illustrates how each matrix type structures the weight matrix A, highlighting the unique block-wise adaptive structure of BLAST. The visual representation emphasizes the factor sharing and individual diagonal factors which give BLAST its flexibility and efficiency in matrix multiplication.

This figure compares the convergence rate of the gradient descent (GD) method and the preconditioned gradient descent (PrecGD) method for BLAST matrix factorization. Two scenarios are considered: one where the rank of the BLAST matrix (r) is equal to the true rank of the target matrix (r*), and another where r is greater than r*. The left panel shows that for the exact rank case (r=r*), both GD and PrecGD converge to a low error, but PrecGD converges faster. The right panel illustrates that when the rank is over-parameterized (r>r*), GD fails to converge, while PrecGD still achieves low error. This demonstrates the effectiveness of the PrecGD method for improving the efficiency of BLAST matrix factorization, especially in scenarios where the true rank is unknown.
This figure compares the image generation quality of three different models: the original DiT model, a low-rank compressed model, and a BLAST compressed model. All models were compressed to 50% of their original size and re-trained on ImageNet. The images generated by the BLAST model maintain a high level of quality compared to the original model, while the low-rank model produces images with noticeable artifacts.

This figure shows the accuracy and relative FLOPs (floating point operations) for different structured weight matrices when training a Vision Transformer (ViT-S) model from scratch on CIFAR-10 and CIFAR-100 datasets. It compares the performance of BLAST with other structured matrices like Low-Rank, Monarch, Pixelfly, and Gaudi-GBLR. The x-axis represents the relative FLOPs, indicating the computational cost compared to a dense ViT-S model (100% FLOPs), and the y-axis shows the classification accuracy. The results demonstrate the effectiveness of the BLAST matrix in achieving a high accuracy with reduced computational cost compared to other tested methods.
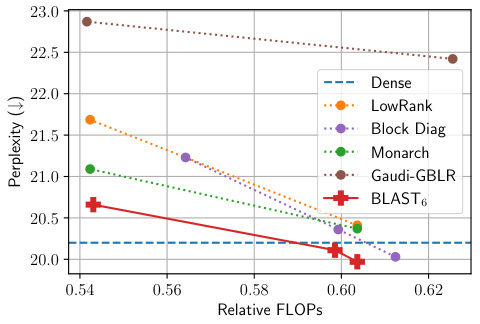
This figure shows the performance of different weight matrix types in GPT-2 model pre-training on the WikiText-103 dataset. The x-axis represents the relative FLOPs (floating-point operations), indicating the computational cost. The y-axis shows the test perplexity, a measure of how well the model predicts the next word in a sequence—lower is better. The plot compares the performance of a dense weight matrix (baseline), low-rank matrices, block diagonal matrices, Monarch matrices, Gaudi-GBLR matrices, and the proposed BLAST matrices. The BLAST matrix achieves the best perplexity-FLOPs trade-off, indicating its efficiency in compressing the model while maintaining performance.

This figure compares the performance of different structured weight matrices on CIFAR-10 and CIFAR-100 image classification tasks when training Vision Transformers (ViT-S) from scratch. The x-axis represents the relative FLOPs (floating-point operations) indicating computational efficiency. The y-axis shows the classification accuracy achieved. By comparing the accuracy against relative FLOPs, we can assess the trade-off between model efficiency and performance for different methods. The methods being compared include dense weight matrices, low-rank matrices, Monarch matrices, Gaudi-GBLR matrices, and the proposed BLAST matrices with different block sizes (BLAST3 and BLAST12). The figure illustrates how BLAST achieves a better accuracy-efficiency trade-off, outperforming other methods with lower computational cost.

This figure shows the performance of Llama-7B language model after compression with BLAST matrices. The x-axis represents the compression ratio (%), while the y-axis shows the average zero-shot accuracy (%). Three lines are plotted: uncompressed model, BLAST16 compression only, and BLAST16 compression with re-training. The graph shows that re-training after compression significantly improves the model’s performance, especially at higher compression ratios.

This figure compares the image generation results of a diffusion model (DiT) using three different weight matrices: the original, full-weight matrix, a low-rank approximation, and the proposed BLAST matrix. All models were compressed to 50% of their original size and then re-trained on ImageNet. The BLAST matrix demonstrates superior performance, producing images with much higher fidelity than the low-rank approximation.

This figure shows the convergence of the BLAST factorization algorithm with and without preconditioning. The left panel shows the case where the rank parameter (r) of the BLAST matrix is equal to the true rank of the target matrix (r*), demonstrating fast convergence with or without preconditioning. The right panel shows the case where r > r*, illustrating slower convergence for gradient descent (GD) without preconditioning, but much faster convergence with preconditioned gradient descent (PrecGD). This highlights the benefit of preconditioning when the rank is overestimated.
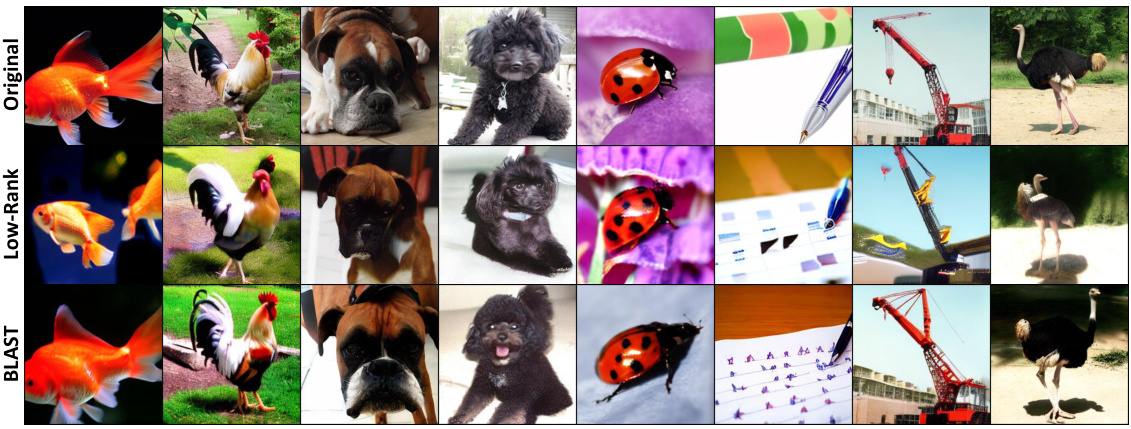
The figure compares the image generation quality of a diffusion model (DiT) using three different methods: the original uncompressed model, a model compressed using low-rank matrices, and a model compressed using BLAST matrices. All models are compressed by 50% and then retrained. The images generated by the BLAST compressed model maintain high fidelity to the original images, while the low-rank compressed model produces images with noticeable artifacts.

This figure compares image generation results from a diffusion model (DiT) using three different approaches: the original uncompressed model, a model compressed using low-rank matrices, and a model compressed using the proposed BLAST matrices. All models were compressed to 50% of their original size and then re-trained on ImageNet. The images generated by the BLAST-compressed model maintain a high level of visual quality compared to the original, while the low-rank compressed model introduces noticeable artifacts.
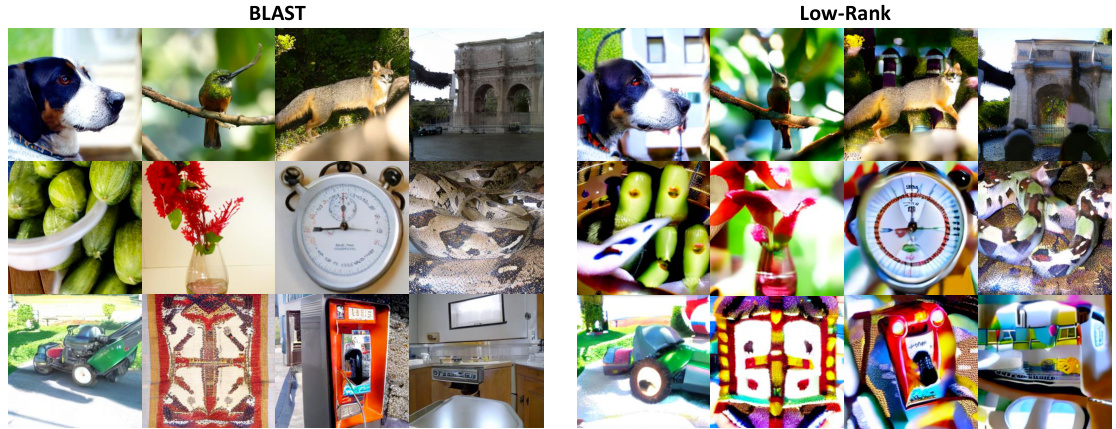
This figure compares image generation results from a diffusion model (DiT) using three different weight matrix compression methods. The original, uncompressed model is compared against models compressed using BLAST and low-rank matrices. The results demonstrate that BLAST maintains image quality better than the low-rank method, which introduces noticeable artifacts.

This figure compares image generation results from a diffusion model (DiT) using three different weight matrix compression methods: no compression (original), low-rank compression, and BLAST compression. Each method reduced the model size by 50%. The images demonstrate that the BLAST compression method preserves image quality far better than low-rank compression, which introduces significant visual artifacts.
More on tables

This table presents the ImageNet validation accuracy and the relative FLOPs (floating point operations) for different models of Vision Transformers (ViT-Base) trained from scratch using various weight matrix structures. The comparison includes a dense ViT-Base model as a baseline, along with models using low-rank, Monarch, Gaudi-GBLR, and BLAST weight matrices. The table shows the efficiency gains (reduction in FLOPs) achieved by using structured matrices compared to the dense model, while maintaining or improving accuracy.

This table compares the performance of compressing a diffusion model’s weight matrices using low-rank and BLAST methods. The comparison is based on the Fréchet Inception Distance (FID), the standard FID (sFID), and the Inception Score (IS) after retraining. A lower FID and sFID indicate better image quality, while a higher IS indicates better image diversity and quality. The Compression Ratio (CR) shows the percentage reduction in model size.

This table presents the results of compressing and retraining the Llama-7B language model using different methods. It compares the performance (WikiText-2 perplexity and average zero-shot accuracy across several tasks) of the original model with models compressed using Low-Rank, Monarch, Block-Diagonal, and BLAST matrices, at compression ratios of 20% and 50%. The table also indicates whether re-training was performed after compression. The best performing methods (lowest perplexity, highest accuracy) for each compression ratio are highlighted.

This table compares the performance of compressing a diffusion model’s weight matrices using different methods (Low-Rank and BLAST9) and retraining. It shows the Fréchet Inception Distance (FID), the improved FID (sFID), and the Inception Score (IS) for each method, comparing them against the uncompressed original model. The Compression Ratio (CR) indicates the percentage of weight parameters removed by each compression method.

This table presents the ImageNet validation accuracy and the relative floating point operations (FLOPs) of Vision Transformer Base (ViT-B) models trained from scratch using different structured weight matrices. It compares the performance of the standard dense ViT-Base model against models using low-rank, Monarch, Gaudi-GBLR, and BLAST matrices. The relative FLOPs are calculated with respect to the standard dense model (100%). The table helps demonstrate the efficiency gains of using structured matrices, especially the proposed BLAST matrix, in terms of reducing computational cost without significant loss of accuracy.

This table lists the hyperparameters used for re-training the models after compression. It includes the dataset used (ImageNet and SlimPajama), the model (ViT-B and Llama-7B), the number of epochs and steps, the weight decay, the batch size, warmup steps and start epoch, the learning rate scheduler, the initial learning rate and minimum learning rate, dropout rate, droppath rate, and the number of blocks (b) used for the BLAST matrix.

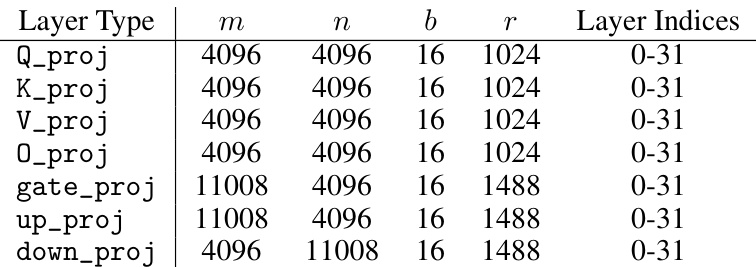
This table lists the hyperparameters used for compressing the DiT-XL/2 model using the BLAST9 matrix with a 50% compression ratio. It specifies the size of the original matrices (m, n), the number of blocks (b), the rank (r), and the layer indices where the BLAST matrix replaces the original weights. These hyperparameters are crucial for replicating the compression and retraining experiments reported in the paper.

This table details the hyperparameters used for compressing the DiT-XL/2 model using the BLAST9 method with a 20% compression ratio. It shows the dimensions (m, n) of the original weight matrices, the number of blocks (b), the rank (r) of the BLAST matrices, and the indices of the layers where the BLAST matrices replace the original weight matrices.
This table compares the performance of different methods for compressing the weight matrices of a diffusion model. The compression ratio (CR), Fréchet Inception Distance (FID), sFID, and Inception Score (IS) are reported. Lower FID and sFID values indicate better image quality, while a higher IS suggests better image diversity. The table helps to evaluate the effectiveness of BLAST in compressing the model while maintaining high image quality.

This table compares the performance of compressing a diffusion model’s weights using different methods, specifically focusing on the Fréchet Inception Distance (FID) and Inception Score (IS) metrics, which evaluate the quality of generated images. The compression ratio (CR) indicates the percentage reduction in model parameters. The table helps quantify how different compression techniques affect the quality of the generated images after retraining.

This table compares the performance of compressing the weight matrices of a diffusion model using different methods followed by retraining. It shows the Fréchet Inception Distance (FID), the modified Fréchet Inception Distance (sFID), and the Inception Score (IS) metrics for the original model and models compressed using low-rank and BLAST matrices with different compression ratios. Lower FID and sFID scores, and a higher IS score indicate better image generation quality.

This table compares the performance of compressing a diffusion model’s weight matrices using different methods, specifically focusing on the FID (Fréchet Inception Distance) and IS (Inception Score) metrics. The compression ratio (CR) is also shown. Lower FID and higher IS values indicate better image quality after compression and re-training.

This table compares the performance of compressing a diffusion model’s weight matrices using different methods. It shows the Fréchet Inception Distance (FID), the improved Fréchet Inception Distance (sFID), and the Inception Score (IS) for the original model and models compressed by 50% using different techniques, specifically Low-Rank and BLAST. A lower FID and sFID indicate better image quality, while a higher IS reflects more diverse and higher-quality generated images. The compression ratio is also provided.
Full paper#


