↗ OpenReview ↗ NeurIPS Homepage ↗ Chat
TL;DR#
Current methods for supervised learning primarily focus on embedding data in hyperbolic space, while ignoring the representation of the models themselves. This creates challenges in visualizing model properties and understanding their behavior, especially for tree-based models such as decision trees. This paper aims to solve this limitation by proposing an effective and interpretable approach for embedding supervised models, particularly decision trees, into a hyperbolic space.
The paper’s approach involves three key contributions: First, it establishes a connection between loss functions used in class probability estimation and hyperbolic distances. Second, it introduces “monotonic decision trees”—a novel type of supervised model—for obtaining unambiguous embeddings of decision trees. Third, it introduces a generalized version of the hyperbolic distance function that enhances visualization and improves numerical stability, particularly around the disk’s edge. These contributions, together, provide a comprehensive method for representing and visualizing supervised models in hyperbolic geometry, advancing the interpretability of such models.
Key Takeaways#
Why does it matter?#
This paper is crucial for researchers working on hyperbolic embeddings and supervised learning, offering a novel way to represent supervised models. It bridges the gap between unsupervised and supervised learning by applying hyperbolic geometry to supervised models, introducing the new method of monotonic decision trees. This opens avenues for improved visualization, better understanding of model behavior, and enhanced model interpretability, especially for tree-based models.
Visual Insights#

The figure shows a comparison between a standard decision tree and its monotonic version. The left panel illustrates that a simple embedding approach fails to accurately represent the structure of the decision tree. The right panel introduces monotonic decision trees (MDTs) as a solution, which provides a more accurate and unambiguous embedding by only considering the monotonically increasing path of node confidences.
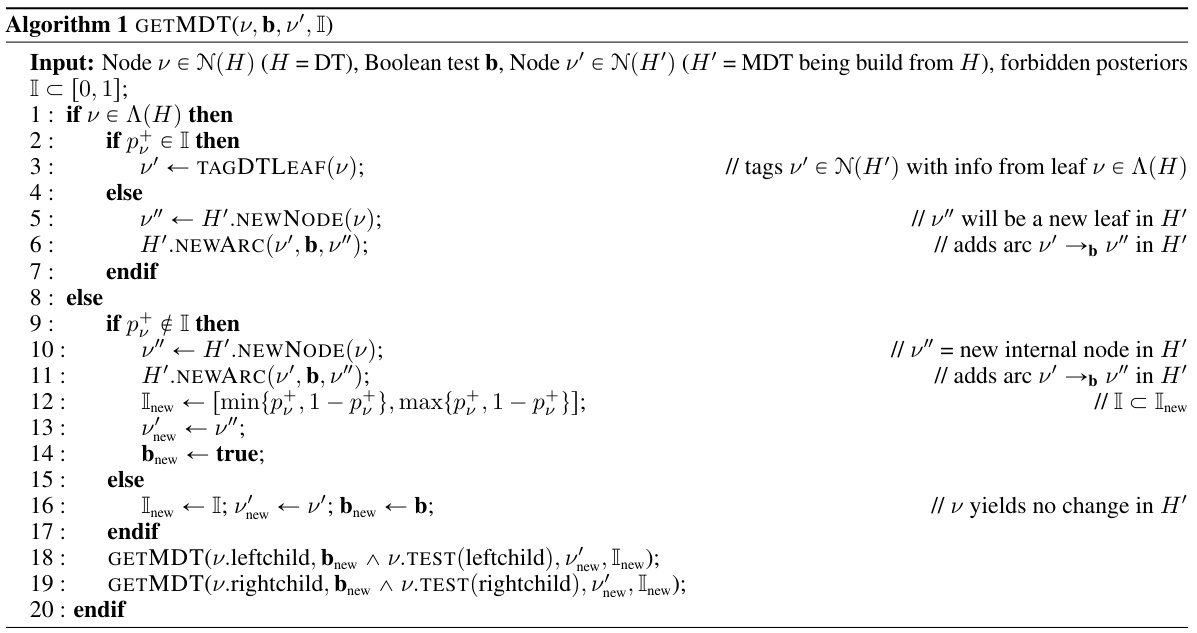
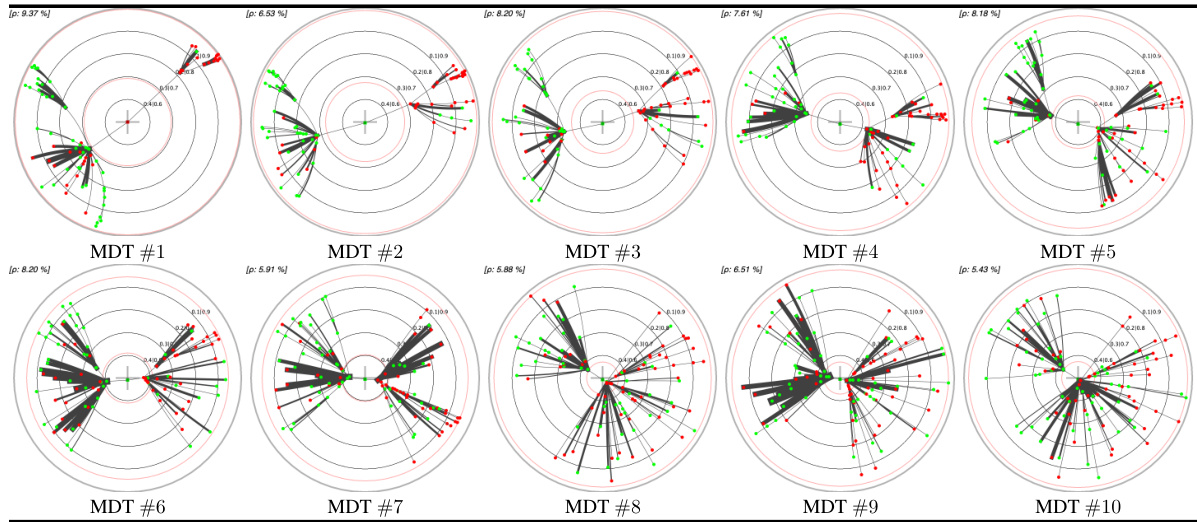
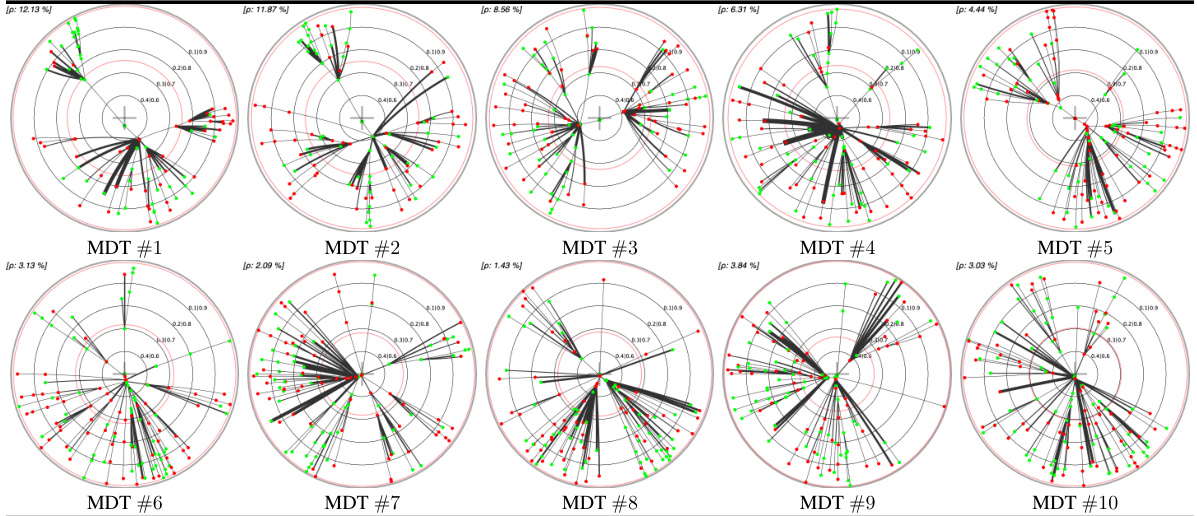
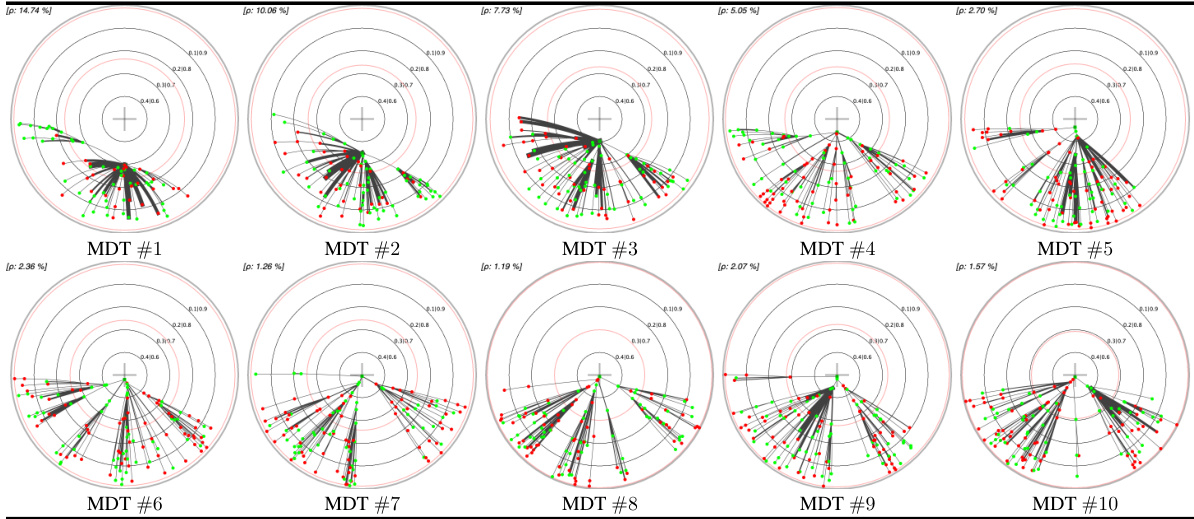
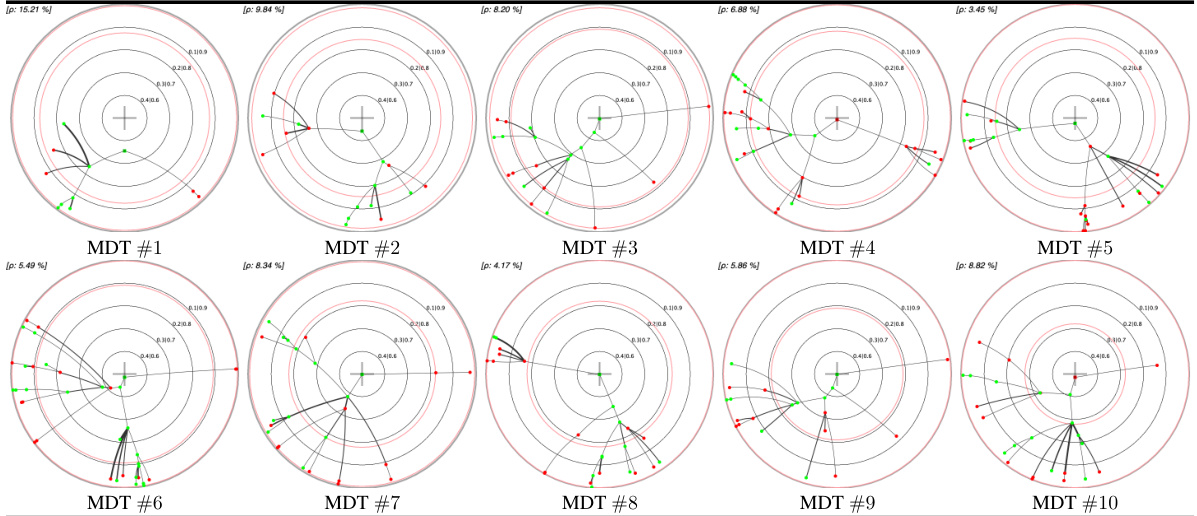
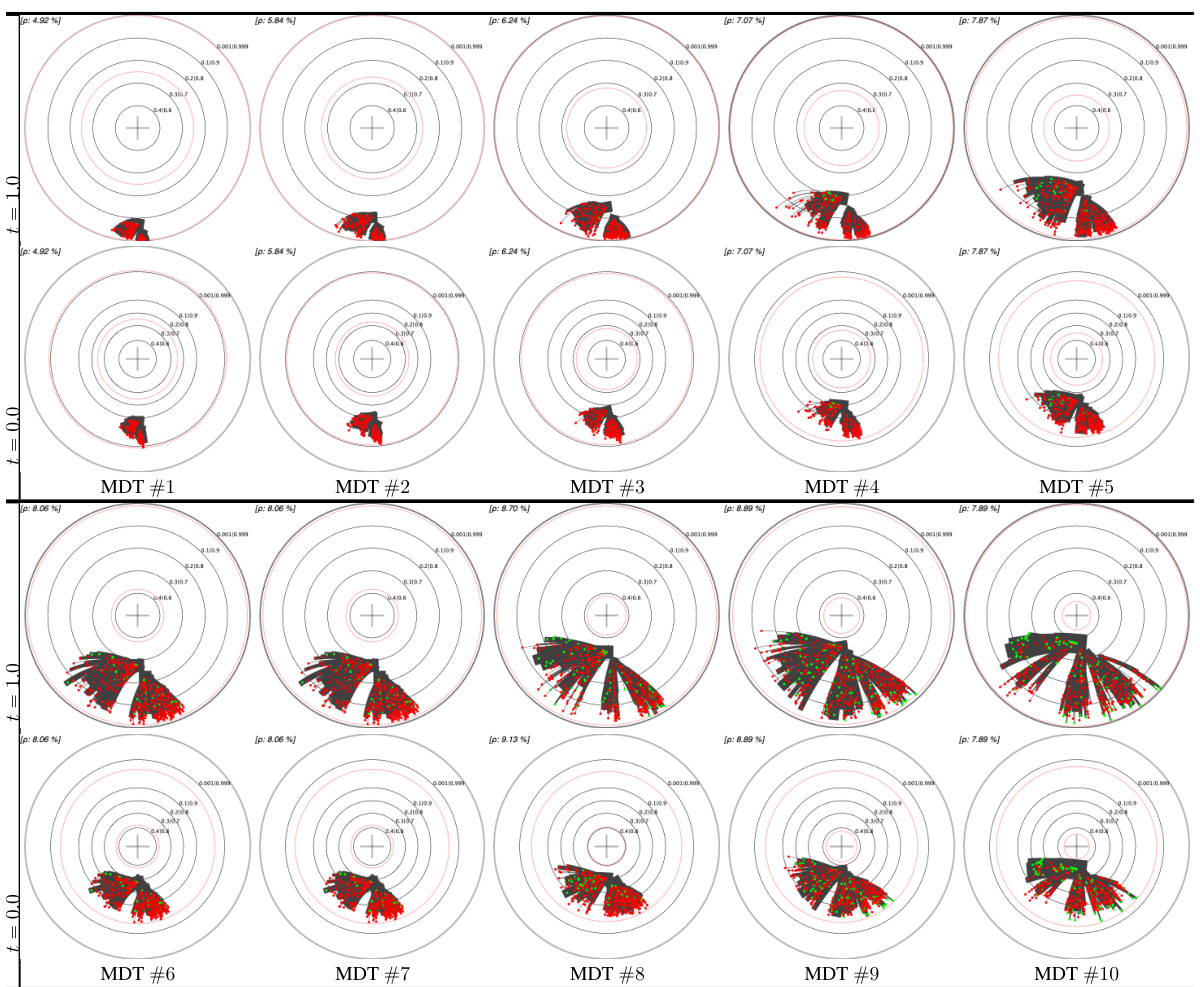
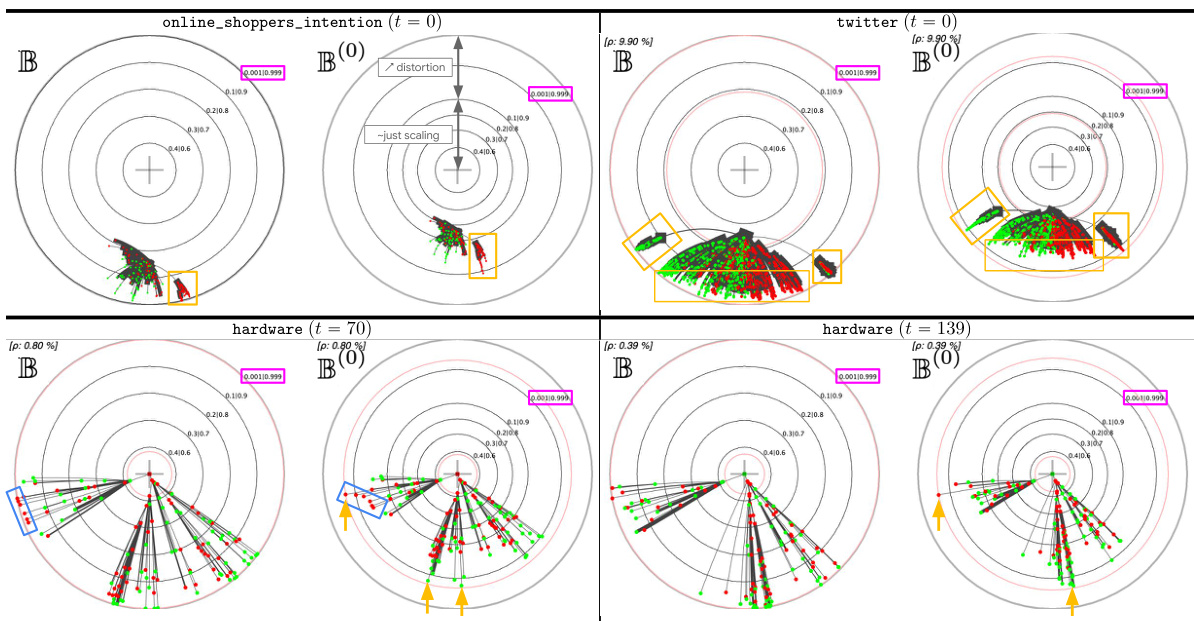
This table presents a comparison of different embedding methods for decision trees (DTs) and their monotonic counterparts (MDTs) on four UCI datasets. The left pane shows the Poincaré disk embeddings of MDTs at the 1st and 10th boosting iterations, highlighting visual differences between datasets. The right pane compares standard Poincaré disk embeddings with its t-self (t=0) variant for MDTs trained on the ‘online_shoppers_intention’ and ‘hardware’ datasets, illustrating the improved visualization near the disk’s border offered by the t-self.
In-depth insights#
Hyperbolic Embeddings#
Hyperbolic embeddings offer a compelling alternative to Euclidean embeddings, particularly when dealing with hierarchical or tree-like structures. Their inherent ability to capture hierarchical relationships with lower distortion is a key advantage, especially when modeling data exhibiting tree-like characteristics or possessing inherent hierarchies. However, the non-Euclidean nature of hyperbolic space presents challenges, especially in terms of computation and visualization. While methods for creating such embeddings exist, they often require careful consideration of computational efficiency and the potential for numerical instability near the boundary of the hyperbolic space. Effective visualizations are crucial for interpreting the results and understanding the embedded structure. Furthermore, the choice of the hyperbolic model (e.g., Poincaré disk, hyperboloid) needs careful consideration, influencing both computational aspects and the embedding’s geometrical properties. Finally, applications of hyperbolic embeddings are diverse, ranging from natural language processing to graph representation and recommendation systems, highlighting its versatility and potential.
Decision Tree Encoding#
Decision tree encoding in machine learning focuses on representing tree-structured models effectively within a chosen embedding space. A core challenge is capturing both the structural properties (hierarchical relationships) and numerical properties (e.g., confidence scores, classification performance) of the tree. Several methods exist, often relying on specific geometric spaces, such as hyperbolic geometry, to account for the tree’s hierarchical nature and potentially reduce distortion when mapping nodes to vectors. The choice of encoding influences both model interpretation and downstream tasks involving tree comparison or manipulation. Efficient encoding is crucial for handling large trees, while preserving semantic meaning remains paramount. Furthermore, the selection of an appropriate loss function plays a role in influencing the encoding process and its fidelity to the original tree’s predictive capabilities. Visualizations often accompany such encodings to facilitate understanding and comparison of different decision trees or ensembles.
Visualization Refinement#
Visualization refinement in research papers often focuses on improving the clarity, accuracy, and effectiveness of visual representations of data or models. Effective visualization is crucial for conveying complex information concisely and facilitating understanding. This refinement process may involve exploring different visualization techniques, optimizing visual parameters (e.g., color schemes, scales, layouts), enhancing interactive elements for data exploration, or improving the integration of visualizations within the overall narrative of the paper. A thoughtful approach considers the target audience and the specific message being conveyed. For instance, choosing between a 2D or 3D plot, or selecting appropriate chart types (bar charts, scatter plots, heatmaps, etc.) is driven by the nature of the data and the insights one wants to highlight. Furthermore, attention should be paid to potential limitations and biases that can be introduced by visual representations and strategies to address them, such as providing clear labels and legends, appropriately scaling axes, and using effective annotations to guide interpretation. Ultimately, successful visualization refinement results in figures and graphics that not only enhance the reader’s comprehension but also actively strengthen the overall argument and impact of the research.
Tempered Integration#
Tempered integration offers a generalization of classical Riemann integration by introducing a parameter, t, that modifies the addition operation within Riemann sums. This seemingly minor change yields profound consequences, smoothly altering the properties of the integral while maintaining hyperbolicity. Crucially, it generalizes the fundamental theorem of calculus, providing a smooth transition between classical and non-classical integration. This is particularly useful in contexts, like hyperbolic geometry, where standard integration proves problematic near boundaries; tempered integration allows for improved control and numerical stability in these critical regions, addressing the limitations of existing hyperbolic embedding techniques. The t-parameter acts as a tuning knob, enabling a flexible adjustment of the integral’s behavior to optimize visualization and encoding in applications involving hyperbolic spaces.
Future Research#
Future research directions stemming from this paper could explore extending the t-calculus framework to other distance metrics beyond Poincaré, potentially enhancing the versatility and applicability of the proposed hyperbolic embeddings. Investigating the impact of different t-values on model performance and interpretability would also be valuable, leading to better visualizations and insights. Furthermore, exploring the application of monotonic decision trees (MDTs) in various supervised learning tasks would provide more comprehensive insights into the utility of this novel model. Finally, a rigorous theoretical analysis comparing the performance of MDTs to traditional decision trees, along with a deeper exploration of the connections between the t-self and other hyperbolic models are warranted.
More visual insights#
More on figures

This figure shows an example of a decision tree (DT) and its embedding in the Poincaré disk. The left panel illustrates the limitations of a naive embedding approach, highlighting how distinct nodes can be mapped to the same location. The right panel introduces monotonic decision trees (MDTs), a modified tree structure that allows for a clean and unambiguous embedding. The MDT is derived from the original DT by selecting only the monotonically increasing confidence paths and is shown to be a good representation of the original DT, while enabling a more accurate and interpretable embedding.

The figure shows two examples of decision trees. The left pane shows a subtree of a decision tree and its embedding in a Poincaré disk. The right pane presents a small decision tree learned from data and its corresponding monotonic decision tree. The embedding of the decision tree is problematic, while the monotonic version offers a cleaner embedding suitable for visualization and interpretation.

This figure shows two examples of MDTs (Monotonic Decision Trees) learned from the UCI online_shoppers_intention dataset. The left panel illustrates key aspects of the MDT embedding in the Poincaré disk, highlighting the embedding error (ρ) and posterior isolines. The right panel provides annotations that are used and explained in section 6 of the paper, illustrating how the visualizations are interpreted and the information they convey about the models and their performance.

This figure shows a comparison between a regular decision tree and its monotonic version. The left panel shows that a naive embedding of a decision tree in the Poincaré disk can lead to ambiguous results, where different nodes or edges in the tree might be mapped to the same points in the Poincaré disk. The right panel illustrates how creating a monotonic decision tree by only keeping the monotonically increasing confidence predictions resolves this issue. A monotonic decision tree is a more faithful representation of the original decision tree in hyperbolic space.

The figure shows a comparison between a decision tree (DT) and its corresponding monotonic decision tree (MDT). The left panel illustrates how a naive embedding of a DT can lead to ambiguity, while the right panel demonstrates the unambiguous embedding of an MDT, highlighting the advantages of using MDTs for representing supervised models in hyperbolic space. Key differences between the DT and MDT representations are explained.

The figure shows a comparison between a regular decision tree and its monotonic version. The left panel illustrates how a standard decision tree embedding can be ambiguous, failing to faithfully represent the tree structure. The right panel demonstrates the improved, unambiguous embedding achieved using a monotonic decision tree, highlighting the benefits of this approach for visualization and interpretation.

The figure shows a comparison between a standard decision tree (DT) and its corresponding monotonic decision tree (MDT). The left pane illustrates a subtree of a DT and its embedding in the Poincaré disk, highlighting the inability to distinguish between certain nodes based on their embedding alone. The right pane presents a small DT learned on the UCI Abalone dataset and its MDT generated using the GETMDT algorithm. The MDT is designed to provide a clear and unambiguous embedding in the Poincaré disk, eliminating the ambiguities present in the original DT embedding.

This figure shows two examples of Monotonic Decision Trees (MDTs) and their embeddings in the Poincaré disk. The left panel highlights key aspects of the embedding, such as the mapping between the MDT structure and its representation in the Poincaré disk. The right panel provides annotations clarifying the visualization elements, illustrating how the embedding relates to features like posterior probabilities and the confidence of predictions. The embedding error (ρ) is also indicated, representing the difference between the model’s confidence and its hyperbolic distance from the origin. These visualizations are discussed further in Section 6 of the paper.
The figure shows a comparison between a standard decision tree (DT) and its corresponding monotonic decision tree (MDT). The left panel illustrates the problem of embedding a DT directly into the Poincaré disk, highlighting the ambiguity and loss of structural information. The right panel demonstrates the solution proposed by the authors: using MDTs to achieve a clean and unambiguous embedding. MDTs are a modified version of DTs that guarantee monotonically increasing confidence along any path from root to leaf, enabling clear visualization in hyperbolic space.
This figure shows a comparison between a decision tree (DT) and its corresponding monotonic decision tree (MDT). The left panel illustrates a subtree of a DT and its flawed embedding in the Poincaré disk, highlighting the ambiguity in representing nodes and arcs. The right panel demonstrates a small DT and its MDT generated using the GETMDT algorithm. The MDT provides a path-monotonic classification, resolving the ambiguity issues of the DT embedding while maintaining predictive accuracy.

This figure shows two examples of MDTs (Monotonic Decision Trees) learned from the UCI online_shoppers_intention dataset. The left panel displays key elements of the hyperbolic embedding in the Poincaré disk, illustrating the relationship between confidence (posterior probability) and distance from the origin. The right panel provides annotations to aid interpretation of the visualizations used in the experiments described in Section 6 of the paper.
This figure shows two examples of Monotonic Decision Trees (MDTs) and their embeddings in the Poincaré disk. The left panel shows a detailed view of the embedding, highlighting key features like the embedding error, posterior isolines, and leveraging coefficients. The right panel provides annotations to aid interpretation, referring to elements discussed in Section 6 of the paper, such as the relationship between node placement and prediction confidence, the use of color to represent class majority, and how arc thickness conveys the complexity of decision paths within the original decision tree.
This figure demonstrates the problem of embedding a decision tree (DT) directly into hyperbolic space. The left panel shows a DT subtree and its embedding, highlighting the ambiguity introduced by the direct mapping. The right panel showcases a monotonic decision tree (MDT), a modified version of the DT that provides a clearer and unambiguous embedding.

The figure shows a comparison between a regular decision tree and its monotonic version. The left panel illustrates the problem of ambiguous embedding of a decision tree in the Poincaré disk, where different nodes are mapped to the same location. The right panel introduces monotonic decision trees (MDTs) as a solution to this problem, showcasing how MDTs provide a clean and unambiguous embedding.
This figure shows two examples of MDTs (Monotonic Decision Trees) and their embeddings in the Poincaré disk. The left panel displays key aspects of the embedding, highlighting the relationship between model confidence and distance from the origin. The right panel provides annotations explaining various aspects of the visualization used in the experiments detailed in Section 6 of the paper.

The figure shows a comparison between a decision tree (DT) and its corresponding monotonic decision tree (MDT). The left panel illustrates a subtree of a DT and its flawed embedding in the Poincaré disk, highlighting the ambiguity of the representation. The right panel demonstrates a small DT and its MDT, illustrating how the MDT provides a path-monotonic classification and a cleaner, more interpretable embedding. The MDT achieves this by only including nodes with strictly increasing confidence along any path from root to leaf.
This figure shows a comparison between a regular decision tree (DT) and a monotonic decision tree (MDT). The left panel shows how a naive embedding of a DT in the Poincaré disk can result in indistinguishable nodes. The right panel demonstrates that the MDT, a modified version of the DT which ensures monotonicity of the path predictions, provides a clear and unambiguous representation in the Poincaré disk. The MDT simplifies the tree structure and removes nodes with non-monotonic predictions, making it suitable for embedding.
More on tables

This table presents the results of experiments comparing the classification accuracy of decision trees (DTs) and their corresponding monotonic decision trees (MDTs). It shows the average test error and standard deviation for both types of trees across various datasets. The p-value indicates the statistical significance of the difference in error rates between DTs and MDTs. Bold p-values highlight cases where the null hypothesis (no significant difference) is not rejected at the 0.05 significance level. This table helps to assess whether using MDTs instead of DTs for visualization and interpretation leads to significant loss of accuracy.

This table lists the datasets used in the experiments of the paper. It provides the name of each dataset, the number of examples (m), the number of features (d), and the license under which the data is available. The datasets are from UCI, OpenML, and Kaggle.
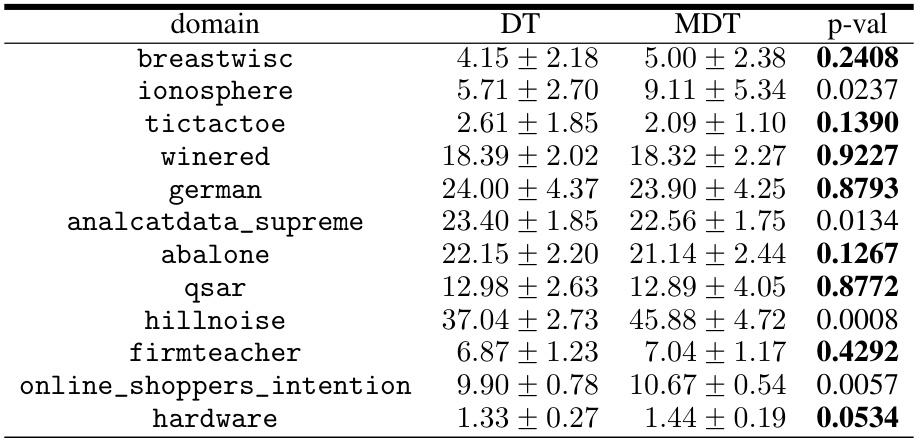
This table presents the results of experiments comparing the performance of decision trees (DTs) and their corresponding monotonic decision trees (MDTs) in terms of test error. The p-values indicate the statistical significance of the difference in test errors between DTs and MDTs for each dataset. Bold p-values indicate that the null hypothesis (no difference between DT and MDT performance) cannot be rejected at the 0.05 significance level.

This table presents a comparison of different embedding methods for decision trees in the Poincaré disk. The left side shows embeddings of MDTs (Monotonic Decision Trees) at different boosting iterations across four UCI datasets, highlighting the visual differences in embedding patterns across datasets. The right side compares standard Poincaré disk embeddings with its t-self (a modified version) for a specific MDT on two datasets, illustrating improvements in visualization and distinguishing high-confidence nodes near the boundary.
Full paper#


