↗ OpenReview ↗ NeurIPS Homepage ↗ Chat
TL;DR#
Traditional time series models often struggle with task diversity and data heterogeneity. Existing methods typically require separate models for different tasks (forecasting, classification, etc.), which is time-consuming and inefficient. Moreover, adapting these models to new, unseen data or tasks can be challenging, leading to suboptimal performance.
The researchers introduce UniTS, a unified multi-task model that addresses these challenges. UniTS employs task tokenization, which uses task specifications as tokens fed into the model, and a modified transformer to capture universal representations. This enables transfer learning and adaptability to various tasks and datasets. Results show that UniTS outperforms specialized models across 38 datasets, demonstrating its versatility and effectiveness.
Key Takeaways#
Why does it matter?#
This paper is crucial for researchers in time series analysis as it introduces UNITS, a unified multi-task model, significantly advancing the field by enabling better performance across diverse tasks with a single model. This reduces development time and complexity while improving adaptability to new domains and tasks. The few-shot and prompt learning capabilities demonstrated open exciting new avenues for research and practical applications.
Visual Insights#

The figure is a schematic illustration of the UniTS model, highlighting its ability to handle diverse time series tasks (forecasting, imputation, anomaly detection, and classification) across various domains (weather, ECG, etc.). It shows how UniTS processes heterogeneous time series data with varying numbers of variables and sequence lengths to provide a unified representation for different task types.

This table presents a comparison of the UniTS model’s performance against various baseline methods across four common time series tasks: forecasting, classification, anomaly detection, and imputation. Each model was trained independently on individual datasets, providing a clear assessment of the model’s single-task capabilities. Detailed results for each task are referenced in subsequent tables (30-33).
In-depth insights#
Unified Multi-Task#
The concept of a “Unified Multi-Task” model for time series is highly innovative, aiming to overcome the limitations of specialized models. Traditional approaches often excel in a single task (forecasting, classification, etc.) but struggle with others, requiring separate model development and training. A unified approach offers significant advantages by leveraging shared weights and representations across diverse tasks, leading to improved efficiency and potentially better performance through transfer learning. However, building such a model is challenging due to the heterogeneity of time series data, varying in length, sampling rates, and the number of variables. The success of a unified approach depends heavily on effective task encoding and architectural design to manage this complexity. A key aspect to explore would be the extent of performance gains compared to specialized models and the robustness of the unified model to new, unseen tasks and data domains. The ability to handle few-shot learning would further highlight the practicality and versatility of this innovative approach.
Task Tokenization#
The concept of ‘Task Tokenization’ presents a novel approach to multi-task learning in time series. Instead of designing separate model architectures for different tasks (forecasting, classification, etc.), this method encodes task specifications into tokens, which are then fed into a unified model architecture alongside the time series data. This allows the model to learn universal time series representations while simultaneously handling multiple tasks. The beauty of this approach lies in its flexibility and efficiency. By simply altering the task token, the same model can adapt to various tasks without requiring extensive retraining or architectural modifications. This is a significant advancement compared to traditional methods that often require task-specific modules, leading to increased complexity and reduced transferability. Task tokenization promotes the sharing of weights across different tasks, enhancing the model’s learning capabilities and generalizability to unseen data. It also paves the way for a more streamlined and adaptable approach to time series analysis where a single, unified model can perform multiple tasks effectively. The success of this method relies heavily on the design of the unified model architecture to handle the combined input of task tokens and time-series data.
Unified Architecture#
A unified architecture in a multi-task time series model is crucial for efficiently handling diverse tasks and data characteristics. It necessitates a design that can process heterogeneous data with varying lengths and numbers of variables without requiring task-specific modifications. Key aspects of such an architecture would include a universal task representation scheme (e.g., task tokens) to integrate different tasks within a single framework. This allows the model to learn shared representations across various time series tasks, improving both efficiency and transferability. The core architecture should also be flexible enough to adapt to different data modalities, potentially utilizing self-attention mechanisms to capture complex relationships between variables and time points. A unified architecture might employ shared weights or parameters across tasks, reducing the number of trainable parameters and promoting better generalization across multiple domains and datasets. Incorporating mechanisms to mitigate interference from heterogeneous data sources and varied task dynamics is also essential. Ultimately, a well-designed unified architecture should improve model performance and adaptability, streamlining the process of training and deploying multi-task time series models.
Prompt-Based Learning#
Prompt-based learning, in the context of time series analysis, presents a compelling paradigm shift. Instead of extensive fine-tuning or incorporating numerous task-specific modules, prompting leverages a pre-trained model’s existing knowledge to adapt to new tasks with minimal additional training. This approach is particularly attractive for time series data, which often exhibit diverse domains, temporal scales, and dynamic patterns. By carefully crafting prompts, the model can be guided to execute a broad range of operations, such as forecasting, classification, anomaly detection, and imputation, all using the same underlying weights. The efficiency and adaptability offered by prompt-based learning are crucial advantages over traditional, task-specific methods that require separate training and architectural modifications for each task. Furthermore, parameter-efficient prompting offers the ability to adapt the model to new tasks without the need for full fine-tuning, making this approach particularly suitable for resource-constrained environments. However, designing effective prompts remains a key challenge. The effectiveness of prompt-based learning hinges upon creating prompts that are both informative and unambiguous for the model to interpret correctly and lead to the desired output.
Future Directions#
Future research could explore expanding UNITS’ capabilities to handle even more diverse time series data, including those with complex patterns and irregular sampling intervals. Improving the model’s efficiency and scalability is another key area, perhaps by investigating more efficient architectures or employing techniques like model compression. Addressing the issue of interpretability would be valuable, enabling users to understand the model’s decision-making process and potentially trust its predictions. Furthermore, research could focus on extending UNITS to other time series tasks, including those beyond prediction and generation, such as causal inference or clustering. Exploring different pre-training strategies could also lead to improvements in performance and generalizability. Finally, thorough evaluations on various real-world applications will help establish UNITS’ potential impact across diverse domains and tasks.
More visual insights#
More on figures

This figure illustrates the UNITS model architecture and workflow for both generative (forecasting) and predictive (classification) tasks. Panel (a) shows how the input time series is tokenized, processed by the UNITS model, and then the GEN tokens are used to reconstruct the forecast. Panel (b) shows how the input time series is tokenized, processed by the UNITS model, and then a CLS token is used to compare against class embeddings for classification. Panel (c) provides a detailed overview of the UNITS architecture, highlighting the use of task tokens, multiple attention mechanisms, and separate GEN and CLS towers for handling different task types.

This figure compares the performance of UNITS and several baseline methods on a direct multi-step forecasting task using different forecast horizons. The x-axis represents the new forecasting length added to the original trained length, and the y-axis represents the Mean Squared Error (MSE) of the prediction. The figure demonstrates that UNITS significantly outperforms all baseline methods across various forecast lengths, showcasing its ability to handle multi-step forecasting effectively.

This figure shows three parts to explain the UNITS model. The first part (a) shows the forecasting task where input time series is tokenized, and GEN tokens are used for forecasting, which is unpatchified to infer the forecast horizon. The second part (b) shows the classification task where the CLS token represents the class information and compares it to class tokens to get the prediction. The third part (c) shows the overall architecture of the UNITS model with task tokens, sample tokens, and prompt tokens.

This figure shows three different aspects of the UniTS model. (a) illustrates the process of forecasting using tokenization and GEN tokens. (b) illustrates the classification process using CLS tokens. (c) provides a detailed architecture diagram of the UniTS model, showing its components and the flow of data.

The figure shows the architecture of the UniTS model, a unified multi-task time series model capable of handling a broad spectrum of time series tasks including forecasting, imputation, anomaly detection, and classification. It highlights the model’s ability to integrate predictive and generative tasks into a single framework using task tokenization. The figure also illustrates the diverse dynamic patterns, sampling rates, and temporal scales of the 38 datasets used for training, spanning human activity sensors, healthcare, engineering, and finance domains. The model is designed to process heterogeneous time series data with varying numbers of variables and sequence lengths without altering the network structure. The model achieves this through task tokenization, a unified time series architecture, and support for generative and predictive tasks.
The figure is a schematic illustration showing the unified multi-task time series model called UNITS. It takes as input time series data from diverse domains such as weather, ECG, and others. The model is designed to handle both predictive and generative tasks, including forecasting, imputation, anomaly detection, and classification. The figure highlights the model’s ability to adapt to different temporal scales, sampling rates, and data domains, while employing a shared-weight architecture to unify multiple tasks within a single framework.
This figure shows the UNITS model architecture and its working mechanism. (a) shows how UNITS handles forecasting tasks using GEN tokens to predict future values in the time series. (b) illustrates how UNITS performs classification tasks by comparing a CLS token representing the input with class tokens. (c) provides a comprehensive overview of the UNITS architecture, encompassing the task tokenization process, the unified time-series architecture for handling diverse data formats, and the unified GEN and CLS towers that process the tokens to generate the model’s final output.
This figure shows three parts: (a) the process of forecasting using UNITS model, (b) the process of classification using UNITS model, and (c) the overall architecture of the UNITS model. Part (a) illustrates the tokenization of input time series, the usage of GEN tokens to represent forecast horizon, and the generation of forecast values. Part (b) shows the tokenization of the input time series, the use of CLS token to represent the class label, and the comparison with class tokens to predict the class. Part (c) presents the model architecture, including the task tokenization, unified time series architecture, and the separate GEN and CLS towers for generative and predictive tasks.
More on tables

This table presents a comparison of UNITS’s performance against various existing models for four time series tasks: forecasting, classification, anomaly detection, and imputation. Each model is trained separately on each dataset, which allows for a direct comparison of performance on individual tasks and datasets. The full results for each task are detailed in Tables 30, 31, 32, and 33.

This table presents the results of a few-shot learning experiment on 9 forecasting and 6 classification tasks using out-of-domain datasets. Three different training data ratios (5%, 15%, and 20%) were tested for two models, iTransformer-FT and UniTS (both PMT and FT versions). The table shows the accuracy (Acc↑), Mean Squared Error (MSE↓), and Mean Absolute Error (MAE↓) for each model and data ratio. The ‘Best Count’ column indicates how many times each model achieved the best performance across all tasks for a given data ratio. The ‘Shared’ column shows whether the model uses shared weights (UniTS) or task-specific heads (iTransformer). This table demonstrates UniTS’s ability to perform well even with limited training data, surpassing iTransformer in most cases.

This table shows the results of few-shot learning experiments for block-wise imputation on six datasets. The models were fine-tuned using 25% and 50% of the training data for each dataset. The table compares the performance of UNITS-PMT and UNITS-FT (fully fine-tuned) against several baselines: TimesNet-FT, PatchTST-FT, and iTrans-FT. The metrics used are MSE for each dataset and the average MSE across all datasets.
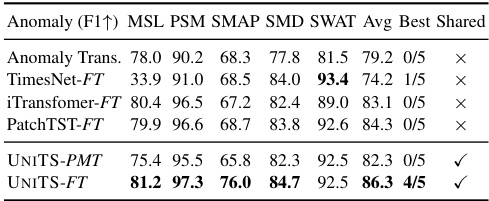
This table presents the results of a few-shot learning experiment on anomaly detection tasks using five different datasets. It compares the performance of several models, including UNITS-PMT (prompt-tuned) and UNITS-FT (fully fine-tuned), against various baselines. The performance is measured by the F1-score, and the results are broken down for each dataset to show the model’s performance on individual datasets. This experiment aims to evaluate the models’ ability to adapt to new tasks and datasets with limited training data.

This table compares several existing time series models against three key desiderata for a unified multi-task time series model: the ability to handle heterogeneous time series data, the use of a universal task specification, and the use of one shared model. A checkmark indicates that a model satisfies a desideratum, while an ‘X’ indicates it does not.

This table lists 38 datasets used in the paper for multi-task learning experiments on forecasting and classification. Each dataset is characterized by its name, the number of training samples, sequence length, number of variables, the type of task (forecasting or classification), and the number of classes for classification tasks or the prediction length for forecasting tasks. The datasets cover diverse domains, including finance, healthcare, and human activity.
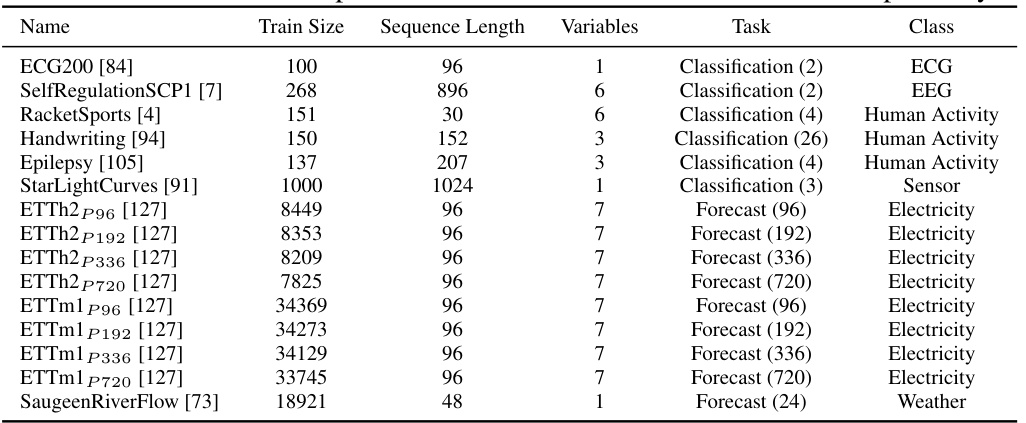
This table lists the 38 datasets used in the paper for multi-task learning experiments on forecasting and classification tasks. For each dataset, it provides the name, the number of training samples, the length of each time series sequence, the number of variables, the type of task (forecasting or classification), and the number of classes for classification tasks. The prediction length for forecasting tasks is also indicated in parentheses. The datasets encompass various domains such as finance, human activity, healthcare, and electricity, showcasing the model’s ability to handle heterogeneous data.

This table lists five datasets used for zero-shot forecasting experiments. It shows the name of the dataset, the sequence length of the time series, the number of variables, the type of task (forecasting), and the class or category of the dataset (Electricity, Weather, Healthcare, Web, Weather). The note indicates a limitation that only the first 500 variables are used in the Web Traffic and Temperature Rain datasets.

This table presents four datasets used for imputation tasks in the paper. Each dataset is characterized by its name, sequence length, number of variables, the imputation task itself, the mask ratio (representing the percentage of missing values), and the class or domain the data belongs to. The mask ratio is varied (12.5%, 25%, 37.5%, 50%) to evaluate performance under different levels of missing data.

This table lists the datasets used for anomaly detection experiments in the paper. It provides the dataset name, the sequence length used in the multi-task and single-task settings, the number of variables, the type of task (anomaly detection), and the specific class or domain of each dataset (Machine, Spacecraft, Infrastructure).

This table presents a comparison of the UNITS model’s performance against various baseline methods for four common time series tasks: forecasting, classification, anomaly detection, and imputation. Each model was trained separately on each individual dataset. The table highlights UNITS’s superior performance across all four tasks and provides references to tables containing the full results for each task.

This table lists various baseline methods used in the paper for comparison purposes across different time series tasks (forecasting, classification, imputation, and anomaly detection). Each task has a range of methods listed, categorized by their underlying architecture type (e.g., LLM-reprogrammed, transformer-based, etc.). This is crucial to allow readers to evaluate the performance of the proposed UNITS model against well-established and state-of-the-art techniques.

This table presents the results of an ablation study conducted to evaluate the impact of scaling the UniTS model on its prompt learning capabilities. It shows average performance across 20 forecasting tasks and 18 classification tasks for different model sizes (parameter counts). The goal is to demonstrate how increasing the model’s size affects its ability to leverage prompt learning for improved performance.

This table presents the results of an ablation study conducted to determine the optimal number of prompt tokens to use in the UniTS model. The study varied the number of prompt tokens (0, 5, and 10) and measured the impact on the average classification accuracy (AccAvg↑) and the average Mean Squared Error (MSEAvg↓) and Mean Absolute Error (MAEAvg↓) for forecasting tasks. The results show that increasing the number of prompt tokens from 5 to 10 led to a slight improvement in performance, suggesting that 10 prompt tokens is the optimal number to use.

This ablation study investigates the impact of using shared versus unshared prompt tokens within the UNITS network architecture. The results compare the average accuracy, mean squared error (MSE), and mean absolute error (MAE) across all tasks when using shared prompt tokens (one set of tokens used for all tasks) against unshared prompt tokens (separate tokens for each task). The goal is to determine if the efficiency and performance benefits of having prompt tokens outweigh the negative effects of sharing tokens between disparate tasks.

This table presents the ablation study on the unified masked reconstruction pre-training scheme of the UNITS model. It shows the average performance (accuracy for classification tasks, MSE and MAE for forecasting tasks) achieved under three different pre-training settings: 1) with both CLS token-based and prompt token-based reconstruction loss, 2) without CLS token-based reconstruction loss, and 3) without prompt token-based reconstruction loss. The results demonstrate the importance of both loss terms in achieving high performance in both classification and forecasting tasks.

This table presents a comparison of the UniTS model’s performance against various baseline methods for four distinct time series tasks: forecasting, classification, anomaly detection, and imputation. It highlights UniTS’s performance in single-task settings where each model is trained independently on a single dataset, demonstrating its competitive advantage across different tasks and datasets. The table shows key metrics such as MSE and MAE for forecasting and imputation, accuracy for classification, and F1-score for anomaly detection. Complete results for each task are available in Tables 30, 31, 32, and 33.

This table shows the performance of the UniTS model under different pre-training data sizes. It demonstrates how the model’s accuracy in classification and mean squared error/mean absolute error in forecasting tasks improve with larger pre-training datasets. The table uses metrics like Acc Avg↑ (Cls.), MSE Avg↓ (Fore.), and MAE Avg↓ (Fore.) to represent the classification accuracy and forecasting error metrics.

This table presents the results of a multi-task benchmarking experiment comparing the performance of the proposed model (UNITS) against other state-of-the-art methods on 38 datasets encompassing 20 forecasting and 18 classification tasks. The table highlights UNITS’s ability to handle multiple tasks using a single unified model, in contrast to baselines requiring task-specific components. The results show UNITS’s superior performance across a range of forecasting lengths and dataset complexities.

This table presents the results of a cross-domain pre-training experiment conducted on the UniTS model. The experiment evaluated the model’s performance on forecasting tasks (using MSE and MAE metrics) across four datasets from both weather and traffic domains. It compares the performance when the model is pre-trained exclusively on weather data, on traffic data, and when it is trained jointly on both. The goal is to assess how the choice of pre-training data affects the model’s ability to generalize across different domains.

This ablation study evaluates the impact of removing either the Time MHSA or the Variable MHSA from the UNITS architecture. The results show a decrease in performance (Accuracy, MSE, and MAE) when either component is removed, highlighting their importance in the model’s effectiveness.

This table presents the ablation study on replacing the Dynamic FFN layer in the UNITS network with a standard MLP layer or removing it entirely. It compares the average accuracy (Acc_Avg), Mean Squared Error (MSE_Avg), and Mean Absolute Error (MAE_Avg) across various tasks for the three model configurations: the original UNITS-SUP model with Dynamic FFN, a model replacing Dynamic FFN with MLP, and a model without Dynamic FFN. The results demonstrate the importance of the Dynamic FFN for improved performance.

This table presents the results of multi-task benchmarking experiments using the proposed UNITS model, comparing its performance with other state-of-the-art methods. The table shows the performance across 20 forecasting tasks and 18 classification tasks, using two variations of the UNITS model (UNITS-SUP and UNITS-PMT). It also includes a comparison to GPT4TS, a method that repurposes a pre-trained large language model for time series tasks. Note that GPT4TS is excluded from the ‘best count’ comparison because it uses dataset/task-specific modules, making it not directly comparable to the unified UNITS model.

This table compares the performance of the proposed UniTS model against the LLMTime baseline on five different zero-shot forecasting tasks. Each task uses a different dataset with varying numbers of variables and forecasting lengths, none of which were seen during the model’s training. The results showcase UniTS’s ability to generalize and perform well in zero-shot scenarios, as it achieves lower Mean Squared Error (MSE) and faster inference times than LLMTime on most tasks.

This table presents the results of a multi-task benchmarking experiment comparing the performance of UNITS-SUP and UNITS-PMT models against other state-of-the-art models on 38 tasks which includes 20 forecasting tasks and 18 classification tasks. The table shows that both UNITS models effectively handle all 38 tasks using a single model architecture, and the performance of the UNITS models surpasses that of other existing methods on most tasks. It highlights the performance gains achieved by using a unified model for both generative (forecasting) and predictive (classification) tasks.

This table presents the results of a multi-task benchmarking experiment comparing the performance of UNITS (both supervised and prompt-tuned versions) against several other state-of-the-art time series models across 20 forecasting and 18 classification tasks. The results are summarized showing the number of times each model achieved the best performance (best count) for each task, and the overall average performance across all tasks. It highlights UNITS’s ability to handle multiple diverse tasks with a single model, contrasting with GPT4TS that uses a pre-trained LLM and additional task-specific modules.

This table presents a comparison of the UniTS model’s performance against various baseline methods across four different time series tasks: forecasting, classification, anomaly detection, and imputation. Each model is trained individually on each dataset. The table provides a summary of results, with full details available in other tables referenced within the paper.

This table presents a comparison of UNITS’s single-task performance against various baseline models for four time series tasks: forecasting, classification, anomaly detection, and imputation. Each model was trained and evaluated separately on each dataset. The full results for each task are detailed in Tables 30, 31, 32 and 33, respectively.

This table presents a comparison of the UniTS model’s performance against various state-of-the-art time series models on four common tasks: forecasting, classification, anomaly detection, and imputation. Each model is trained independently on each dataset, providing a comprehensive evaluation of UniTS’s capabilities in a single-task setting. Detailed results are further presented in Tables 30, 31, 32, and 33.
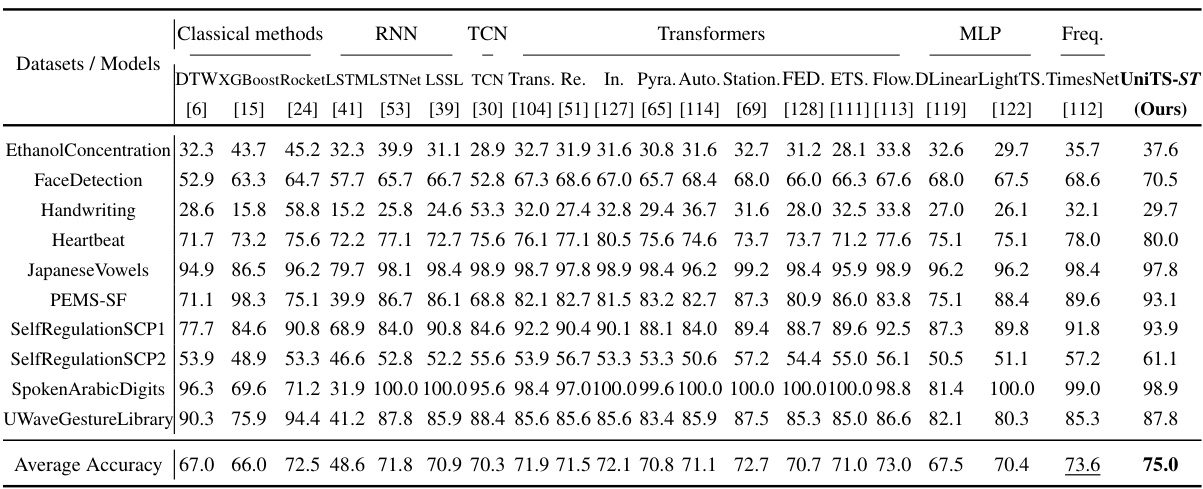
This table presents a comparison of the UniTS model’s performance against various existing time series models across four common time series tasks (forecasting, classification, anomaly detection, and imputation). Each model is trained individually for each dataset. The table shows metrics (e.g., MSE, MAE, Accuracy, F1) indicating performance on a selection of datasets. Detailed results for each task are available in tables 30, 31, 32 and 33 in the paper.
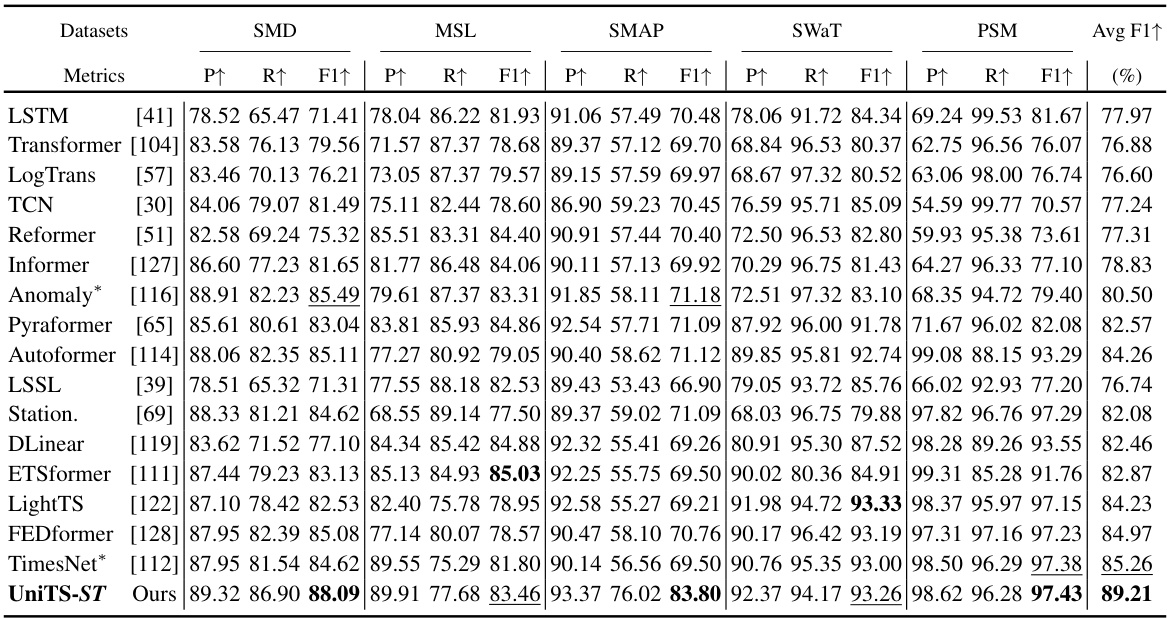
This table presents a comparison of the UNITS model’s performance against 12 forecasting models, 20 classification models, 18 anomaly detection models, and 16 imputation models on 38 datasets. Each model was trained individually for each dataset (single-task setting). The table shows results for each task type, highlighting the superior performance of UNITS across various metrics.

This table presents a comparison of the UNITS model’s performance against 12 forecasting methods, 20 classification models, 18 anomaly detection models, and 16 imputation models across 38 datasets. Each model is trained individually for each task and dataset (single-task setting). The table highlights the superior performance of UNITS compared to state-of-the-art methods in each task.

This table presents a comparison of the UniTS model’s performance against other state-of-the-art models for four distinct time series tasks: forecasting, classification, anomaly detection, and imputation. Crucially, each model in this comparison was trained on a single task and dataset, ensuring a fair comparison with the UniTS model, which also was trained under the same single task condition. The full results for each task can be found in other tables referenced in the caption.

This table compares the performance of the UniTS model trained using multi-task learning versus single-task learning. The comparison uses the same hyperparameters for both training methods. The results show that multi-task learning leads to significantly better performance on both classification and forecasting tasks, highlighting the effectiveness of the multi-task approach.
Full paper#


