TL;DR#
Robust reinforcement learning (RL) aims to create agents that perform well even in unpredictable environments. However, traditional robust RL methods often rely on simplifying assumptions, such as the independence of disturbances across different states and actions. This leads to overly cautious policies that might underperform in real-world settings. Furthermore, most existing methods do not consider time dependencies in environmental changes, making them less effective in dynamic scenarios.
This paper introduces a new approach called Time-Constrained Robust Markov Decision Processes (TC-RMDPs). TC-RMDPs explicitly model correlated, time-dependent disturbances, leading to more realistic representations of real-world problems. The authors propose three algorithms to solve TC-RMDPs, demonstrating an efficient trade-off between performance and robustness. These algorithms were rigorously evaluated on various continuous control tasks, showcasing significant improvements over existing robust RL methods, particularly in time-constrained scenarios. This work significantly advances the field of robust RL, offering a more practical and effective framework for deploying RL in real-world applications.
Key Takeaways#
Why does it matter?#
This paper is crucial for robust reinforcement learning researchers because it challenges the prevailing assumptions, offers new theoretical perspectives, and presents effective algorithms for handling real-world uncertainties. Its focus on time-constrained environments and correlated disturbances makes it highly relevant to current research trends, opening new avenues for developing more practical and realistic RL applications.
Visual Insights#

🔼 This figure illustrates the training process of a Time-Constrained Robust Markov Decision Process (TC-RMDP). It shows how an agent interacts with an environment, which is influenced by an adversary. The adversary introduces time-dependent disturbances, represented by the parameter ψ. The agent aims to learn a policy that performs well despite these disturbances. The figure highlights two variations in how the agent can observe information: one scenario with oracle access to ψ (the orange arrow), and another where the agent utilizes information from previous time steps (the blue arrow) to estimate the current ψ. The interaction involves the agent choosing an action (at), the environment updating based on that action and the adversary’s influence, producing a new state (St+1) and parameter (ψt+1), and the whole loop continues.
read the caption
Figure 1: TC-RMDP training involves a temporally-constrained adversary aiming to maximize the effect of temporally-coupled perturbations. Conversely, the agent aims to optimize its performance against this time-constrained adversary. In orange, the oracle observation, and in blue the stacked observation.

🔼 This table presents the average normalized performance of different algorithms across multiple MuJoCo environments under time-constrained worst-case scenarios. The results are averaged over 10 random seeds. The normalization uses TD3’s performance as a baseline and M2TD3’s improvement over TD3 as a scaling factor. This allows for a more standardized comparison across different environments and algorithms, highlighting improvements in robustness and efficiency. The table compares Oracle, Stacked, and Vanilla TC versions of both RARL and M2TD3, along with several baselines including TD3, DR, M2TD3, and RARL. Each entry represents the average normalized performance and its standard deviation.
read the caption
Table 1: Avg. of normalized time-coupled worst-case performance over 10 seeds for each method
In-depth insights#
TC-RMDP Framework#
The TC-RMDP framework offers a novel approach to robust reinforcement learning by addressing limitations of traditional methods. It moves beyond the restrictive rectangularity assumption, which often leads to overly conservative policies in real-world scenarios with complex uncertainties. Instead, TC-RMDP incorporates multifactorial, correlated, and time-dependent disturbances, creating a more realistic model of environmental dynamics. This framework introduces time constraints on the adversary’s actions, limiting the rate of environmental changes and thus improving the practicality and robustness of the learned policies. The key advantage lies in its ability to generate efficient and robust policies, especially effective in time-constrained environments, outperforming traditional deep RL methods. The framework, therefore, offers valuable insights for developing more realistic and applicable RL systems in various real-world applications.
Robust RL Algorithms#
Robust Reinforcement Learning (RL) algorithms aim to create agents that can perform well in unpredictable environments. Traditional RL methods often struggle when faced with uncertainty in the environment’s dynamics or reward structure. Robust RL addresses this by explicitly considering uncertainty. Several approaches exist, including those that optimize for worst-case scenarios (min-max optimization), those that use uncertainty sets to model the range of possible environments, and those that incorporate risk aversion into the reward function. Key challenges in robust RL involve computational cost and the trade-off between robustness and performance. Highly robust policies may be overly conservative, failing to capitalize on opportunities when the environment is less adversarial. Recent research explores more sophisticated methods of handling uncertainty, such as using distributionally robust optimization or learning robust representations of the environment. The field is rapidly evolving, with new algorithms and theoretical frameworks continually being developed to improve the efficiency and effectiveness of robust RL agents in real-world applications.
MuJoCo Experiments#
In a hypothetical ‘MuJoCo Experiments’ section, I would expect a detailed account of the experimental setup and results using the MuJoCo physics engine. This would likely involve specifying the control tasks used (e.g., locomotion tasks like walking, running, jumping), the robotic agents (their morphology and actuation), and the specific environments they operate in (terrain types, obstacles). Crucially, the metrics employed for evaluating performance (e.g., success rate, speed, energy efficiency) should be clearly defined. Robustness evaluation against various forms of environmental uncertainty (e.g., noise in sensors, changes in terrain) would be a central focus, demonstrating the effectiveness of the proposed time-constrained robust MDP framework. The results would likely present quantitative comparisons against baseline algorithms (conventional robust RL methods and possibly others), showing improvements in both performance and robustness, ideally with statistical significance. Detailed visualizations of agent behavior and key metrics across different scenarios would enhance understanding. The analysis should discuss the trade-off between performance and robustness achieved, offering explanations of why and how the framework excels in different conditions. Finally, limitations of the MuJoCo simulation and their implications on the generalizability of the results would need to be addressed.
Theoretical Guarantees#
The section on theoretical guarantees would ideally delve into the convergence properties of the proposed algorithms. For instance, it should rigorously establish conditions under which the algorithms converge to an optimal or near-optimal solution. Bounds on the convergence rate would be particularly valuable, providing insights into the algorithm’s efficiency. Crucially, the analysis should address the impact of the time-constrained and non-rectangular uncertainty settings on the theoretical guarantees, demonstrating their robustness compared to traditional approaches. Proofs of convergence or any other relevant theoretical results should be included, or at least, detailed references to supporting materials should be provided. The analysis should explicitly address the assumptions made, and their potential limitations, clarifying under what circumstances the theoretical guarantees hold and when they might not. Finally, comparisons with the theoretical guarantees of existing robust reinforcement learning methods would enrich the analysis and establish the novelty and practical benefits of the proposed framework.
Limitations & Future#
The research, while innovative in addressing time-constrained robust Markov decision processes (MDPs), presents some limitations. Rectangularity assumptions are relaxed, but not entirely removed; the parameter vector linking outcome probabilities still introduces dependency assumptions. The algorithms’ performance is evaluated in simulated environments, and real-world applicability requires further investigation. The Oracle-TC algorithm, while providing the best performance, relies on perfect information—an unrealistic scenario in most real-world applications. Future work should focus on developing more sophisticated methods to handle partial observability, potentially exploring techniques from partially observable Markov decision processes (POMDPs). Addressing scalability issues for high-dimensional state and action spaces will be crucial for broader real-world application. Investigating the sensitivity of results to the choice of Lipschitz constant L and exploring alternative parameterization strategies would further refine the framework. Finally, extensive empirical evaluations across diverse, real-world applications are needed to solidify the claim of enhanced robustness and efficiency beyond simulated benchmarks.
More visual insights#
More on figures

🔼 This figure illustrates the training process of a Time-Constrained Robust Markov Decision Process (TC-RMDP). It shows a two-player zero-sum game where an agent interacts with an environment and an adversary (representing the uncertain dynamics). The adversary’s actions are constrained over time. The agent seeks to optimize its performance against the adversary’s worst-case actions by learning a policy. The figure highlights two scenarios: one where the agent has access to full information from the environment (oracle observation) and another where the agent’s observation is limited to past states and actions (stacked observation).
read the caption
Figure 1: TC-RMDP training involves a temporally-constrained adversary aiming to maximize the effect of temporally-coupled perturbations. Conversely, the agent aims to optimize its performance against this time-constrained adversary. In orange, the oracle observation, and in blue the stacked observation.

🔼 This figure shows the performance comparison of different robust reinforcement learning algorithms against a random fixed adversary in various continuous control environments from MuJoCo simulator. The random fixed adversary introduces stochasticity by randomly selecting parameters within a radius of L=0.1 at each time step. The figure demonstrates that algorithms trained with the time-constrained robust Markov decision process (TC-RMDP) framework consistently outperform those trained with standard methods, highlighting their adaptability to unpredictable conditions.
read the caption
Figure 2: Evaluation against a random fixed adversary, with a radius L = 0.1

🔼 This figure illustrates the training process of a Time-Constrained Robust Markov Decision Process (TC-RMDP). It shows the interaction between an agent, an adversary (representing environmental uncertainties), and the environment. The agent aims to learn an optimal policy, while the adversary attempts to maximize the negative impact of time-correlated disturbances. The figure highlights two types of observations available to the agent: an oracle observation (orange) with complete information about the time-varying parameters and a stacked observation (blue) incorporating past states and actions to infer the parameters.
read the caption
Figure 1: TC-RMDP training involves a temporally-constrained adversary aiming to maximize the effect of temporally-coupled perturbations. Conversely, the agent aims to optimize its performance against this time-constrained adversary. In orange, the oracle observation, and in blue the stacked observation.

🔼 This figure illustrates the training process of the Time-Constrained Robust Markov Decision Process (TC-RMDP). It shows the interaction between the agent, the adversary (representing environmental disturbances), and the environment. The agent tries to learn an optimal policy, while the adversary, subject to temporal constraints, attempts to create the worst possible disturbances. The figure highlights two variants: one where the agent has access to the true parameters (oracle observation), and another where the agent relies on previous state and action information (stacked observation).
read the caption
Figure 1: TC-RMDP training involves a temporally-constrained adversary aiming to maximize the effect of temporally-coupled perturbations. Conversely, the agent aims to optimize its performance against this time-constrained adversary. In orange, the oracle observation, and in blue the stacked observation.

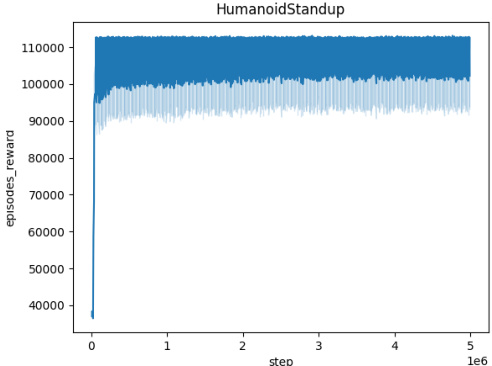
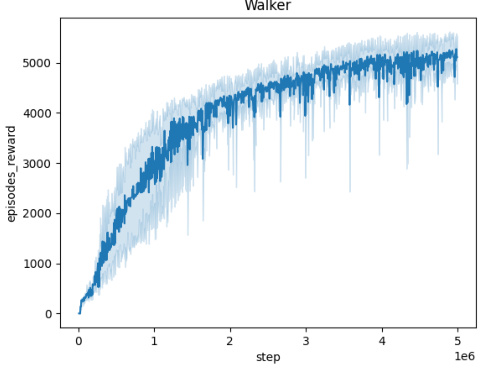
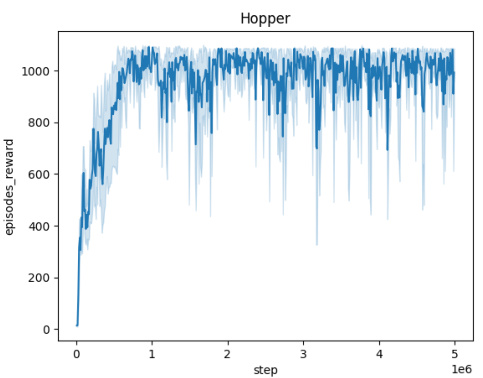
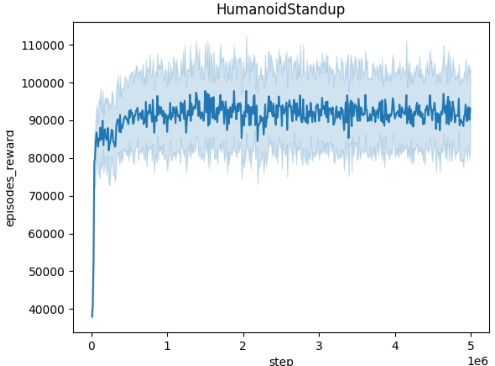
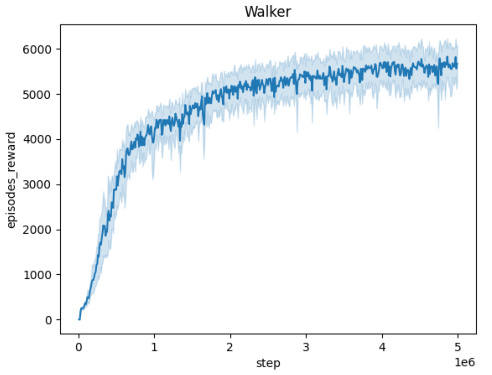
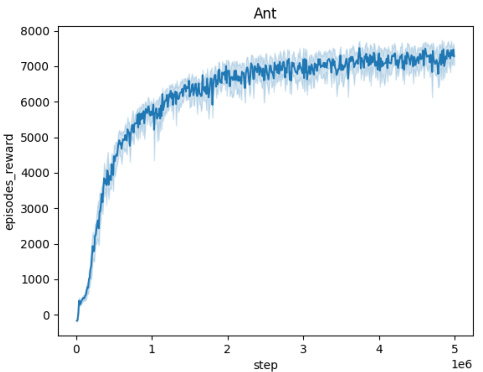
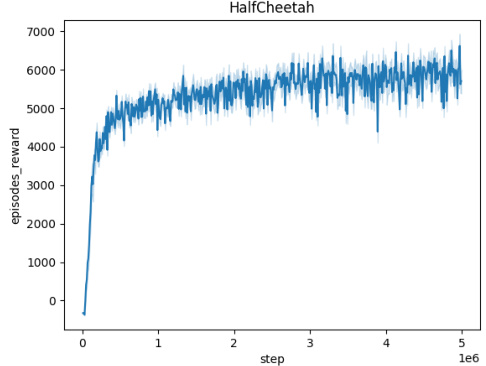
🔼 The figure shows the averaged training curves for the Domain Randomization method across five different MuJoCo environments (Ant, HalfCheetah, Hopper, HumanoidStandup, Walker) over 10 independent seeds. Each curve represents the mean episodic reward obtained during training. The x-axis represents the number of training steps, and the y-axis represents the mean episodic reward. The figure illustrates the learning progress and convergence behavior of the Domain Randomization method in each environment.
read the caption
Figure 5: Averaged training curves for the Domain Randomization method over 10 seeds

🔼 This figure presents the training curves for the Domain Randomization method across five different MuJoCo environments (Ant, HalfCheetah, Hopper, HumanoidStandup, Walker). Each curve represents the average performance over 10 independent training runs, showing the mean episodic reward over 5 million training steps. This visualization helps to understand the convergence behavior of the Domain Randomization approach in various continuous control tasks.
read the caption
Figure 5: Averaged training curves for the Domain Randomization method over 10 seeds

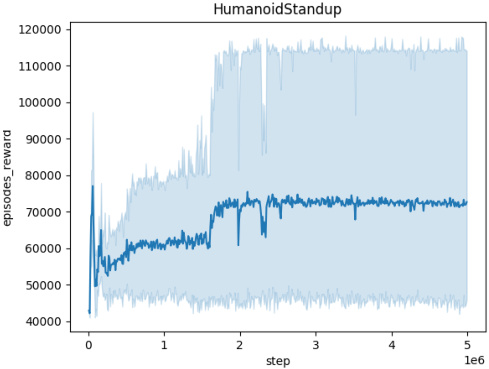
🔼 The figure shows the episodic reward (averaged over 10 random seeds) of the trained agent while the adversary is also being trained, across five different MuJoCo environments (Ant, HalfCheetah, Hopper, HumanoidStandup, Walker). Each environment’s plot shows how the agent’s reward evolves over 5 million timesteps during the adversary’s training. A small perturbation radius (L=0.001) is used for the adversary in all cases. The plots demonstrate the convergence of the agents and adversaries, indicating that the training is effective, even in the face of adversarial perturbations. The relative performance of different algorithms in each environment can be compared, providing valuable insight into their robustness and effectiveness in various scenarios.
read the caption
Figure 4: Episodic reward of the trained agent during the training of the adversary across different environments. Each plot represents the performance over 5 million timesteps, with rewards averaged across 10 seeds. The perturbation radius is set to L = 0.001 for all adversaries.

🔼 This figure shows the training curves for the Domain Randomization method across five different MuJoCo environments: Ant, HalfCheetah, Hopper, HumanoidStandup, and Walker. Each curve represents the average episodic reward over 10 independent runs. The x-axis shows the training steps, and the y-axis represents the mean episodic reward. The figure helps visualize the learning process of the Domain Randomization method in different environments, showing how the average episodic reward evolves over time for each environment.
read the caption
Figure 5: Averaged training curves for the Domain Randomization method over 10 seeds

🔼 This figure illustrates the training process of a Time-Constrained Robust Markov Decision Process (TC-RMDP). The TC-RMDP framework is presented as a two-player zero-sum game where an agent interacts with an environment and an adversary (representing uncertainty) which modifies MDP parameters over time. The agent aims to learn an optimal policy despite this uncertainty, while the adversary aims to maximize the negative impact of the uncertainty on the agent’s performance. The diagram shows the interaction between the agent, adversary, and environment, highlighting the flow of information (state, action, reward, and parameter updates). The orange highlights the information available in the Oracle-TC algorithm, while the blue highlights the information used in the Stacked-TC algorithm.
read the caption
Figure 1: TC-RMDP training involves a temporally-constrained adversary aiming to maximize the effect of temporally-coupled perturbations. Conversely, the agent aims to optimize its performance against this time-constrained adversary. In orange, the oracle observation, and in blue the stacked observation.

🔼 This figure illustrates the training process of a Time-Constrained Robust Markov Decision Process (TC-RMDP). It shows the interaction between an agent and an adversary in a two-player zero-sum game. The adversary represents the environment’s uncertainty and attempts to maximize the negative impact of disturbances, which are temporally correlated and constrained. The agent’s goal is to learn a policy that achieves optimal performance despite these adversarial actions. The figure highlights two variations in how the agent can observe the state information: an ‘oracle’ version with full information, and a ‘stacked’ version incorporating past actions and states. This helps explain the different algorithmic variants proposed in the paper for solving this type of problem.
read the caption
Figure 1: TC-RMDP training involves a temporally-constrained adversary aiming to maximize the effect of temporally-coupled perturbations. Conversely, the agent aims to optimize its performance against this time-constrained adversary. In orange, the oracle observation, and in blue the stacked observation.
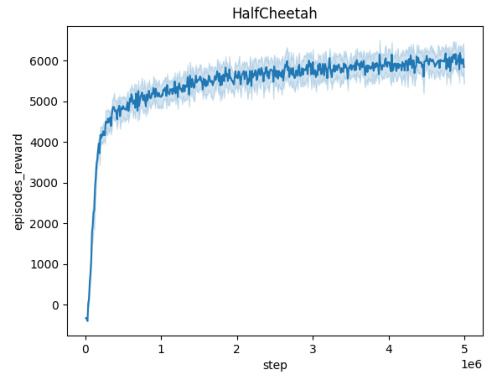
🔼 This figure presents the training curves for the Domain Randomization method across five different MuJoCo environments: Ant, HalfCheetah, Hopper, HumanoidStandup, and Walker. Each curve represents the average episodic reward over 10 independent runs, showing the learning progress over 5 million steps. The shaded regions indicate the standard deviation, illustrating the variability in performance across different seeds. The figure helps to visualize the learning process and the convergence behavior of the Domain Randomization approach in various continuous control tasks.
read the caption
Figure 5: Averaged training curves for the Domain Randomization method over 10 seeds

🔼 The figure shows the training curves for the Domain Randomization method across five different MuJoCo environments (Ant, HalfCheetah, Hopper, HumanoidStandup, Walker). Each curve represents the average episodic reward over 10 independent training runs, plotted against the number of training steps. The shaded region around each curve indicates the standard deviation, representing the variability in performance across the different runs. The plot provides a visual representation of the learning progress and stability of the Domain Randomization method in these continuous control tasks.
read the caption
Figure 5: Averaged training curves for the Domain Randomization method over 10 seeds
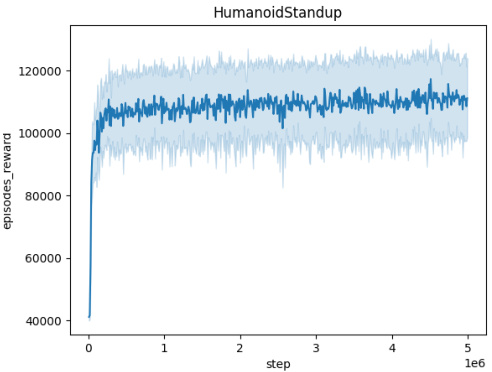
🔼 This figure illustrates the training process of a Time-Constrained Robust Markov Decision Process (TC-RMDP). It shows how an agent interacts with an environment and an adversary. The adversary introduces temporally-coupled perturbations, while the agent tries to learn an optimal policy that performs well even with these disturbances. The figure highlights two different observation types: an oracle observation (orange) providing full information, and a stacked observation (blue) which includes past states and actions to estimate the current uncertain parameters.
read the caption
Figure 1: TC-RMDP training involves a temporally-constrained adversary aiming to maximize the effect of temporally-coupled perturbations. Conversely, the agent aims to optimize its performance against this time-constrained adversary. In orange, the oracle observation, and in blue the stacked observation.

🔼 This figure displays the averaged training curves for the Domain Randomization method across five different MuJoCo environments: Ant, HalfCheetah, Hopper, HumanoidStandup, and Walker. Each curve represents the episodic reward obtained over 5 million timesteps, averaged across 10 independent runs, demonstrating the learning progress of the algorithm in these environments. The shaded area around each curve indicates the standard deviation, providing a measure of the variability in performance. The x-axis shows the number of training steps and the y-axis the averaged episodic reward.
read the caption
Figure 5: Averaged training curves for the Domain Randomization method over 10 seeds

🔼 This figure shows the training curves for the Domain Randomization method across five different MuJoCo environments (Ant, HalfCheetah, Hopper, HumanoidStandup, and Walker). Each curve represents the average episodic reward over 10 independent training runs. The x-axis represents the number of training steps (up to 5 million), and the y-axis shows the average episodic reward. The shaded area around each line indicates the standard deviation across the 10 runs. The figure visually demonstrates the learning progress of the Domain Randomization method in each environment, illustrating the convergence (or lack thereof) of the reward over time.
read the caption
Figure 5: Averaged training curves for the Domain Randomization method over 10 seeds
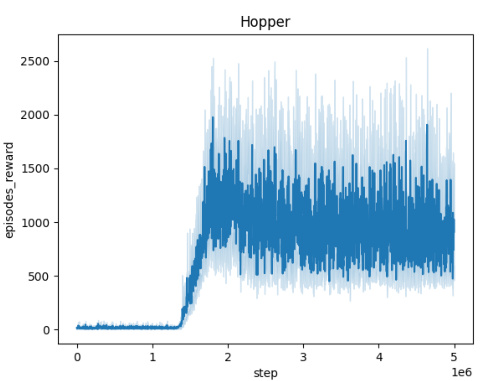
🔼 This figure shows the training curves for the Domain Randomization method across five different MuJoCo environments: Ant, HalfCheetah, Hopper, HumanoidStandup, and Walker. Each curve represents the average episodic reward over 10 independent runs, plotted against the number of training steps. The shaded area around each curve indicates the standard deviation. This figure demonstrates the learning progress of the Domain Randomization method in each environment and provides insights into its convergence behavior and performance variability across multiple trials.
read the caption
Figure 5: Averaged training curves for the Domain Randomization method over 10 seeds

🔼 This figure shows the training curves for the Domain Randomization method across five different MuJoCo environments (Ant, HalfCheetah, Hopper, HumanoidStandup, and Walker). Each curve represents the average episodic reward over 10 independent training runs. The x-axis shows the number of training steps, and the y-axis shows the average episodic reward. The shaded areas around the curves represent the standard deviation across the 10 runs. The figure illustrates the learning process and performance variability for each environment using Domain Randomization.
read the caption
Figure 5: Averaged training curves for the Domain Randomization method over 10 seeds
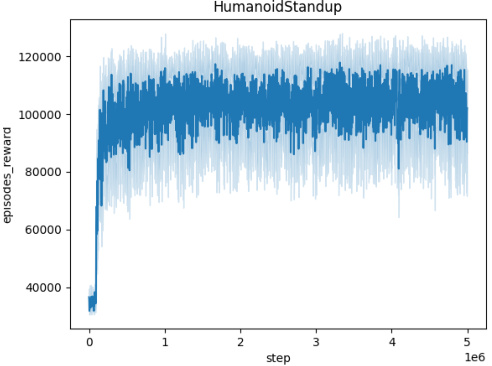
🔼 This figure illustrates the training process of a Time-Constrained Robust Markov Decision Process (TC-RMDP). It shows the interaction between an agent, an adversary (representing environmental uncertainties), and the environment. The agent aims to learn an optimal policy while the adversary tries to maximize the negative impact of time-dependent, correlated disturbances. The diagram highlights two variations in how the agent receives information: the oracle version (orange) directly observes the environmental parameter, while the stacked version (blue) uses past state and action information to infer it.
read the caption
Figure 1: TC-RMDP training involves a temporally-constrained adversary aiming to maximize the effect of temporally-coupled perturbations. Conversely, the agent aims to optimize its performance against this time-constrained adversary. In orange, the oracle observation, and in blue the stacked observation.

🔼 This figure shows the training curves for the Domain Randomization method across five different MuJoCo environments: Ant, HalfCheetah, Hopper, HumanoidStandup, and Walker. Each curve represents the average episodic reward over 10 independent training runs. The x-axis represents the number of training steps, while the y-axis represents the average episodic reward. The shaded area around each curve indicates the standard deviation across the 10 runs, providing a visual representation of the variability in performance. This visualization helps illustrate the convergence behavior and performance stability of the Domain Randomization method in these continuous control environments.
read the caption
Figure 5: Averaged training curves for the Domain Randomization method over 10 seeds

🔼 This figure illustrates the training loop of a Time-Constrained Robust Markov Decision Process (TC-RMDP). It shows an agent interacting with an environment, while an adversary (representing uncertainty in the environment) attempts to maximize the negative impact of its actions (temporally-coupled perturbations). The agent tries to learn an optimal policy despite this adversarial influence. The figure highlights two variations in agent observation: an oracle version with full knowledge of the adversary’s actions (orange) and a stacked version using past states and actions as proxies for the full information (blue).
read the caption
Figure 1: TC-RMDP training involves a temporally-constrained adversary aiming to maximize the effect of temporally-coupled perturbations. Conversely, the agent aims to optimize its performance against this time-constrained adversary. In orange, the oracle observation, and in blue the stacked observation.
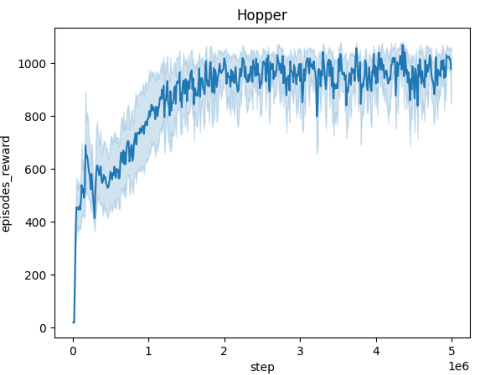
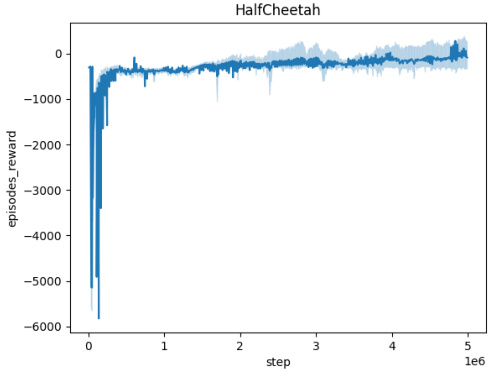
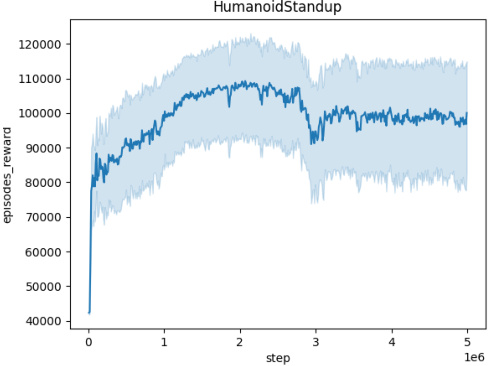
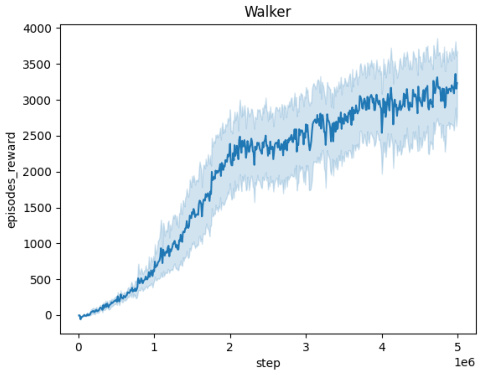
🔼 This figure displays the training curves for the Domain Randomization method across five different MuJoCo environments: Ant, HalfCheetah, Hopper, HumanoidStandup, and Walker. Each curve represents the average episodic reward over 10 independent runs. The shaded area around each curve indicates the standard deviation. The x-axis represents the number of training steps, and the y-axis represents the average episodic reward. This figure illustrates the learning process and stability of the Domain Randomization method in various continuous control tasks.
read the caption
Figure 5: Averaged training curves for the Domain Randomization method over 10 seeds
🔼 This figure illustrates the training process of a Time-Constrained Robust Markov Decision Process (TC-RMDP). It shows a two-player zero-sum game where an agent interacts with an environment and an adversary (nature). The adversary modifies the MDP parameters, aiming to maximize the negative impact of the temporally-coupled perturbations, while the agent aims to optimize its performance. The diagram highlights the different levels of information available to the agent: Oracle (full information), Stacked (previous state and action), and Vanilla (state only). The colors represent oracle observation (orange) and stacked observation (blue).
read the caption
Figure 1: TC-RMDP training involves a temporally-constrained adversary aiming to maximize the effect of temporally-coupled perturbations. Conversely, the agent aims to optimize its performance against this time-constrained adversary. In orange, the oracle observation, and in blue the stacked observation.
🔼 The figure illustrates the training process of a Time-Constrained Robust Markov Decision Process (TC-RMDP). It shows the interaction between an agent, an adversary, and the environment. The agent learns a policy to maximize its cumulative reward, while the adversary, representing environmental uncertainties, tries to minimize the agent’s performance by introducing temporally-correlated disturbances. The figure highlights two scenarios: one where the agent has access to the true environmental parameters (oracle observation, in orange), and another where the agent only has access to past observations (stacked observation, in blue).
read the caption
Figure 1: TC-RMDP training involves a temporally-constrained adversary aiming to maximize the effect of temporally-coupled perturbations. Conversely, the agent aims to optimize its performance against this time-constrained adversary. In orange, the oracle observation, and in blue the stacked observation.
🔼 The figure displays the training curves for the Domain Randomization method across five different MuJoCo environments: Ant, HalfCheetah, Hopper, HumanoidStandup, and Walker. Each curve represents the average episodic reward over 10 independent training runs. The shaded area represents the standard deviation across these runs, indicating the variability in performance. The x-axis shows the training steps, while the y-axis indicates the average episodic reward.
read the caption
Figure 5: Averaged training curves for the Domain Randomization method over 10 seeds

🔼 This figure displays the episodic rewards obtained by the trained agent during the adversary’s training phase across five different MuJoCo environments (Ant, HalfCheetah, Hopper, HumanoidStandup, and Walker). Each environment’s reward curve is plotted separately, showing the episodic rewards averaged over 10 independent training runs. A key feature is the consistent use of a perturbation radius (L) of 0.001 for the adversary in all environments. This implies that the adversary’s actions are constrained to a relatively small magnitude, allowing for a more controlled evaluation of the agent’s robustness and learning progress. The plots illustrate the training dynamics, revealing how the agent adapts its policy to counter the adversary’s perturbations over the 5 million timesteps.
read the caption
Figure 4: Episodic reward of the trained agent during the training of the adversary across different environments. Each plot represents the performance over 5 million timesteps, with rewards averaged across 10 seeds. The perturbation radius is set to L = 0.001 for all adversaries.

🔼 This figure shows the training curves for the Domain Randomization method across five different MuJoCo environments: Ant, HalfCheetah, Hopper, HumanoidStandup, and Walker. Each curve represents the average episodic reward over 10 independent training runs, plotted against the number of training steps. The shaded area around each line indicates the standard deviation across the 10 runs. The figure illustrates how the agent’s performance evolves during training with domain randomization in these different environments, providing insights into the convergence behavior and variability of this method.
read the caption
Figure 5: Averaged training curves for the Domain Randomization method over 10 seeds

🔼 This figure shows the training curves for the Domain Randomization method across five different MuJoCo environments (Ant, HalfCheetah, Hopper, HumanoidStandup, and Walker). Each curve represents the average episodic reward over 10 independent training runs, illustrating the learning progress over 5 million timesteps. The shaded area represents the standard deviation across the 10 runs, providing a measure of variability in performance.
read the caption
Figure 5: Averaged training curves for the Domain Randomization method over 10 seeds
🔼 This figure illustrates the training process of a Time-Constrained Robust Markov Decision Process (TC-RMDP). It shows the interaction between an agent, an adversary (representing environmental uncertainty), and the environment. The agent tries to learn an optimal policy, while the adversary introduces time-dependent and correlated disturbances. The ‘oracle observation’ (orange) represents a scenario where the agent has full knowledge of the environmental parameters, while the ‘stacked observation’ (blue) represents a more realistic setting where the agent only has access to limited information (previous states and actions).
read the caption
Figure 1: TC-RMDP training involves a temporally-constrained adversary aiming to maximize the effect of temporally-coupled perturbations. Conversely, the agent aims to optimize its performance against this time-constrained adversary. In orange, the oracle observation, and in blue the stacked observation.
🔼 This figure displays the training curves obtained using the Domain Randomization method across five different MuJoCo environments (Ant, HalfCheetah, Hopper, HumanoidStandup, and Walker). Each curve represents the average episodic reward over 10 independent training runs. The x-axis shows the number of training steps (5 million total), while the y-axis represents the average episodic reward. The shaded region around each curve represents the standard deviation across the 10 runs. The figure illustrates the learning progress of the agent in each environment using domain randomization. The consistent upward trend indicates successful learning in all environments.
read the caption
Figure 5: Averaged training curves for the Domain Randomization method over 10 seeds

🔼 This figure illustrates the training process of a Time-Constrained Robust Markov Decision Process (TC-RMDP). It shows the interaction between an agent and an adversary in a temporally constrained environment. The adversary introduces temporally coupled perturbations, aiming to maximize their negative effect on the agent. The agent, in turn, learns a policy to optimize its performance despite the adversary’s actions. The diagram highlights two different agent observation schemes: an oracle observation (orange), providing the adversary’s full parameter, and a stacked observation (blue), using past states and actions to approximate the adversary’s parameter.
read the caption
Figure 1: TC-RMDP training involves a temporally-constrained adversary aiming to maximize the effect of temporally-coupled perturbations. Conversely, the agent aims to optimize its performance against this time-constrained adversary. In orange, the oracle observation, and in blue the stacked observation.
🔼 This figure shows the training curves for the Domain Randomization method across five different MuJoCo environments (Ant, HalfCheetah, Hopper, HumanoidStandup, and Walker). Each curve represents the average episodic reward over 10 independent training runs. The x-axis indicates the training step, while the y-axis represents the episodic reward. The shaded area around each curve represents the standard deviation, providing a measure of variability across different runs. The figure visually demonstrates the learning progress and stability of the Domain Randomization method in different continuous control environments.
read the caption
Figure 5: Averaged training curves for the Domain Randomization method over 10 seeds

🔼 This figure illustrates the training process of a Time-Constrained Robust Markov Decision Process (TC-RMDP). It shows the interaction between an agent and an adversary in a temporally-constrained environment. The adversary attempts to maximize the impact of disturbances by adjusting parameters within set constraints. The agent simultaneously learns a policy to optimize its performance despite these adversarial actions. The diagram highlights two variations in agent observation: an oracle observation (orange) with full access to the environment’s parameters and a stacked observation (blue) using only past state and action information.
read the caption
Figure 1: TC-RMDP training involves a temporally-constrained adversary aiming to maximize the effect of temporally-coupled perturbations. Conversely, the agent aims to optimize its performance against this time-constrained adversary. In orange, the oracle observation, and in blue the stacked observation.
🔼 This figure illustrates the training process of a Time-Constrained Robust Markov Decision Process (TC-RMDP). It shows an agent interacting with an environment, where the agent’s goal is to learn an optimal policy despite uncertainties introduced by an adversary. The adversary is constrained in its actions, representing realistic limitations on how the environment can change over time. The diagram highlights two types of observations available to the agent: an oracle observation (full information) and a stacked observation (partial information from past states and actions). The orange color represents oracle observation while the blue one is the stacked observation. The figure is essential in explaining the different levels of information used by the three proposed algorithms.
read the caption
Figure 1: TC-RMDP training involves a temporally-constrained adversary aiming to maximize the effect of temporally-coupled perturbations. Conversely, the agent aims to optimize its performance against this time-constrained adversary. In orange, the oracle observation, and in blue the stacked observation.

🔼 This figure shows the training curves for the Domain Randomization method across five different MuJoCo environments (Ant, HalfCheetah, Hopper, HumanoidStandup, and Walker). Each curve represents the average episodic reward over 10 independent training runs, and the shaded region indicates the standard deviation. The x-axis represents the number of training steps, and the y-axis represents the average episodic reward. The figure helps illustrate the learning progress and stability of the Domain Randomization method in various continuous control tasks.
read the caption
Figure 5: Averaged training curves for the Domain Randomization method over 10 seeds

🔼 This figure illustrates the training process of a Time-Constrained Robust Markov Decision Process (TC-RMDP). It shows the interaction between an agent, an adversary (representing environmental uncertainty), and the environment. The agent seeks to learn an optimal policy, while the adversary, constrained by time, attempts to make the agent’s task more difficult by introducing temporally correlated disturbances. The figure highlights two different observation schemes for the agent: one with oracle access to the adversary’s parameters (orange), and another with a stacked observation that doesn’t rely on oracle access (blue).
read the caption
Figure 1: TC-RMDP training involves a temporally-constrained adversary aiming to maximize the effect of temporally-coupled perturbations. Conversely, the agent aims to optimize its performance against this time-constrained adversary. In orange, the oracle observation, and in blue the stacked observation.
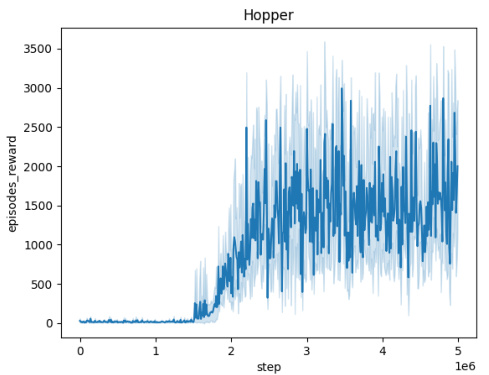
🔼 This figure presents the training curves for the Domain Randomization method across five different MuJoCo environments (Ant, HalfCheetah, Hopper, HumanoidStandup, and Walker). Each curve represents the average episodic reward over 10 independent training runs, showing the learning progress over 5 million steps. The shaded areas indicate the standard deviation. The figure illustrates the performance of Domain Randomization in learning robust policies in continuous control tasks.
read the caption
Figure 5: Averaged training curves for the Domain Randomization method over 10 seeds

🔼 This figure illustrates the training process of a Time-Constrained Robust Markov Decision Process (TC-RMDP). It shows how an agent interacts with an environment and an adversary. The adversary introduces temporally-coupled perturbations, while the agent attempts to optimize its performance considering these perturbations. Two observation methods are highlighted: Oracle observation (orange) and Stacked observation (blue). The Oracle method gives access to the true parameters of the environment, while the stacked method uses previous states and actions to approximate them.
read the caption
Figure 1: TC-RMDP training involves a temporally-constrained adversary aiming to maximize the effect of temporally-coupled perturbations. Conversely, the agent aims to optimize its performance against this time-constrained adversary. In orange, the oracle observation, and in blue the stacked observation.
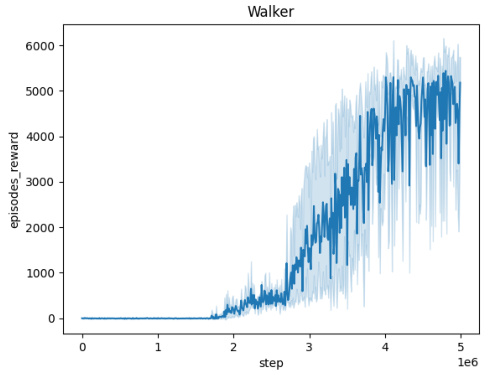
🔼 This figure illustrates the training process of a Time-Constrained Robust Markov Decision Process (TC-RMDP). It highlights the interaction between an agent and an adversary within the environment. The agent aims to learn an optimal policy, while the adversary introduces time-dependent disturbances that the agent must adapt to. The figure also shows the different information available to the agent depending on the specific algorithm used: the ‘Oracle’ version which has access to the full information of the model’s parameter (in orange), and the ‘Stacked’ version that uses previous steps’ information to predict the parameter (in blue). This figure helps visualize the core concept of the paper, which is to develop robust reinforcement learning algorithms that can handle time-constrained uncertainties.
read the caption
Figure 1: TC-RMDP training involves a temporally-constrained adversary aiming to maximize the effect of temporally-coupled perturbations. Conversely, the agent aims to optimize its performance against this time-constrained adversary. In orange, the oracle observation, and in blue the stacked observation.

🔼 This figure shows the training curves for the Domain Randomization method across five different MuJoCo environments (Ant, HalfCheetah, Hopper, HumanoidStandup, and Walker). Each curve represents the average episodic reward over 10 independent training runs. The x-axis represents the training steps, and the y-axis represents the episodic reward. The shaded area around each curve indicates the standard deviation. This visualization helps assess the convergence and stability of the training process for each environment.
read the caption
Figure 5: Averaged training curves for the Domain Randomization method over 10 seeds

🔼 This figure illustrates the training process of a Time-Constrained Robust Markov Decision Process (TC-RMDP). It highlights the interaction between an agent and an adversary in a temporally-constrained environment. The agent seeks to optimize its actions, while the adversary introduces temporally-correlated disturbances. The figure showcases how the oracle (orange) provides full information about the environment’s parameters to the agent, compared to the stacked observation (blue) which leverages past information for decision making.
read the caption
Figure 1: TC-RMDP training involves a temporally-constrained adversary aiming to maximize the effect of temporally-coupled perturbations. Conversely, the agent aims to optimize its performance against this time-constrained adversary. In orange, the oracle observation, and in blue the stacked observation.
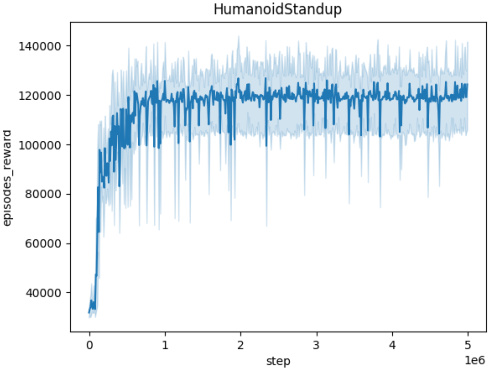
🔼 This figure shows the training curves for the Domain Randomization method across five different MuJoCo environments (Ant, HalfCheetah, Hopper, HumanoidStandup, Walker). Each curve represents the average episodic reward over 10 independent seeds. The x-axis represents the number of training steps, and the y-axis represents the average episodic reward. The shaded area around each line represents the standard deviation. This figure helps to visualize the training progress and stability of the Domain Randomization method in these different environments.
read the caption
Figure 5: Averaged training curves for the Domain Randomization method over 10 seeds

🔼 This figure displays the training curves obtained using the Domain Randomization method across five different MuJoCo environments: Ant, HalfCheetah, Hopper, HumanoidStandup, and Walker. Each curve represents the average episodic reward over 10 independent training runs, showcasing the learning progress of the agent over 5 million training steps. The shaded area around each curve represents the standard deviation, indicating the variability in performance across the different runs. This visualization helps assess the stability and convergence speed of the Domain Randomization approach in each environment.
read the caption
Figure 5: Averaged training curves for the Domain Randomization method over 10 seeds

🔼 This figure illustrates the training process of a Time-Constrained Robust Markov Decision Process (TC-RMDP). It shows the interaction between three entities: an agent, an adversary, and the environment. The agent learns a policy to maximize its reward, while the adversary, representing environmental uncertainty, attempts to minimize the agent’s reward. The time constraint restricts the adversary’s actions to have limited change over time. The diagram depicts different observation levels: the ‘oracle’ which has access to all the information, and the ‘stacked’ which uses the last transition to estimate the parameter. This illustrates the complexity of the TC-RMDP and the varying information levels used in the presented algorithms.
read the caption
Figure 1: TC-RMDP training involves a temporally-constrained adversary aiming to maximize the effect of temporally-coupled perturbations. Conversely, the agent aims to optimize its performance against this time-constrained adversary. In orange, the oracle observation, and in blue the stacked observation.
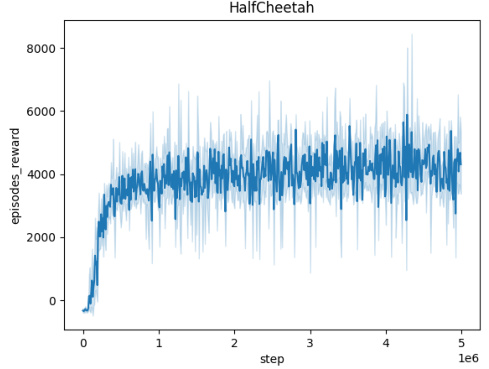
🔼 The figure displays training curves for the Domain Randomization method across five different MuJoCo environments: Ant, HalfCheetah, Hopper, HumanoidStandup, and Walker. Each curve represents the average performance over 10 independent runs, and the shaded area indicates the standard deviation. The x-axis represents training steps (up to 5 million), and the y-axis represents the cumulative episode rewards. The curves visually demonstrate how the Domain Randomization method learns to perform in each environment, highlighting variations in learning speed and overall performance across environments.
read the caption
Figure 5: Averaged training curves for the Domain Randomization method over 10 seeds

🔼 This figure illustrates the training process of a Time-Constrained Robust Markov Decision Process (TC-RMDP). It shows the interaction between an agent, an adversary (representing environmental uncertainties), and the environment. The agent aims to learn an optimal policy, while the adversary introduces time-dependent disturbances. The figure highlights two types of agent observations: oracle observation (with access to the complete uncertainty parameter) and stacked observation (with access to previous states and actions).
read the caption
Figure 1: TC-RMDP training involves a temporally-constrained adversary aiming to maximize the effect of temporally-coupled perturbations. Conversely, the agent aims to optimize its performance against this time-constrained adversary. In orange, the oracle observation, and in blue the stacked observation.

🔼 This figure shows the averaged training curves for the Domain Randomization method across five different MuJoCo environments (Ant, HalfCheetah, Hopper, HumanoidStandup, and Walker). Each curve represents the episodic reward obtained over 5 million steps, averaged over 10 independent seeds. The perturbation radius is set to L=0.001 for all adversaries.
read the caption
Figure 5: Averaged training curves for the Domain Randomization method over 10 seeds

🔼 This figure shows the training curves for the Domain Randomization method across five different MuJoCo environments (Ant, HalfCheetah, Hopper, HumanoidStandup, and Walker). Each curve represents the average episodic reward over 10 independent training runs. The x-axis represents the training step, and the y-axis represents the average episodic reward. The shaded area around each line indicates the standard deviation across the 10 seeds. This visualization helps to understand the training dynamics and convergence behavior of the Domain Randomization method in various robotic control tasks.
read the caption
Figure 5: Averaged training curves for the Domain Randomization method over 10 seeds
🔼 This figure illustrates the training process of a Time-Constrained Robust Markov Decision Process (TC-RMDP). It shows a two-player zero-sum game where an agent interacts with an environment, and an adversary (representing environmental uncertainty) modifies the MDP parameters (ψ) over time, subject to a Lipschitz constraint (||ψt+1 - ψt|| ≤ L). The agent’s goal is to learn an optimal policy despite the adversary’s actions. The diagram highlights different observation schemes: the oracle observation (in orange), where the agent has full access to ψ, and the stacked observation (in blue), where the agent uses previous states and actions to infer ψ. The figure is a schematic representation and not a literal depiction of a specific implementation.
read the caption
Figure 1: TC-RMDP training involves a temporally-constrained adversary aiming to maximize the effect of temporally-coupled perturbations. Conversely, the agent aims to optimize its performance against this time-constrained adversary. In orange, the oracle observation, and in blue the stacked observation.
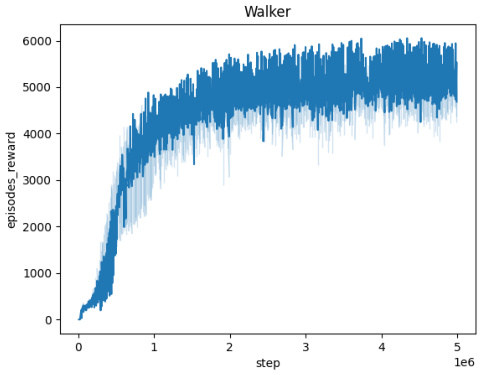
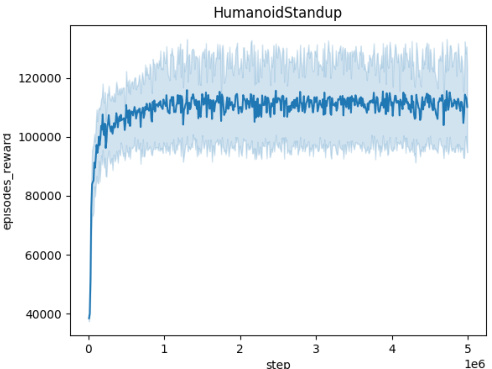
🔼 This figure presents the training curves for the Domain Randomization method across five different MuJoCo environments (Ant, HalfCheetah, Hopper, HumanoidStandup, and Walker). Each curve represents the average episodic reward obtained over 10 independent runs. The x-axis shows the training steps, and the y-axis represents the average episodic reward. The shaded area around each curve indicates the standard deviation of the episodic rewards across the 10 runs, providing a visual representation of the variability in performance. The figure visually demonstrates the learning progress and stability of the Domain Randomization method in each environment.
read the caption
Figure 5: Averaged training curves for the Domain Randomization method over 10 seeds

🔼 This figure illustrates the training process of a Time-Constrained Robust Markov Decision Process (TC-RMDP). It shows the interaction between an agent, an adversary (representing environmental uncertainty), and the environment itself. The agent tries to learn an optimal policy despite the adversary’s attempts to make the environment’s behavior unpredictable by introducing temporally coupled perturbations. The diagram highlights two different agent observation scenarios: one with oracle access to the full environmental parameters (in orange), and one with a stacked observation, leveraging past state and action information to infer the parameters (in blue).
read the caption
Figure 1: TC-RMDP training involves a temporally-constrained adversary aiming to maximize the effect of temporally-coupled perturbations. Conversely, the agent aims to optimize its performance against this time-constrained adversary. In orange, the oracle observation, and in blue the stacked observation.

🔼 The figure shows the averaged training curves for the Domain Randomization method across five different MuJoCo environments (Ant, HalfCheetah, Hopper, HumanoidStandup, and Walker). Each curve represents the episodic reward obtained over 5 million timesteps, with the results averaged over 10 independent seeds. The x-axis indicates the timestep, and the y-axis represents the episodic reward. The figure visually demonstrates the learning progress of the domain randomization approach in each environment, showing how the episodic reward evolves over time. This provides an understanding of convergence speed and stability in different environments.
read the caption
Figure 5: Averaged training curves for the Domain Randomization method over 10 seeds

🔼 This figure displays the training curves obtained using the Domain Randomization method across five different MuJoCo environments: Ant, HalfCheetah, Hopper, HumanoidStandup, and Walker. Each curve represents the average episodic reward over 10 independent runs, showing the learning progress over 5 million steps. The shaded area indicates the standard deviation across the runs, providing insight into the variability of the training process.
read the caption
Figure 5: Averaged training curves for the Domain Randomization method over 10 seeds

🔼 This figure illustrates the training process of a Time-Constrained Robust Markov Decision Process (TC-RMDP). It shows the interaction between an agent, an adversary (representing environmental uncertainty), and the environment. The agent aims to learn an optimal policy while the adversary attempts to maximize the negative impact of temporally correlated disturbances on the agent’s performance. The diagram highlights two different types of agent observations: ‘oracle’ (full access to the environmental parameters) and ‘stacked’ (access to previous state, action and reward for inferring the parameters).
read the caption
Figure 1: TC-RMDP training involves a temporally-constrained adversary aiming to maximize the effect of temporally-coupled perturbations. Conversely, the agent aims to optimize its performance against this time-constrained adversary. In orange, the oracle observation, and in blue the stacked observation.

🔼 This figure shows the training curves for the Domain Randomization method across five different MuJoCo environments: Ant, HalfCheetah, Hopper, HumanoidStandup, and Walker. Each curve represents the average episodic reward over 10 independent seeds. The x-axis shows the training steps (up to 5 million), and the y-axis represents the average episodic reward. The shaded area around each curve represents the standard deviation.
read the caption
Figure 5: Averaged training curves for the Domain Randomization method over 10 seeds

🔼 This figure illustrates the training process of a Time-Constrained Robust Markov Decision Process (TC-RMDP). It shows an agent interacting with an environment and an adversary. The adversary introduces time-dependent disturbances, while the agent learns a policy to optimize its performance despite these disturbances. The diagram highlights different levels of information available to the agent: oracle (full information), stacked (previous state and action), and vanilla (only current state).
read the caption
Figure 1: TC-RMDP training involves a temporally-constrained adversary aiming to maximize the effect of temporally-coupled perturbations. Conversely, the agent aims to optimize its performance against this time-constrained adversary. In orange, the oracle observation, and in blue the stacked observation.
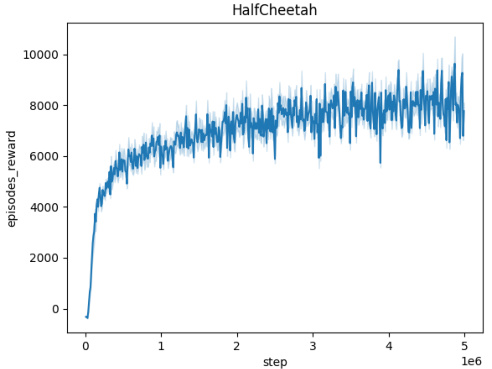
🔼 This figure shows the averaged training curves for the Domain Randomization method across five different MuJoCo environments (Ant, HalfCheetah, Hopper, HumanoidStandup, and Walker). Each curve represents the episodic reward obtained over 5 million timesteps. The shaded area around each curve indicates the standard deviation across 10 independent runs. This figure demonstrates the performance of the Domain Randomization method in terms of reward convergence and stability in continuous control tasks.
read the caption
Figure 5: Averaged training curves for the Domain Randomization method over 10 seeds
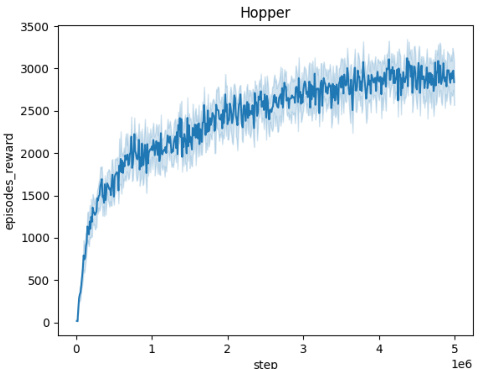
🔼 This figure shows the training curves for the Domain Randomization method across five different MuJoCo environments (Ant, HalfCheetah, Hopper, HumanoidStandup, and Walker). Each curve represents the average episodic reward over 10 independent seeds, plotted against the number of training steps. The shaded area around each curve indicates the standard deviation across the seeds. This visualization helps to assess the training stability and convergence of the Domain Randomization approach in different environments.
read the caption
Figure 5: Averaged training curves for the Domain Randomization method over 10 seeds
🔼 This figure illustrates the training process of a Time-Constrained Robust Markov Decision Process (TC-RMDP). It shows the interaction between an agent and an adversary within the environment. The adversary introduces temporally-coupled perturbations (noise that affects multiple timesteps) aiming to maximize their negative impact on the agent’s performance. Meanwhile, the agent tries to learn an optimal policy that performs well despite these disturbances. The diagram highlights two types of agent observations: a full observation that includes the current parameter value (oracle) and a partial observation using past states and actions (stacked).
read the caption
Figure 1: TC-RMDP training involves a temporally-constrained adversary aiming to maximize the effect of temporally-coupled perturbations. Conversely, the agent aims to optimize its performance against this time-constrained adversary. In orange, the oracle observation, and in blue the stacked observation.
🔼 This figure illustrates the training process of a Time-Constrained Robust Markov Decision Process (TC-RMDP). It shows the interaction between an agent, an adversary (representing environmental uncertainties), and the environment. The agent aims to learn an optimal policy while the adversary, constrained by time, tries to maximize the impact of its perturbations. The figure highlights two variants: the oracle version, where the agent observes the adversary’s actions (orange), and a stacked version where the agent uses past information to predict the adversary’s actions (blue).
read the caption
Figure 1: TC-RMDP training involves a temporally-constrained adversary aiming to maximize the effect of temporally-coupled perturbations. Conversely, the agent aims to optimize its performance against this time-constrained adversary. In orange, the oracle observation, and in blue the stacked observation.
🔼 This figure illustrates the training process of a Time-Constrained Robust Markov Decision Process (TC-RMDP). It shows the interaction between an agent, an adversary (representing environmental disturbances), and the environment. The agent learns a policy to maximize its cumulative reward, while the adversary introduces temporally coupled perturbations aiming to minimize the agent’s performance. The figure highlights two information scenarios: ‘oracle’ where the agent has full access to the adversary’s actions, and ‘stacked’ where the agent observes past states and actions to partially infer the adversary’s strategy. This reflects varying levels of information available to the agent in real-world applications.
read the caption
Figure 1: TC-RMDP training involves a temporally-constrained adversary aiming to maximize the effect of temporally-coupled perturbations. Conversely, the agent aims to optimize its performance against this time-constrained adversary. In orange, the oracle observation, and in blue the stacked observation.
🔼 This figure shows the training curves for the Domain Randomization method across five different MuJoCo environments (Ant, HalfCheetah, Hopper, HumanoidStandup, and Walker). Each curve represents the average episodic reward over 10 independent runs, illustrating the learning progress over 5 million training steps. The shaded area around each line represents the standard deviation, providing a measure of variability in performance.
read the caption
Figure 5: Averaged training curves for the Domain Randomization method over 10 seeds

🔼 This figure displays the training curves for the Domain Randomization method across five different MuJoCo environments: Ant, HalfCheetah, Hopper, HumanoidStandup, and Walker. Each curve represents the average episodic reward over 10 independent training runs, and the shaded area indicates the standard deviation. The x-axis shows the training steps, and the y-axis shows the average episodic reward. The figure helps to visualize the learning progress of the Domain Randomization method and its variability across different environments.
read the caption
Figure 5: Averaged training curves for the Domain Randomization method over 10 seeds

🔼 This figure illustrates the training process of a Time-Constrained Robust Markov Decision Process (TC-RMDP). It shows the interaction between an agent, an adversary, and the environment. The agent aims to learn an optimal policy while the adversary introduces temporally-constrained perturbations to the environment. The figure highlights two types of observations available to the agent: an oracle observation (orange) which provides access to the true parameters of the environment, and a stacked observation (blue) which includes past states and actions. The goal of the agent is to optimize its performance despite the adversary’s attempts to disrupt the environment, creating a scenario representative of real-world challenges.
read the caption
Figure 1: TC-RMDP training involves a temporally-constrained adversary aiming to maximize the effect of temporally-coupled perturbations. Conversely, the agent aims to optimize its performance against this time-constrained adversary. In orange, the oracle observation, and in blue the stacked observation.
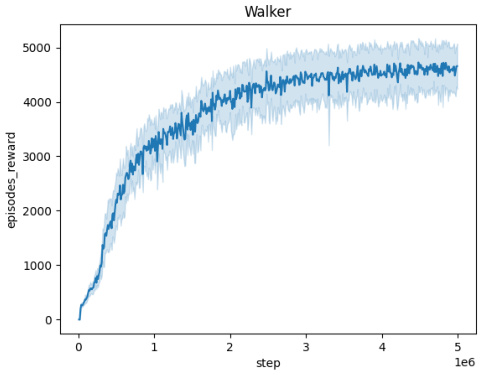
🔼 This figure shows the averaged training curves for the Domain Randomization method across five different MuJoCo environments (Ant, HalfCheetah, Hopper, HumanoidStandup, and Walker). Each curve represents the performance over 5 million timesteps, with the shaded area indicating the standard deviation across the 10 seeds used in the experiment. It provides a visual representation of the learning progress and stability of the Domain Randomization approach in various continuous control tasks.
read the caption
Figure 5: Averaged training curves for the Domain Randomization method over 10 seeds
More on tables

🔼 This table presents the average normalized performance results across ten different random seeds for various robust reinforcement learning algorithms under time-constrained worst-case scenarios. The algorithms are evaluated on several MuJoCo continuous control environments. The results are normalized against a baseline, enabling comparison across different tasks and highlighting the relative performance improvement or degradation. The ‘worst-case’ scenario implies that the evaluation considers the most challenging conditions for each algorithm.
read the caption
Table 1: Avg. of normalized time-coupled worst-case performance over 10 seeds for each method

🔼 This table presents the average normalized performance of different robust reinforcement learning algorithms under time-constrained worst-case scenarios. The results are averaged over 10 different random seeds and show the performance across multiple MuJoCo continuous control environments (Ant, HalfCheetah, Hopper, Humanoid, Walker). The algorithms include various robust RL methods, along with the proposed time-constrained algorithms (Oracle-TC, Stacked-TC, Vanilla TC) applied to RARL and M2TD3. Domain randomization (DR) and vanilla TD3 are also included as baselines. The ’normalized’ aspect refers to a standardization process described in the paper to enable comparison across different environments.
read the caption
Table 1: Avg. of normalized time-coupled worst-case performance over 10 seeds for each method

🔼 This table presents the average normalized worst-case performance of different reinforcement learning algorithms across various MuJoCo environments. The worst-case performance is evaluated under time-constrained adversarial perturbations. The results are averaged over 10 independent random seeds. The algorithms include those using the proposed time-constrained robust MDP framework (TC-RARL, TC-M2TD3, Stacked TC-RARL, Stacked TC-M2TD3, Vanilla TC, Oracle TC-RARL, Oracle TC-M2TD3) and baselines (TD3, DR, M2TD3, RARL). The table shows that the time-constrained algorithms, especially Oracle TC-M2TD3 and Oracle TC-RARL generally achieve better performance compared to the baselines. The performance is normalized to provide a comparable metric across different environments.
read the caption
Table 1: Avg. of normalized time-coupled worst-case performance over 10 seeds for each method

🔼 This table presents the average normalized performance results for various reinforcement learning algorithms under time-constrained worst-case scenarios. The results are averaged over 10 different random seeds to ensure reliability. The algorithms are evaluated across multiple continuous control environments (Ant, HalfCheetah, Hopper, Humanoid, Walker). The performance metric is normalized to provide a comparable measure across these diverse environments. The table allows comparison of different approaches, including traditional robust RL methods (M2TD3, RARL), domain randomization (DR), and the three time-constrained robust MDP (TC-RMDP) algorithms proposed in the paper (Oracle-TC-M2TD3, Oracle-TC-RARL, Stacked-TC-M2TD3, Stacked-TC-RARL, TC-M2TD3, TC-RARL, Vanilla TC-M2TD3, Vanilla TC-RARL). The results highlight the trade-off between performance and robustness achieved with the proposed TC-RMDP algorithms.
read the caption
Table 1: Avg. of normalized time-coupled worst-case performance over 10 seeds for each method

🔼 This table presents the average normalized performance of different algorithms under worst-case time-constrained perturbations. The results are averaged over 10 random seeds, and the performance is normalized to account for variations between different environments. Each algorithm’s performance is presented for several Mujoco benchmark tasks. The table helps to compare the robustness of the different algorithms in the face of time-coupled disturbances.
read the caption
Table 1: Avg. of normalized time-coupled worst-case performance over 10 seeds for each method

🔼 This table presents the average normalized performance results across ten different random seeds for various robust reinforcement learning methods under time-coupled worst-case conditions. The methods are categorized into Oracle, Stacked, and Vanilla versions of TC-RARL and TC-M2TD3, along with baseline methods including TD3, DR, M2TD3, and RARL. The performance metric is normalized, providing a comparable evaluation across different MuJoCo environments (Ant, HalfCheetah, Hopper, Humanoid, Walker).
read the caption
Table 1: Avg. of normalized time-coupled worst-case performance over 10 seeds for each method

🔼 This table presents the average normalized performance results across ten different random seeds for various robust reinforcement learning methods. The ‘worst-case’ performance is evaluated under time-constrained, temporally coupled adversarial perturbations. The table compares the performance of different algorithms (Oracle M2TD3, Oracle RARL, Oracle-TC-M2TD3, Oracle-TC-RARL, Stacked-TC-M2TD3, Stacked-TC-RARL, TC-M2TD3, TC-RARL, TD3, DR, M2TD3, and RARL) across five different MuJoCo environments (Ant, HalfCheetah, Hopper, Humanoid, and Walker). The normalization is done relative to the performance of TD3 and M2TD3.
read the caption
Table 1: Avg. of normalized time-coupled worst-case performance over 10 seeds for each method

🔼 This table presents the average normalized performance of various robust reinforcement learning algorithms under worst-case time-constrained perturbations across multiple MuJoCo benchmark environments. The normalization is relative to TD3, using M2TD3’s performance as a target. It allows for comparison across different environments and highlights the performance of the proposed time-constrained algorithms (TC-RARL and TC-M2TD3) against baselines.
read the caption
Table 1: Avg. of normalized time-coupled worst-case performance over 10 seeds for each method

🔼 This table presents the average normalized performance results across ten different random seeds for each algorithm under the worst-case time-constrained perturbations. The algorithms are evaluated on several MuJoCo continuous control environments (Ant, HalfCheetah, Hopper, Humanoid, Walker). The ‘worst-case’ scenario refers to the performance against an adversary that is specifically designed to maximize the negative impact of the time-constrained uncertainty. The results are normalized to provide a fair comparison across environments and highlight the relative performance improvements of different algorithms. Oracle methods, which have access to full state information, are included for comparison and are shown in black. Green and bold values indicate the best performance among methods without oracle access.
read the caption
Table 1: Avg. of normalized time-coupled worst-case performance over 10 seeds for each method
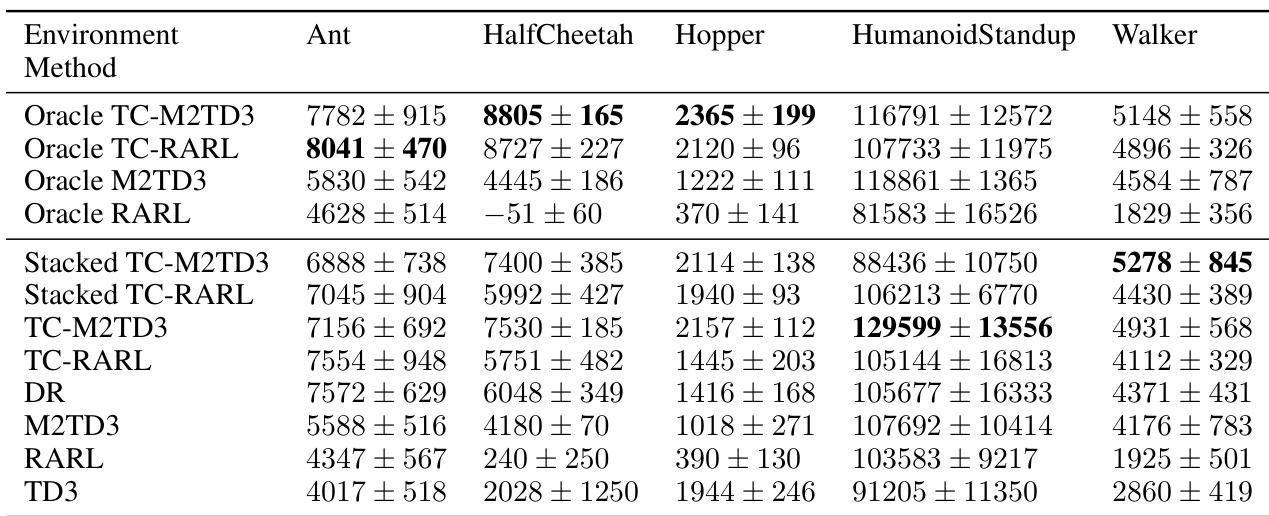
🔼 This table presents the average normalized performance results for various reinforcement learning algorithms under worst-case time-constrained perturbations. The performance is measured across different MuJoCo environments (Ant, HalfCheetah, Hopper, Humanoid, and Walker). The algorithms are compared against various baselines, including traditional robust methods and domain randomization. The table shows the average performance and standard deviation across ten random seeds for each algorithm in each environment, providing a comprehensive comparison of robustness and performance under time-constrained adversarial settings.
read the caption
Table 1: Avg. of normalized time-coupled worst-case performance over 10 seeds for each method

🔼 This table presents the average normalized performance results across ten different random seeds for various robust reinforcement learning algorithms under time-constrained worst-case conditions. The algorithms are evaluated across five MuJoCo environments: Ant, HalfCheetah, Hopper, Humanoid, and Walker. Normalization uses TD3 and M2TD3 as references to allow for comparison across different environments. The results indicate the relative performance of each algorithm, highlighting the best-performing methods under challenging conditions.
read the caption
Table 1: Avg. of normalized time-coupled worst-case performance over 10 seeds for each method

🔼 This table presents the average normalized performance of various reinforcement learning algorithms under time-constrained worst-case conditions. The results are averaged over 10 independent random seeds and showcase the performance across several continuous control tasks (Ant, HalfCheetah, Hopper, Humanoid, Walker). The metrics are normalized to provide a comparable view across different environments and methods. Oracle methods (with access to optimal information) are shown in black. Bold green values highlight the best performances without oracle information.
read the caption
Table 1: Avg. of normalized time-coupled worst-case performance over 10 seeds for each method

🔼 This table presents the average normalized performance results across ten different random seeds for various reinforcement learning algorithms under time-constrained worst-case scenarios. The algorithms are evaluated on five different MuJoCo continuous control environments (Ant, HalfCheetah, Hopper, Humanoid, Walker). The performance metric is normalized, ensuring fair comparison across environments. The table compares the proposed TC-RMDP algorithms (Oracle-TC-M2TD3, Oracle-TC-RARL, Stacked-TC-M2TD3, Stacked-TC-RARL, TC-M2TD3, TC-RARL) against state-of-the-art baselines (M2TD3, RARL, TD3, DR). Oracle methods have access to optimal environmental information.
read the caption
Table 1: Avg. of normalized time-coupled worst-case performance over 10 seeds for each method

🔼 This table presents the average normalized performance results across ten different random seeds for various reinforcement learning algorithms under time-constrained worst-case scenarios. The algorithms are tested on multiple MuJoCo continuous control environments (Ant, HalfCheetah, Hopper, Humanoid, Walker). The ’normalized’ scores are relative to a baseline TD3 agent and a target M2TD3 agent, providing a standardized metric for comparing performance across different environments. The table highlights the performance of the proposed TC-RMDP algorithms (Oracle-TC-M2TD3, Oracle-TC-RARL, Stacked-TC-M2TD3, Stacked-TC-RARL, TC-M2TD3, TC-RARL) in comparison to state-of-the-art methods (M2TD3, RARL, TD3, DR) and oracle versions of the state-of-the-art methods. The best performing non-oracle method in each environment is highlighted.
read the caption
Table 1: Avg. of normalized time-coupled worst-case performance over 10 seeds for each method

🔼 This table presents the average normalized performance results across ten different random seeds for various algorithms under time-constrained worst-case scenarios. The metrics are normalized to provide a relative comparison against TD3 and M2TD3 baselines, making it easy to assess the performance improvement of each algorithm in different continuous control environments (Ant, HalfCheetah, Hopper, Humanoid, Walker). The ‘Oracle’ methods utilize full environmental information, highlighting the performance gains possible with complete information compared to less-informed counterparts.
read the caption
Table 1: Avg. of normalized time-coupled worst-case performance over 10 seeds for each method
Full paper#


