TL;DR#
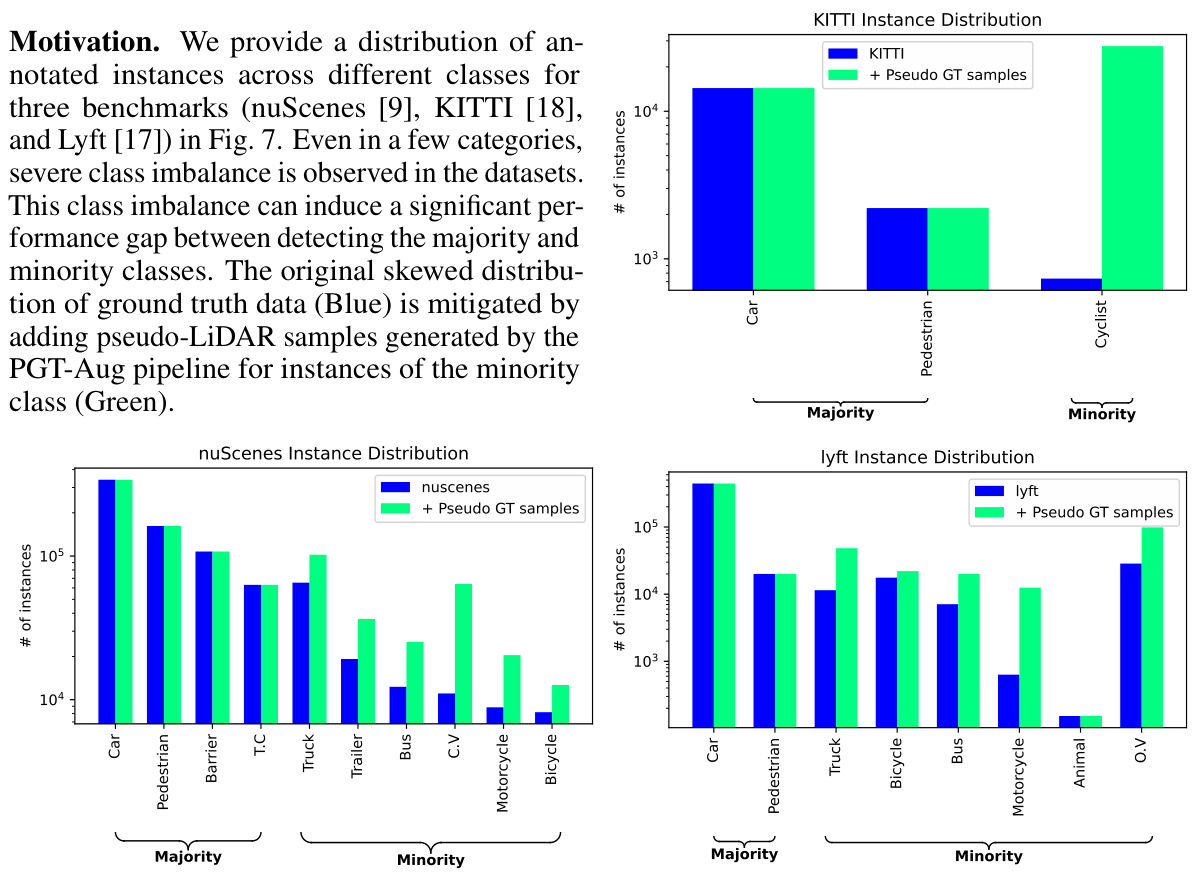
3D object detection models often suffer from class imbalance, where some object categories are under-represented in training data. Existing augmentation methods struggle to create diverse and realistically placed synthetic data samples for these under-represented classes. This limits the models’ ability to accurately detect these less frequent object types.
This research introduces Pseudo Ground Truth Augmentation (PGT-Aug), a new approach that uses pseudo-LiDAR point clouds generated from low-cost miniatures and videos to improve minority class representation during training. PGT-Aug involves volumetric 3D reconstruction, LiDAR intensity simulation, and a hybrid placement strategy using both ground and map information. The results show significant performance improvements on various benchmark datasets like nuScenes, KITTI, and Lyft, especially for datasets with large domain gaps and for minority classes.
Key Takeaways#
Why does it matter?#
This paper is important because it presents a novel and cost-effective solution to the class imbalance problem in 3D object detection, a significant challenge in autonomous driving and robotics. The proposed method, PGT-Aug, enhances model robustness and improves performance, particularly for minority classes. This work opens new avenues for data augmentation in 3D perception, contributing to the development of more accurate and reliable models. Its practicality and effectiveness make it highly relevant to researchers working with limited datasets.
Visual Insights#
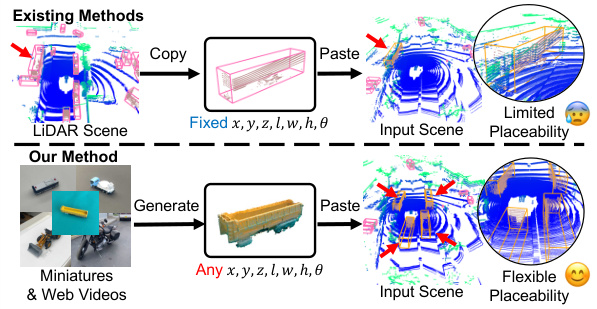
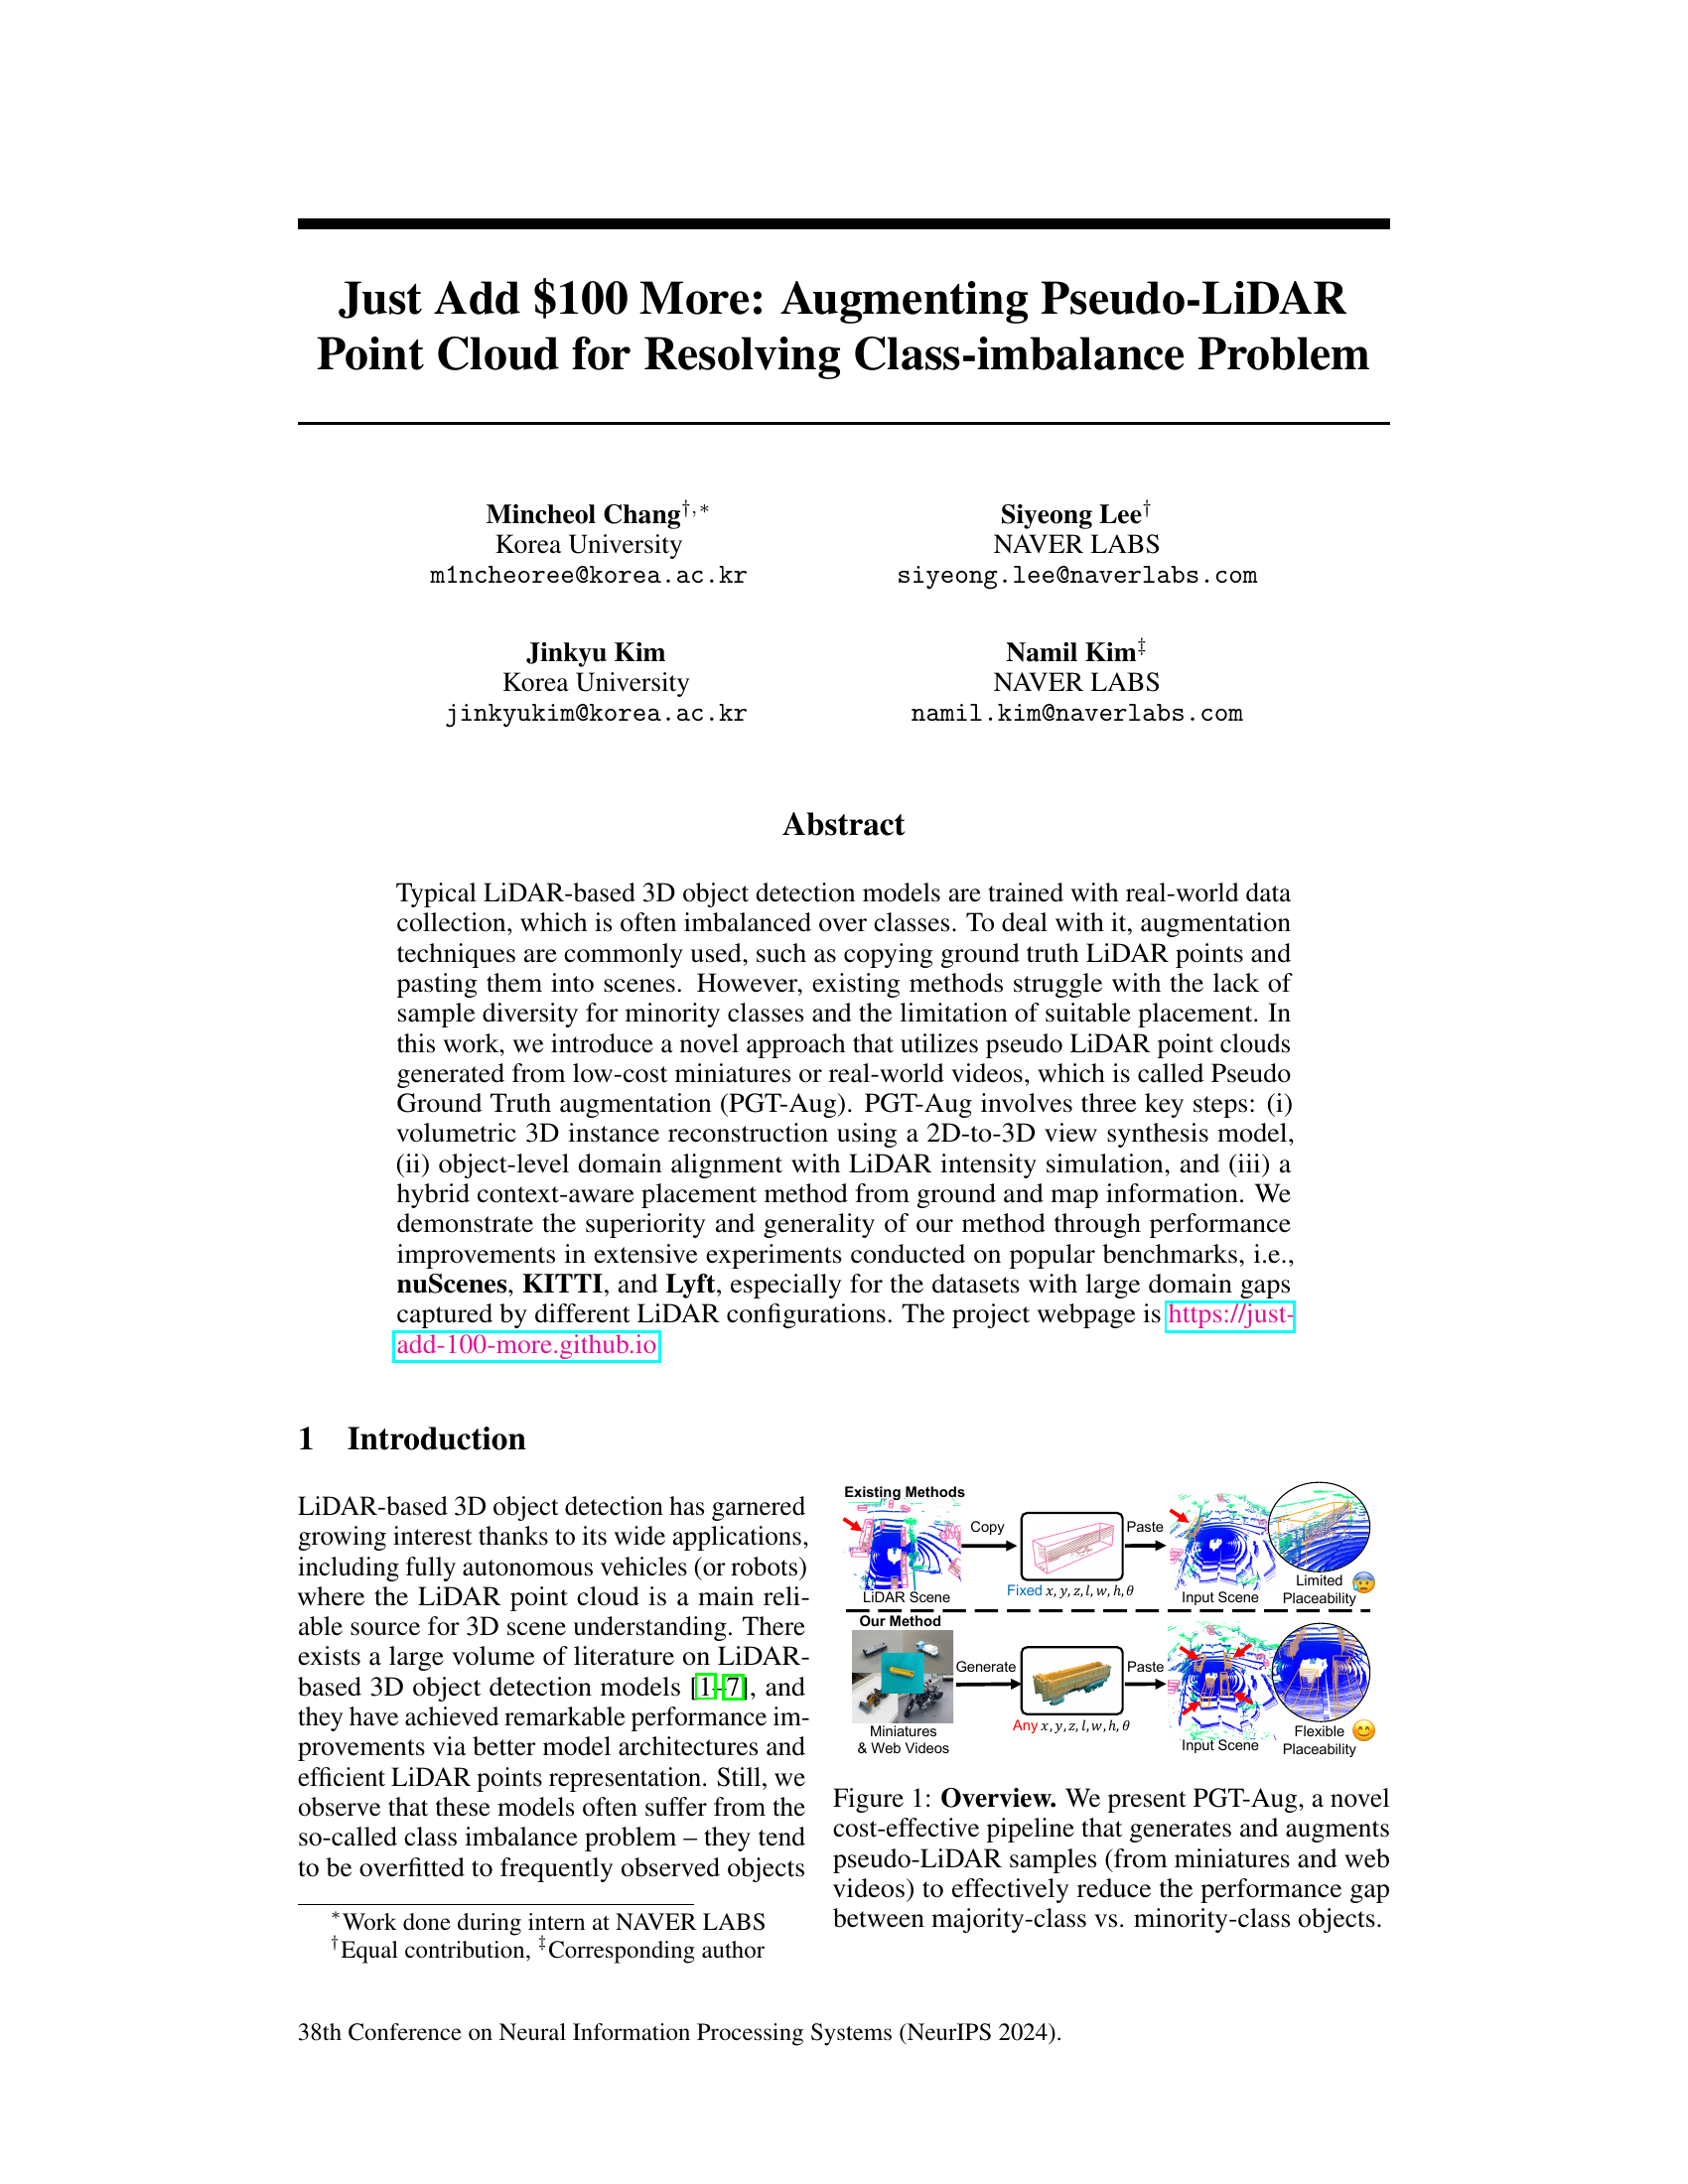
🔼 The figure illustrates the difference between existing methods and the proposed method (PGT-Aug) for augmenting pseudo-LiDAR point clouds. Existing methods copy and paste ground truth LiDAR points into scenes, resulting in limited placeability. PGT-Aug generates pseudo-LiDAR samples from low-cost miniatures or real-world videos, enabling more flexible placeability.
read the caption
Figure 1: Overview. We present PGT-Aug, a novel cost-effective pipeline that generates and augments pseudo-LiDAR samples (from miniatures and web videos) to effectively reduce the performance gap between majority-class vs. minority-class objects.
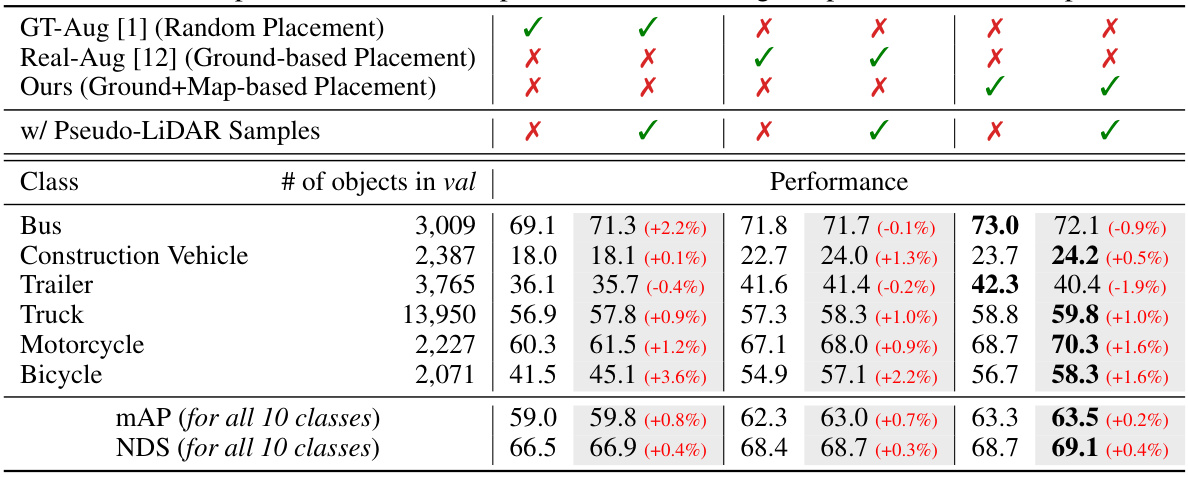
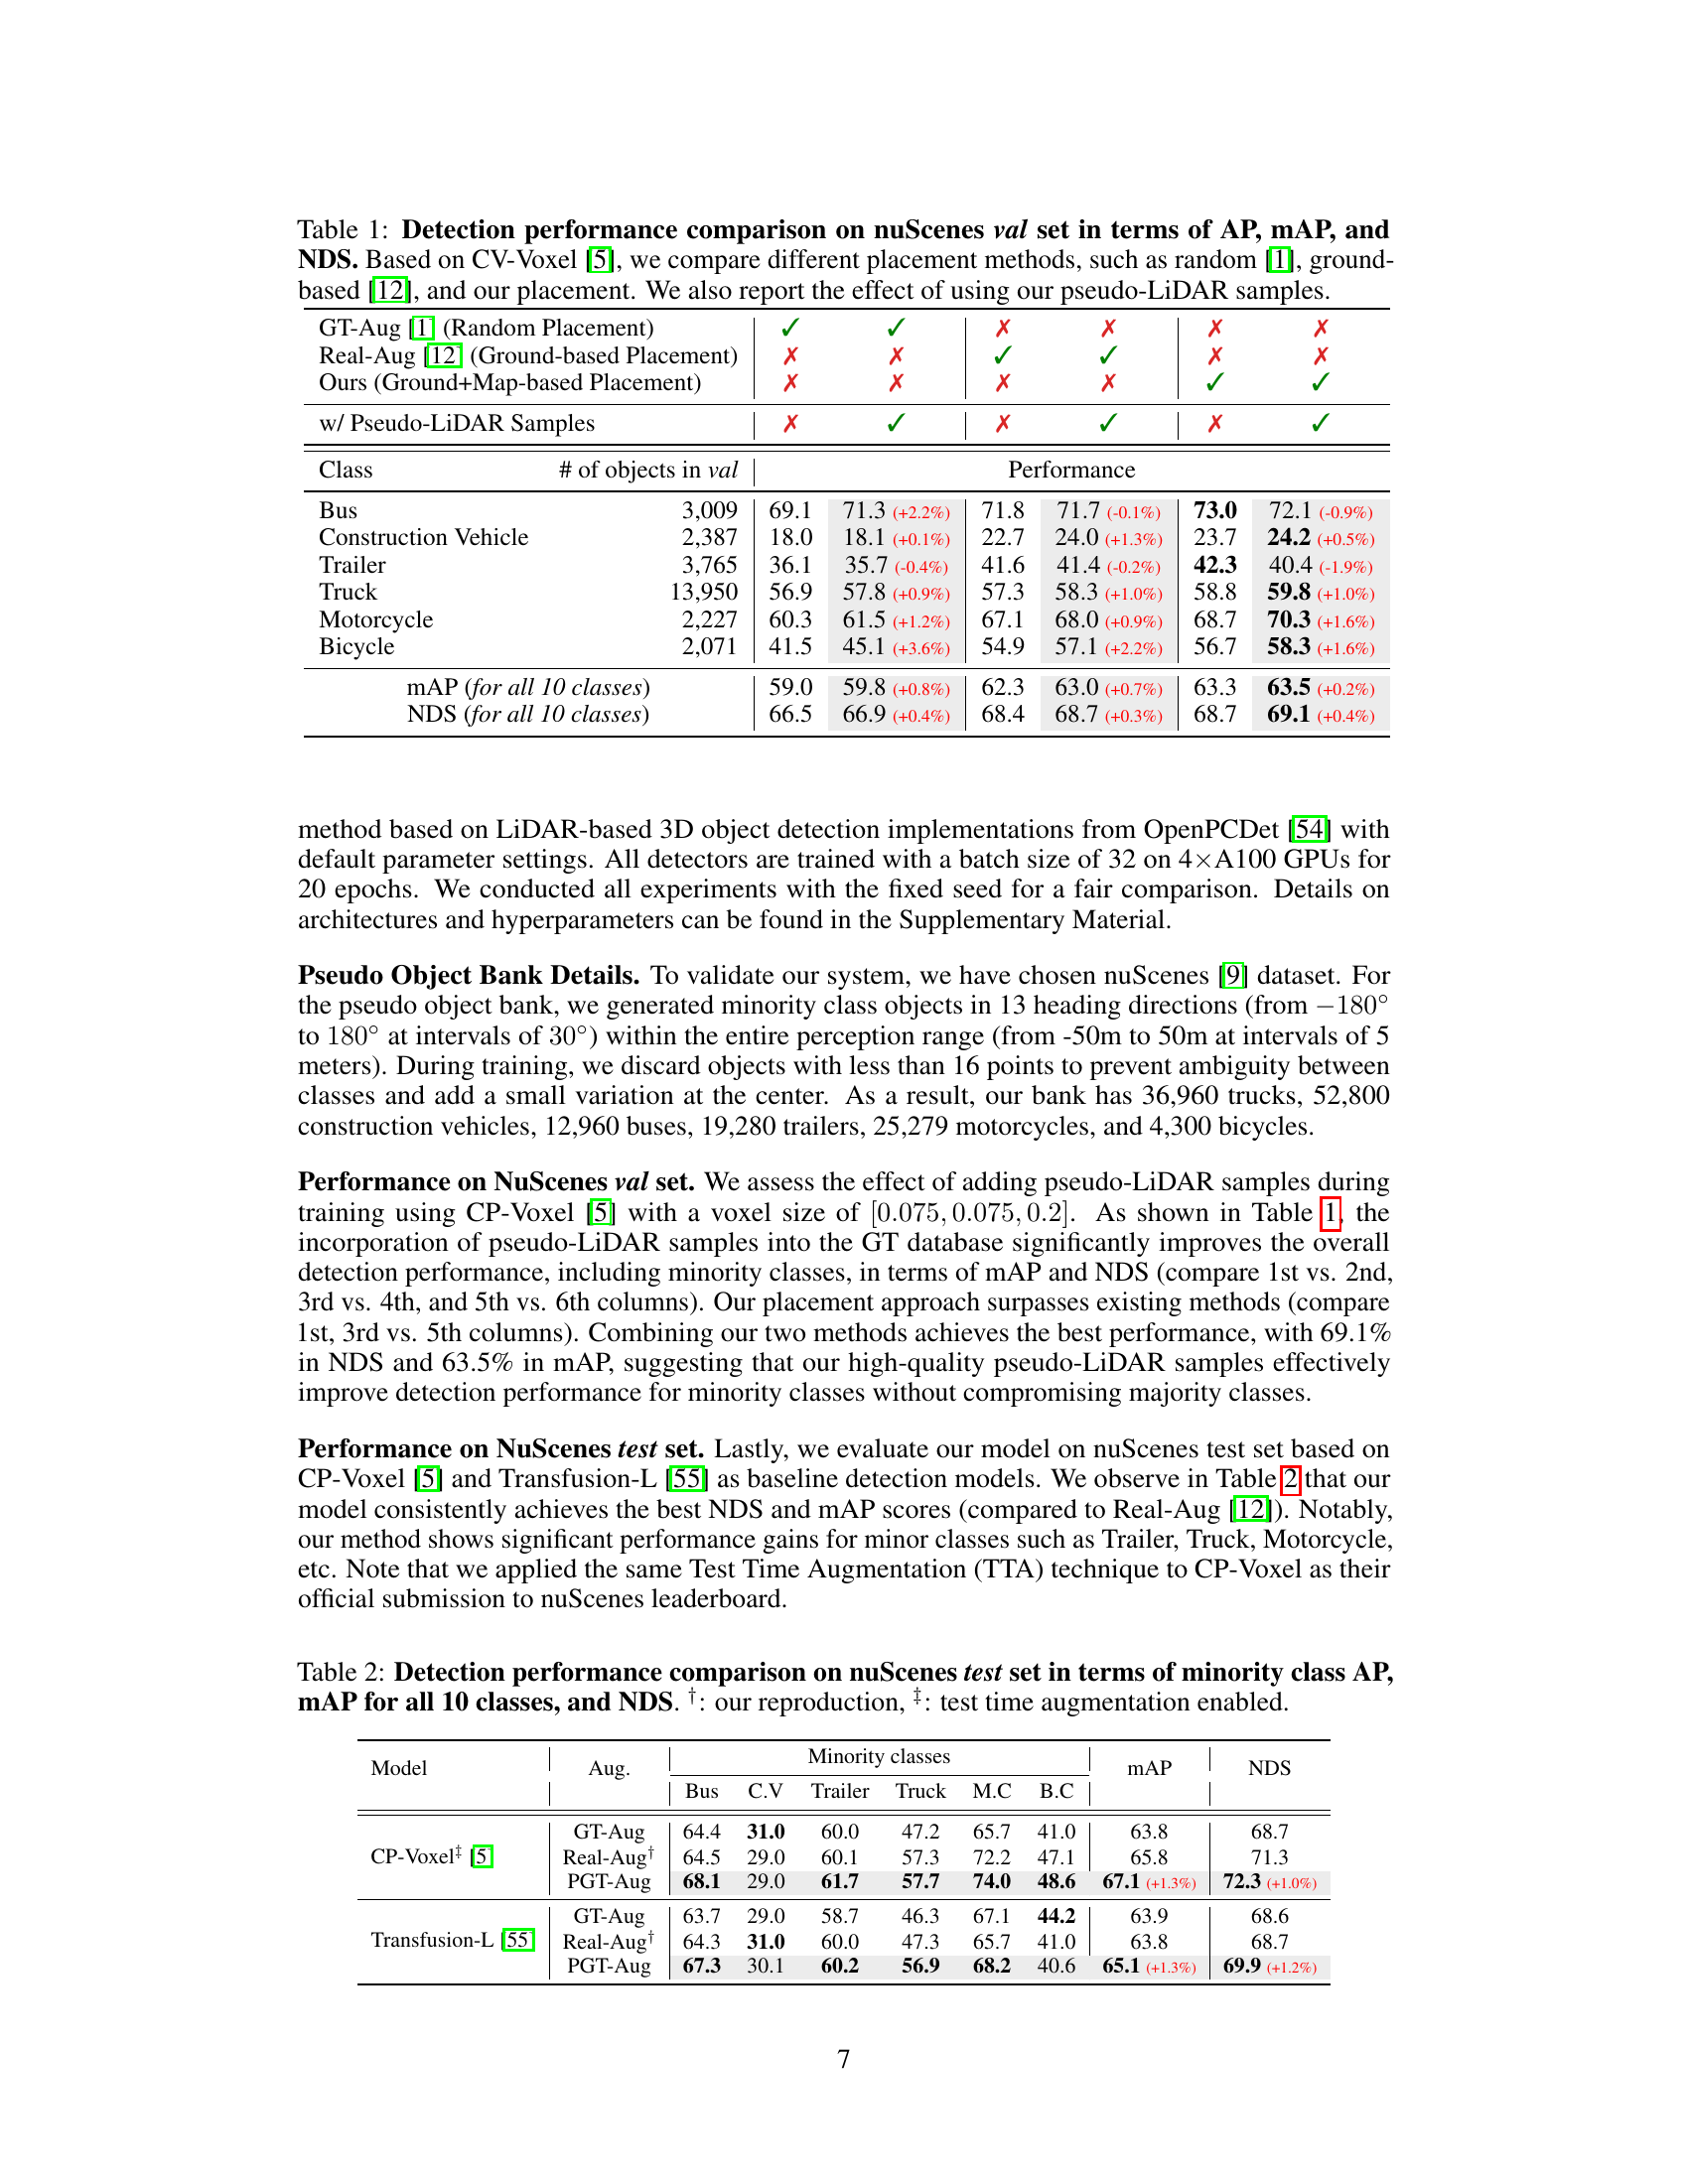
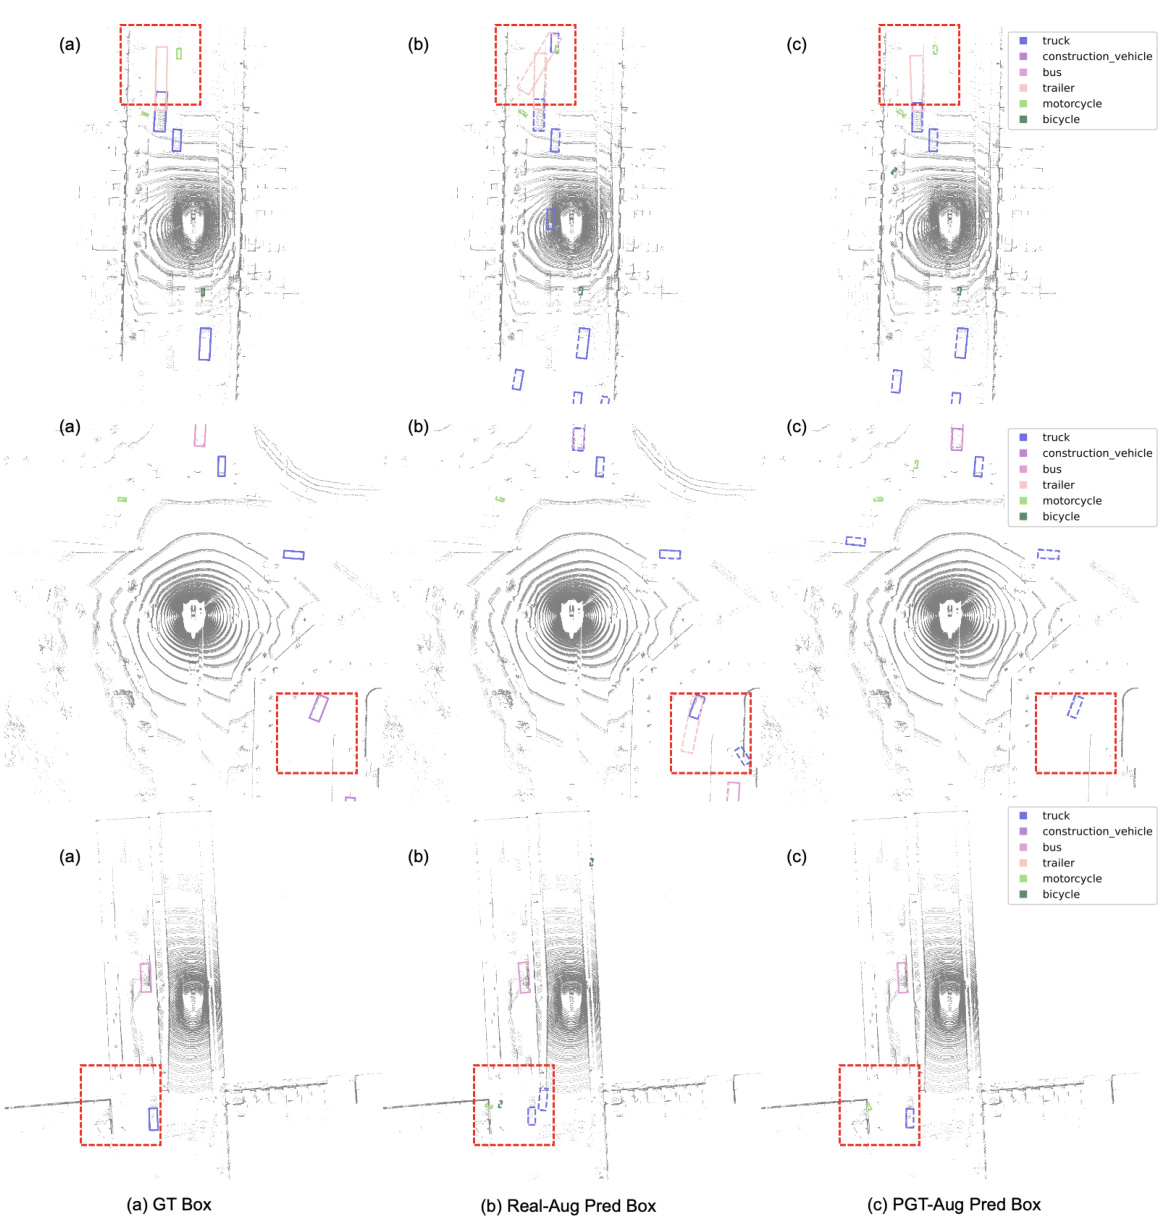
🔼 This table presents a comparison of object detection performance on the nuScenes validation set using different data augmentation and object placement techniques. It compares the performance of the baseline method (CV-Voxel) against three different augmentation strategies: GT-Aug (random placement), Real-Aug (ground-based placement), and the proposed method (ground+map-based placement). Each strategy is evaluated both with and without the addition of pseudo-LiDAR samples. The results are presented in terms of Average Precision (AP), mean Average Precision (mAP), and NuScenes Detection Score (NDS) across ten object classes.
read the caption
Table 1: Detection performance comparison on nuScenes val set in terms of AP, mAP, and NDS. Based on CV-Voxel [5], we compare different placement methods, such as random [1], ground-based [12], and our placement. We also report the effect of using our pseudo-LiDAR samples.
In-depth insights#
PGT-Aug: Data Augmentation#
The proposed PGT-Aug data augmentation method tackles class imbalance in LiDAR-based 3D object detection by cleverly leveraging pseudo-LiDAR point clouds. Instead of relying solely on real-world LiDAR data, PGT-Aug generates synthetic data from low-cost miniatures and publicly available videos. This approach addresses the limitations of existing methods that struggle with sample diversity and placement constraints for minority classes. The process involves generating 3D models from multiple views, aligning these models with real LiDAR intensity patterns, and then placing them contextually within real scenes using a hybrid method incorporating both ground and map information. This approach shows significant improvements in detection performance across multiple benchmarks, especially for minority classes. The cost-effectiveness and generalizability of PGT-Aug are key strengths, offering a viable solution to overcome data scarcity issues that frequently plague the training of robust 3D object detection models.
LiDAR Domain Alignment#
LiDAR domain alignment in the context of 3D object detection from visual data sources like miniatures and videos is crucial for bridging the reality gap. The core challenge lies in transforming synthetic point clouds generated from images to realistically mimic real LiDAR point clouds. This involves handling differences in data characteristics such as point density, intensity distribution, noise levels, and sensor geometry. The paper tackles this by employing a multi-step process. Firstly, view-dependent filtering and rearrangement of synthetic points simulates realistic data variations based on object position relative to the sensor. Next, LiDAR intensity simulation employs a data-driven approach (CycleGAN) to translate RGB point cloud intensities into LiDAR-like intensity values. This is crucial for accurate LiDAR modeling and evaluation. Addressing the spatial distribution of the points is tackled via a map-aware augmentation technique that determines realistic object placement locations by considering both map information and estimated ground areas. This ensures contextual coherence and improves the overall detection performance. The success of this approach hinges on effectively creating a synthetic point cloud that seamlessly integrates into the training data, thus improving the model’s generalization capabilities and reducing class imbalance.
Object Placement Strategy#
The effectiveness of data augmentation hinges on a thoughtful object placement strategy. Crudely pasting objects can lead to unrealistic scenes and hinder model generalization. Sophisticated strategies are crucial; considering contextual factors like ground plane estimation and map data is key. Integrating map information improves placement realism by leveraging semantic understanding of the environment. A hybrid approach that combines ground plane analysis with map data for object placement is particularly promising. This would allow for more natural and diverse placements, leading to improved model robustness. The choice of placement method also depends on the dataset; different LiDAR configurations have varying spatial resolutions and sampling patterns. Developing adaptable algorithms that dynamically adjust to these nuances is important. Finally, it’s essential to carefully evaluate the impact of different placement strategies on model performance, particularly for minority classes which data augmentation seeks to benefit.
Benchmark Performance#
A thorough analysis of benchmark performance in a research paper requires a multifaceted approach. It’s crucial to assess not only the overall performance metrics (like mAP or NDS) but also to delve into class-specific results, especially for minority classes. A significant performance improvement for minority classes demonstrates the effectiveness of addressing class imbalance, a key challenge in many real-world datasets. The paper should clearly present performance gains across different datasets and model architectures, highlighting the method’s generalization capability. It is vital to consider if the improvements are statistically significant and compare the results to state-of-the-art methods to establish the proposed technique’s value. Analyzing the computational cost and resource requirements associated with achieving this performance is also crucial, allowing for a holistic assessment of its practical applicability. Finally, an in-depth discussion of the limitations and potential biases within the chosen benchmarks is necessary for a complete understanding of the benchmark performance.
Future Work Directions#
Future research could explore enhancing the robustness and generalizability of PGT-Aug by investigating more sophisticated 3D reconstruction techniques that are less sensitive to noise and variations in viewpoint. Improving the efficiency of the pipeline, particularly for generating pseudo-LiDAR points, is crucial for broader applications. Investigating different methods for object placement, including incorporating semantic scene understanding and object interactions, would greatly enhance realism. Extending PGT-Aug to handle dynamic objects such as pedestrians and cyclists is important. The impact of varying object appearances on the performance of the pipeline should also be investigated. Exploring alternative data sources such as synthetic datasets and game engines to generate more diverse pseudo-LiDAR point clouds would improve the generality of PGT-Aug. Finally, a thorough evaluation across different sensor configurations and data types would verify the broad applicability of the approach.
More visual insights#
More on figures
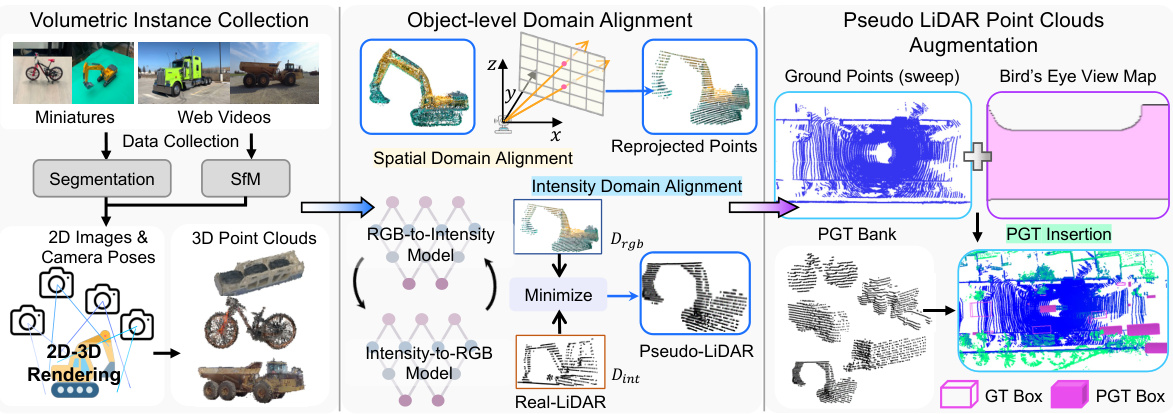
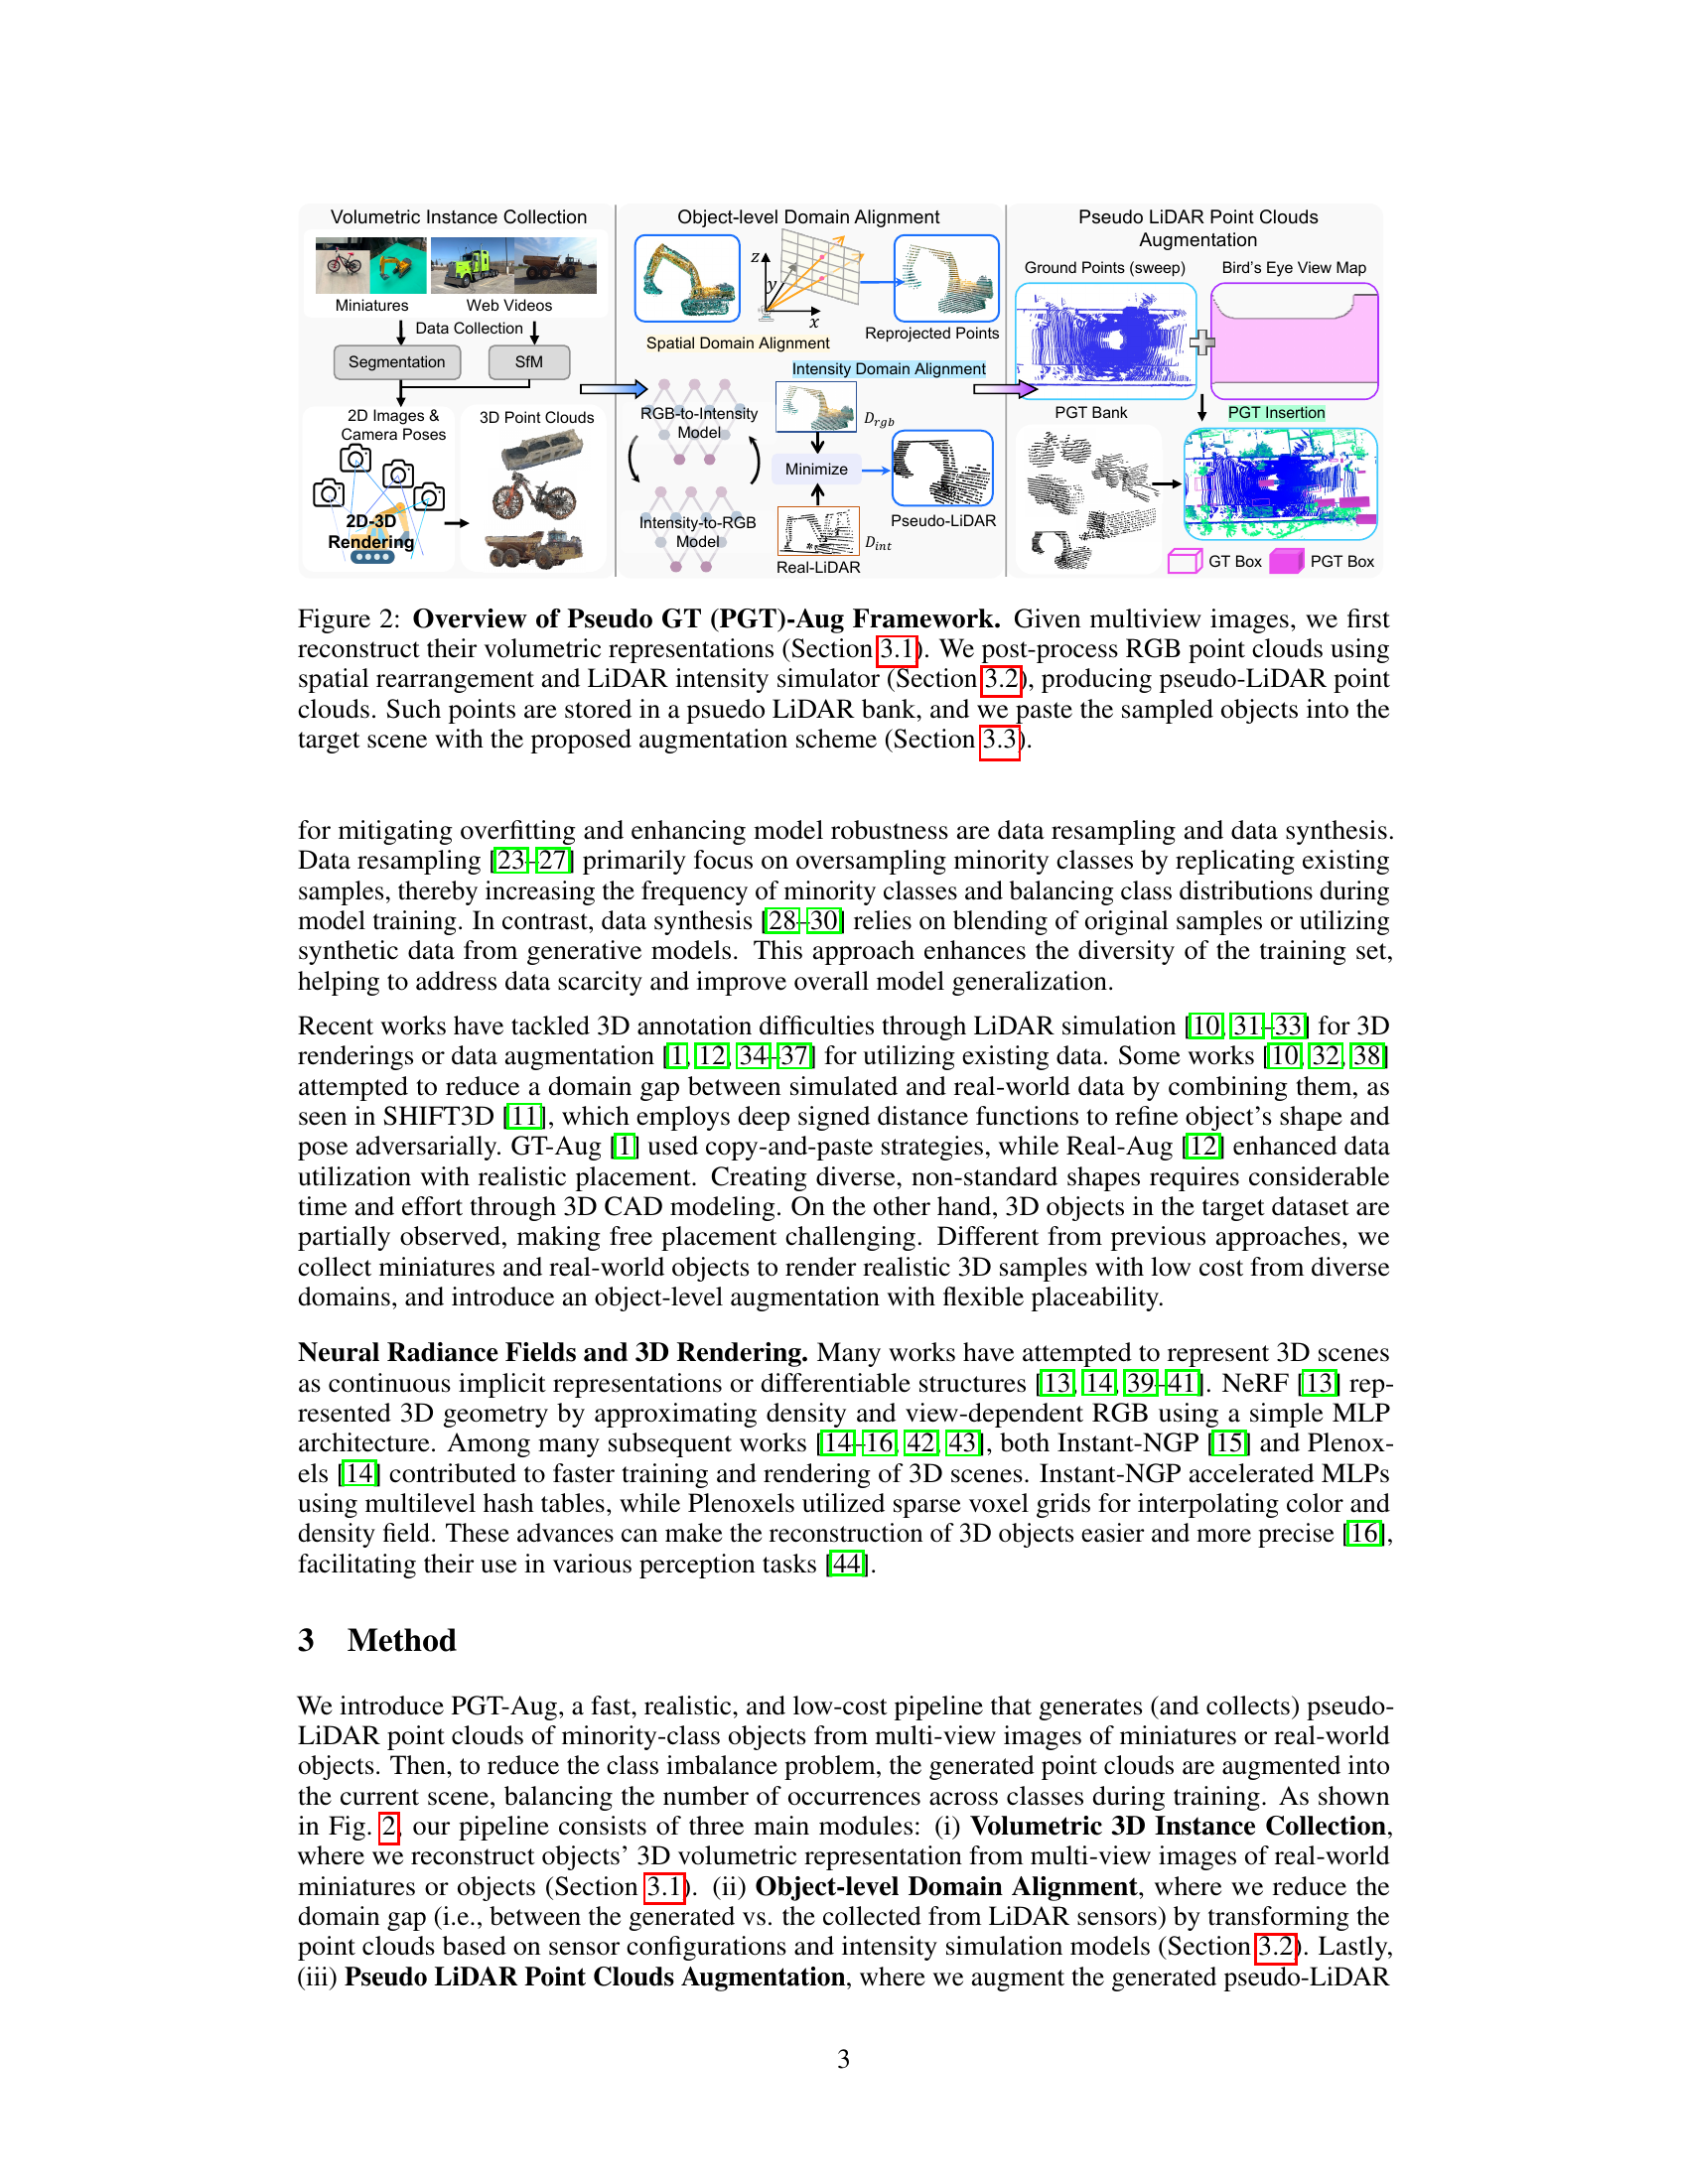
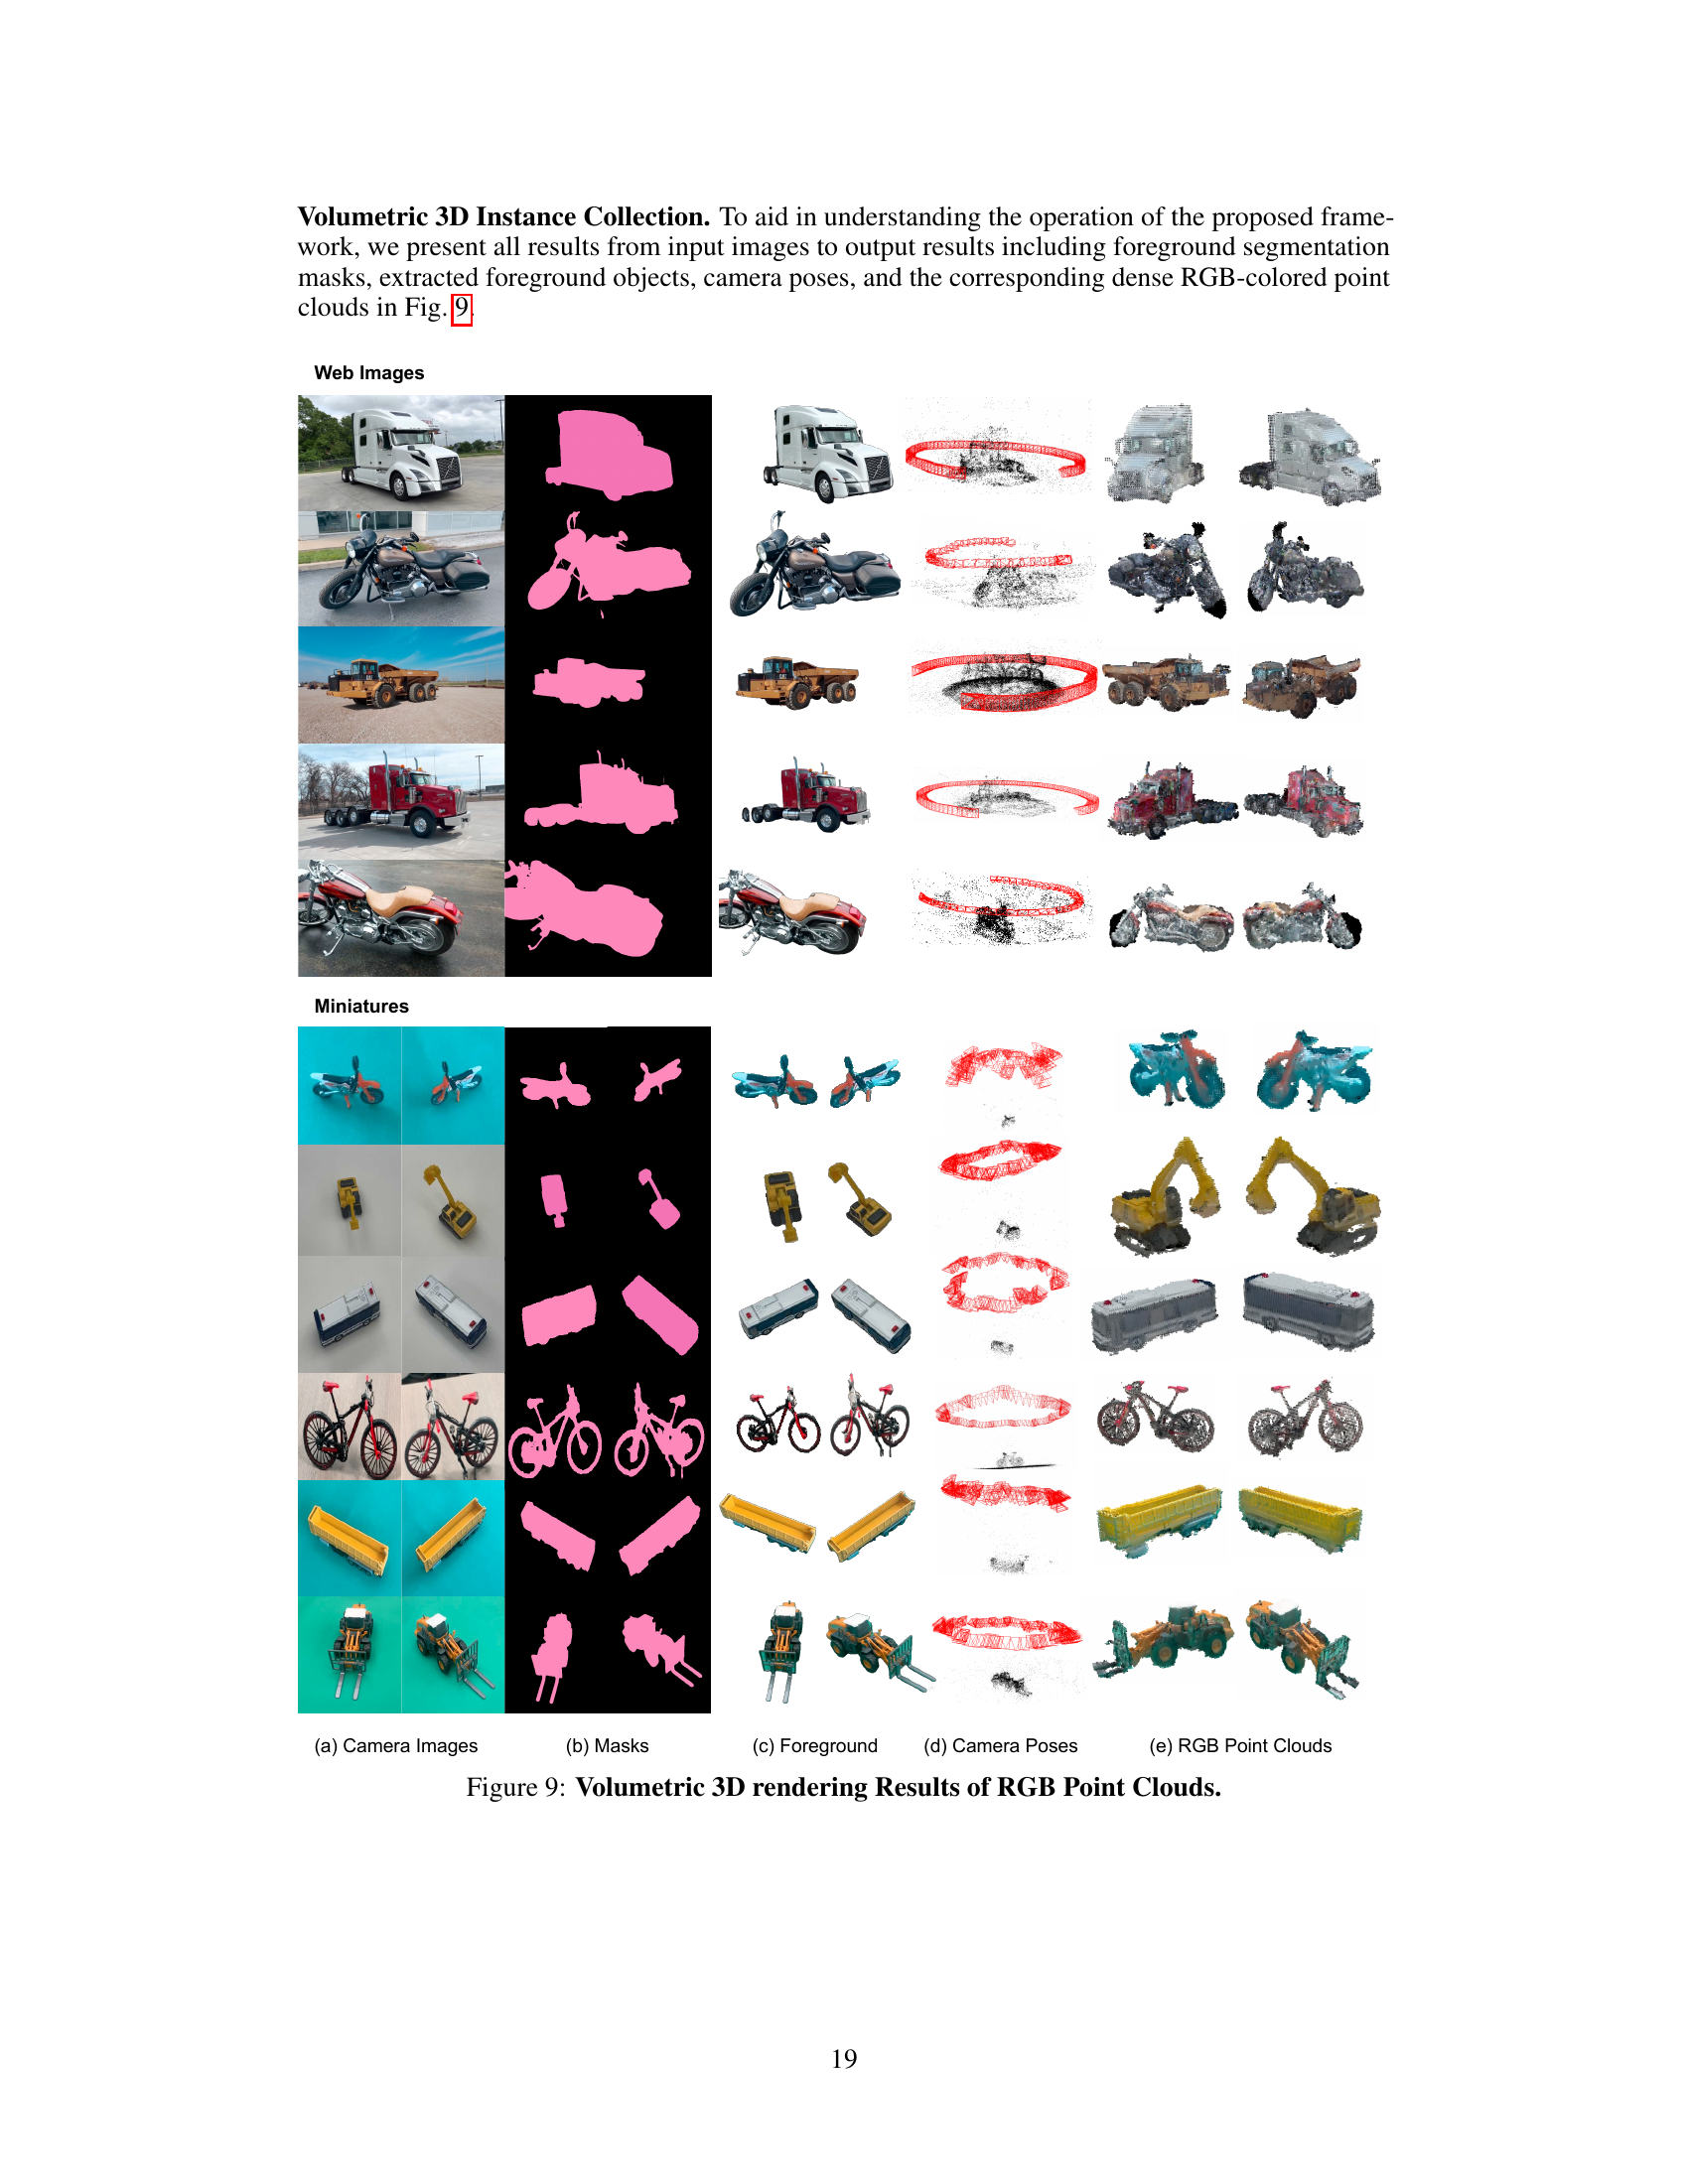
🔼 This figure illustrates the Pseudo Ground Truth Augmentation (PGT-Aug) framework. It shows the pipeline’s three main stages: (1) Volumetric 3D Instance Collection uses multiview images from miniatures and web videos to reconstruct 3D volumetric representations of objects. (2) Object-level Domain Alignment transforms the RGB point clouds into pseudo-LiDAR point clouds by simulating spatial and intensity characteristics. (3) Pseudo LiDAR Point Clouds Augmentation integrates the pseudo-LiDAR points into real scenes using a hybrid context-aware placement method. The framework generates and stores pseudo-LiDAR points in a bank for later augmentation of real LiDAR data.
read the caption
Figure 2: Overview of Pseudo GT (PGT)-Aug Framework. Given multiview images, we first reconstruct their volumetric representations (Section 3.1). We post-process RGB point clouds using spatial rearrangement and LiDAR intensity simulator (Section 3.2), producing pseudo-LiDAR point clouds. Such points are stored in a psuedo LiDAR bank, and we paste the sampled objects into the target scene with the proposed augmentation scheme (Section 3.3).
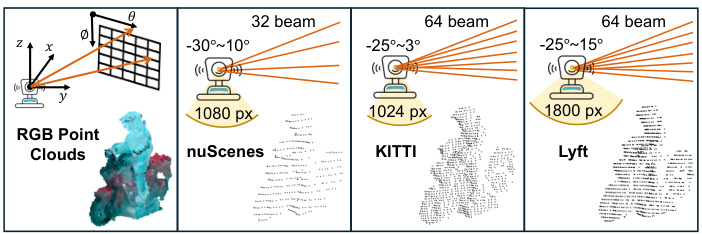
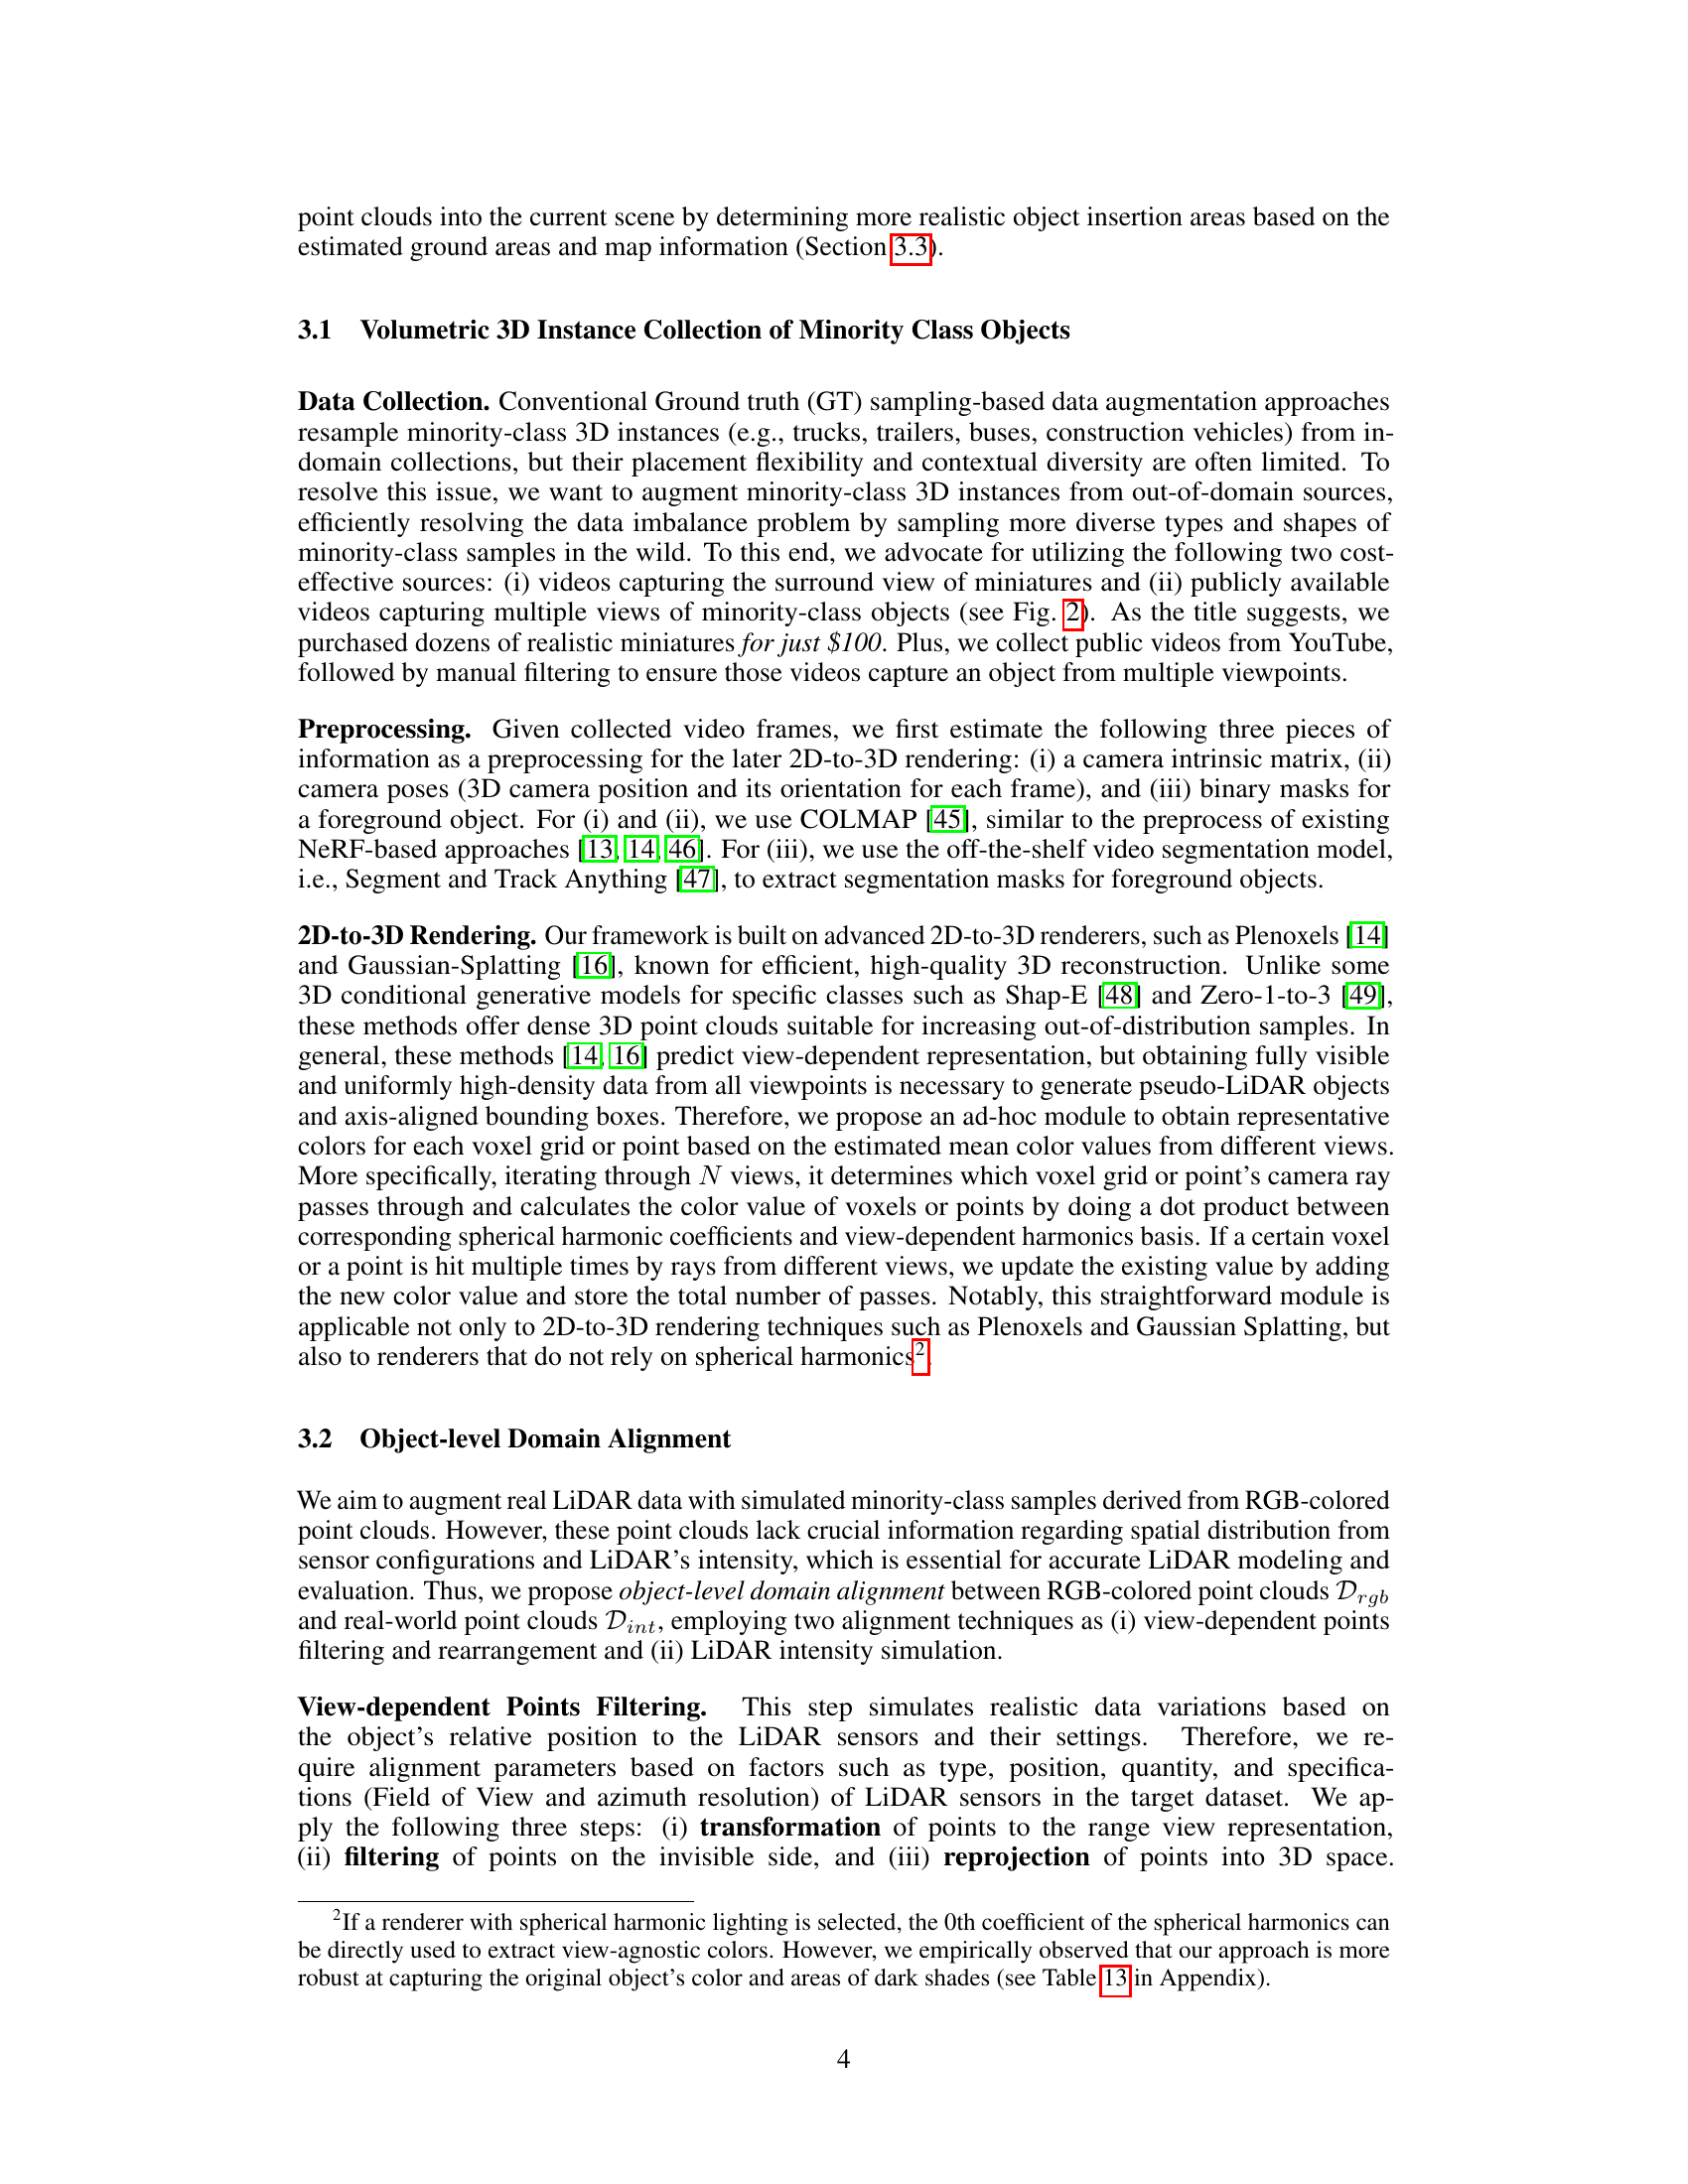
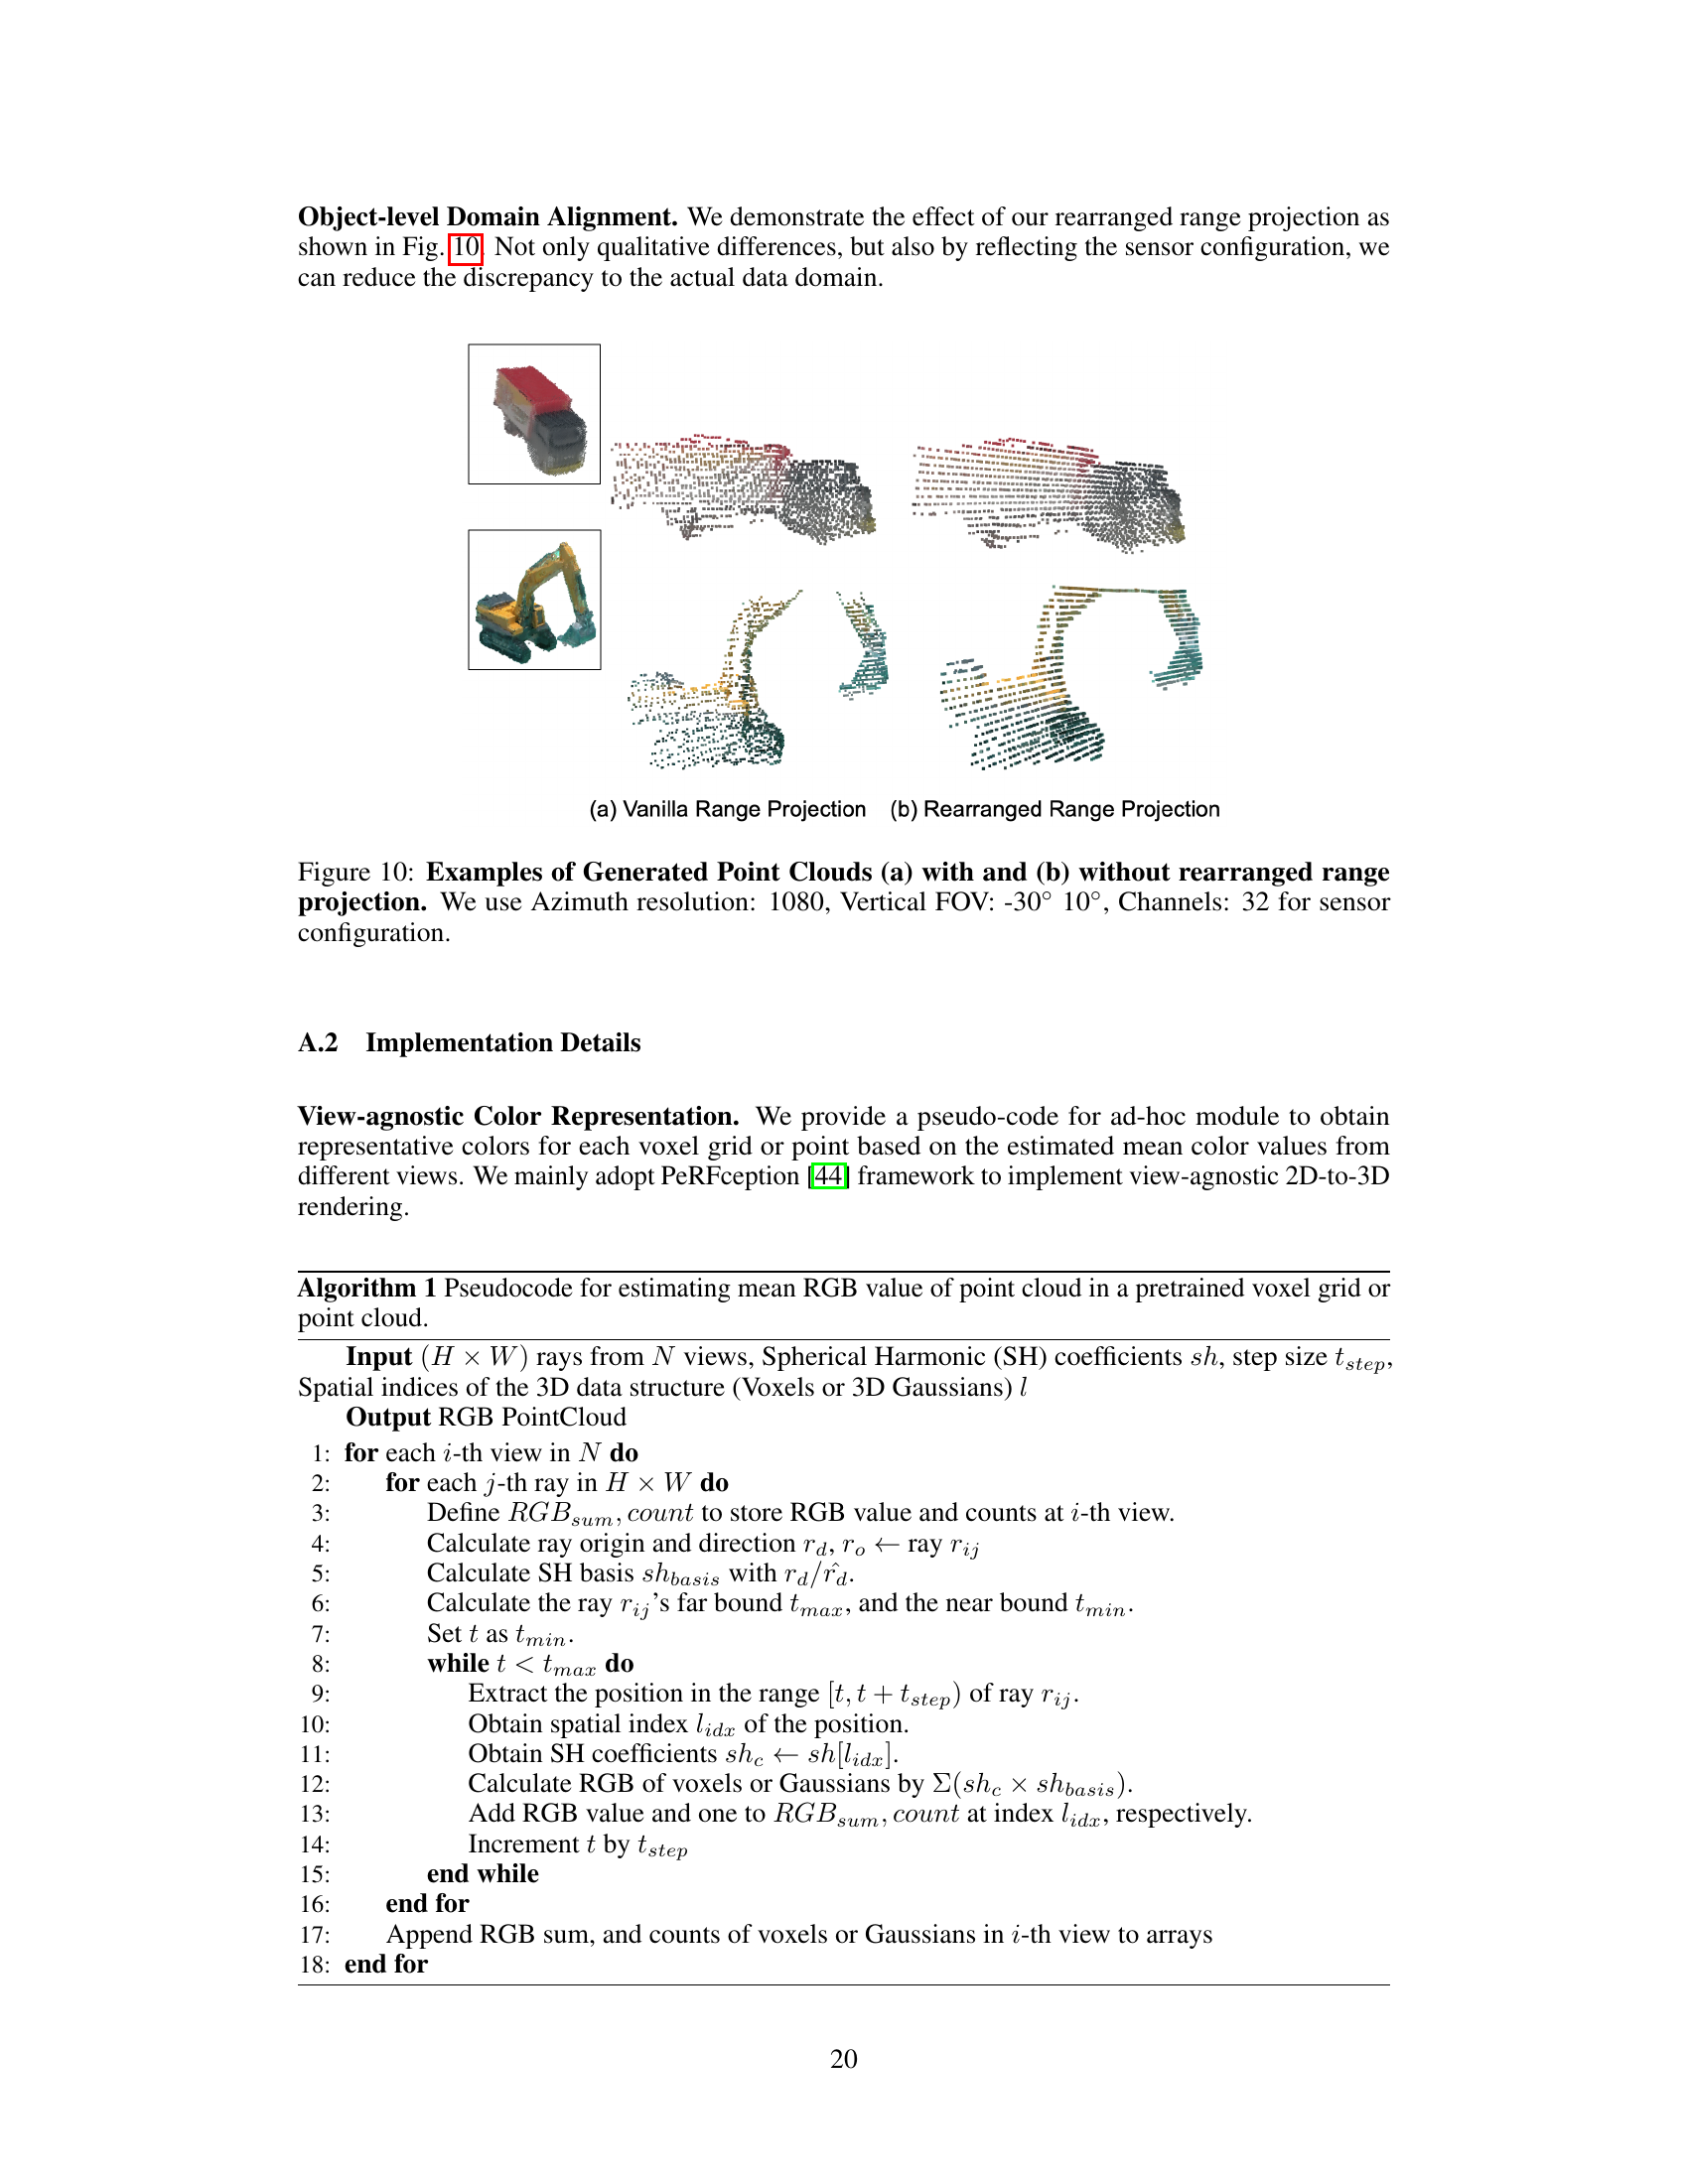
🔼 This figure shows the effect of reprojection on different LiDAR datasets (nuScenes, KITTI, and Lyft). The leftmost panel displays the original RGB point cloud. The remaining panels demonstrate how the points are reprojected into a range view representation, considering the unique field of view and azimuth resolution of each LiDAR sensor. This process simulates the realistic data variations observed in real-world LiDAR data, thereby reducing the domain gap between simulated and real-world LiDAR data.
read the caption
Figure 3: Effect of Reprojection on Different Datasets.
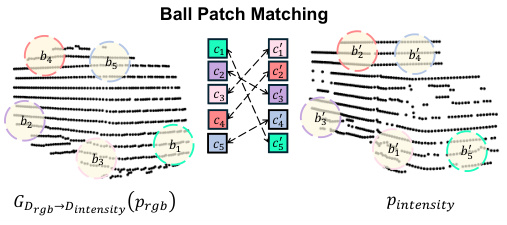
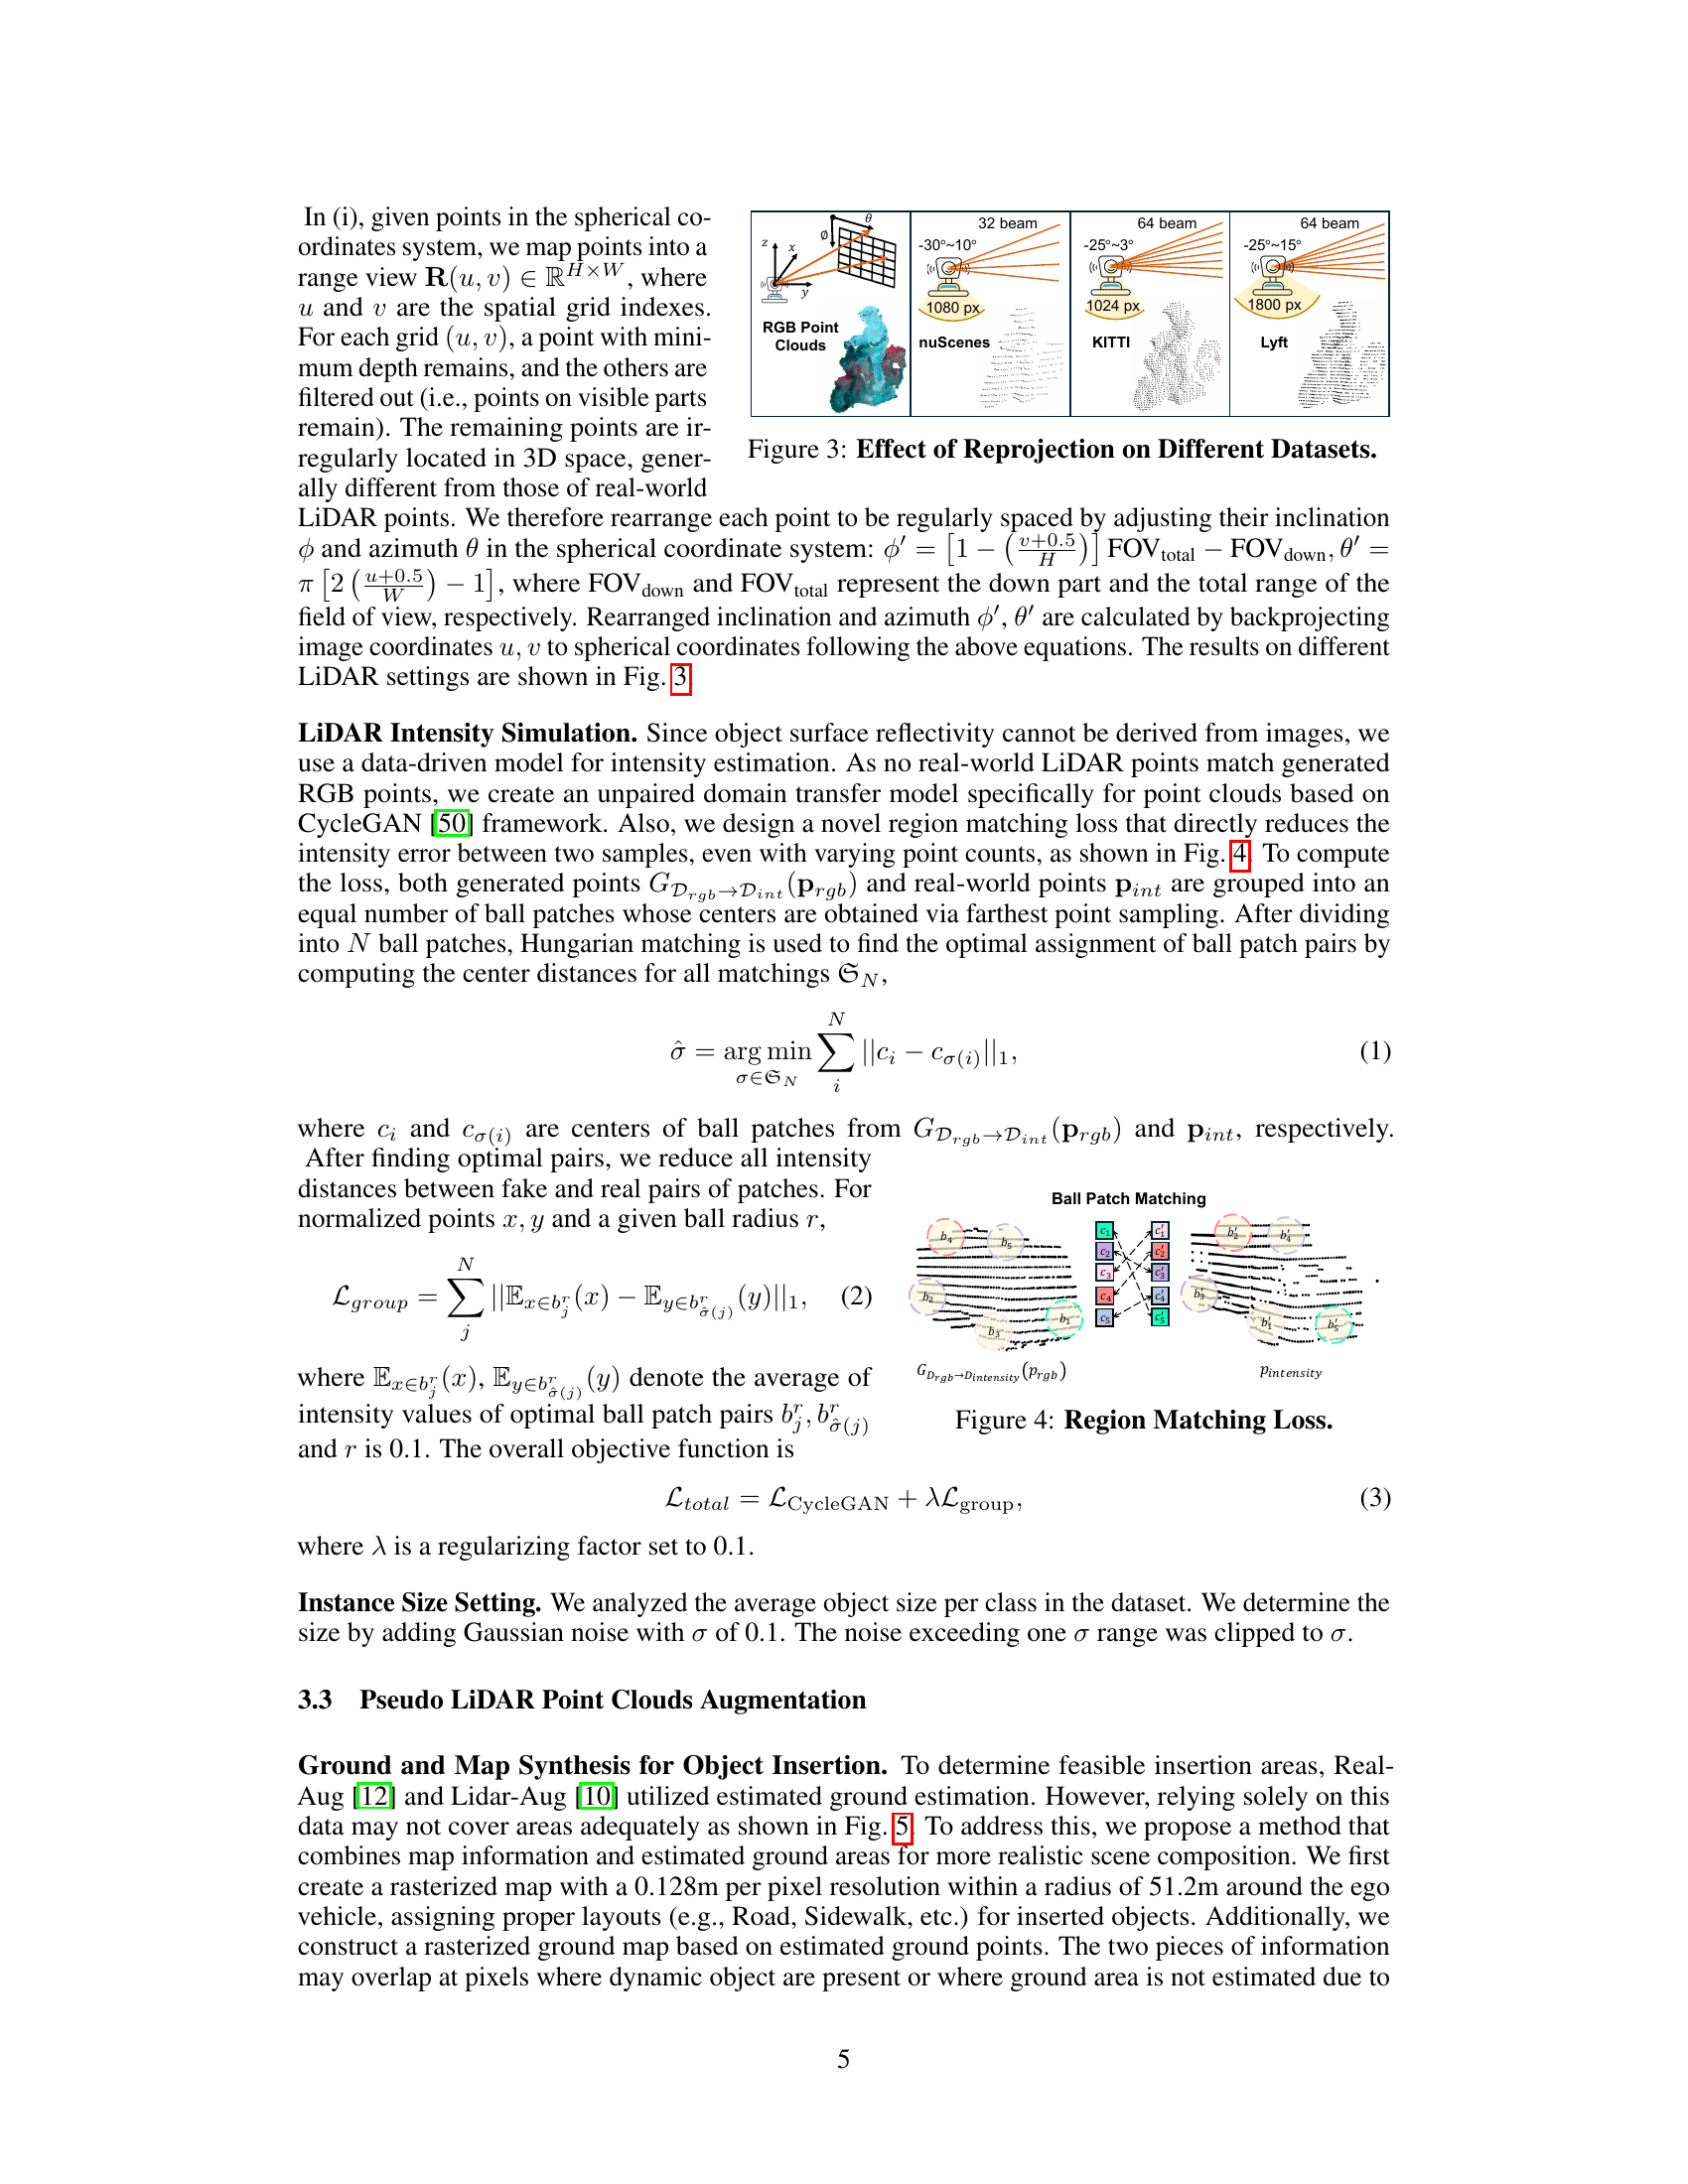
🔼 This figure illustrates the region matching loss used in the LiDAR intensity simulation module. It shows how generated points (GDrgb→Dintensity(Prgb)) and real-world points (Pintensity) are grouped into ball patches. The Hungarian matching algorithm finds the optimal assignment of these patches, and the loss is calculated based on the intensity differences between corresponding pairs of patches. This helps align the intensity values between the generated pseudo-LiDAR points and the real LiDAR points, reducing the domain gap between them.
read the caption
Figure 4: Region Matching Loss.
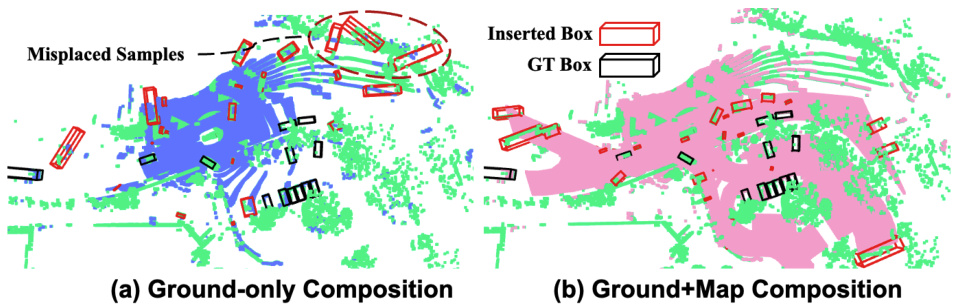
🔼 This figure compares two different approaches for inserting synthetic objects into a LiDAR point cloud scene: ground-only composition and ground+map composition. The ground-only method uses only ground estimations to determine feasible insertion areas, while the ground+map approach combines ground estimations with map information for more realistic placement. The figure shows that the ground+map method provides a broader range of feasible insertion areas and more realistic scene compositions than the ground-only approach.
read the caption
Figure 5: Comparison of Ground-only and Ground+Map Scene Composition. Blue and Pink-colored points denote the feasible location of insertion derived from (a) ground-only and (b) ground+map synthesized insertions, respectively.
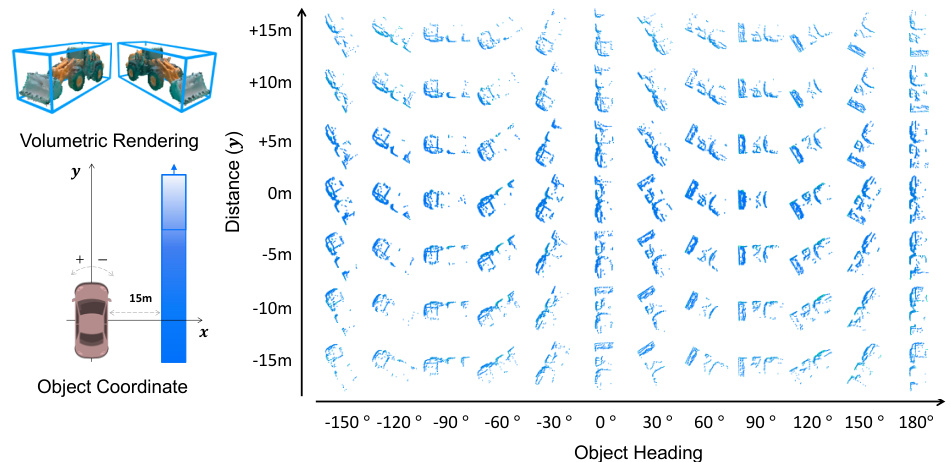
🔼 This figure shows examples of generated pseudo-LiDAR point samples. The samples demonstrate the variation in orientation (object heading) and range (distance from the sensor) that can be achieved using the proposed PGT-Aug method. This variety is crucial for effectively augmenting the training data and improving the performance of 3D object detectors on minority classes.
read the caption
Figure 6: Examples of generated pseudo-LiDAR point samples with different orientations and ranges given reconstructed 3D volumetric representations.
🔼 This figure provides a high-level comparison between existing methods and the proposed PGT-Aug method for data augmentation in LiDAR-based 3D object detection. Existing methods typically involve copying and pasting ground truth LiDAR points from other scenes, which has limitations in terms of sample diversity and suitable placement. In contrast, PGT-Aug uses pseudo-LiDAR point clouds generated from low-cost miniatures or real-world videos, offering greater flexibility and diversity. The figure visually illustrates the difference in input scene placeability between existing methods and PGT-Aug, highlighting the latter’s superior flexibility.
read the caption
Figure 1: Overview. We present PGT-Aug, a novel cost-effective pipeline that generates and augments pseudo-LiDAR samples (from miniatures and web videos) to effectively reduce the performance gap between majority-class vs. minority-class objects.
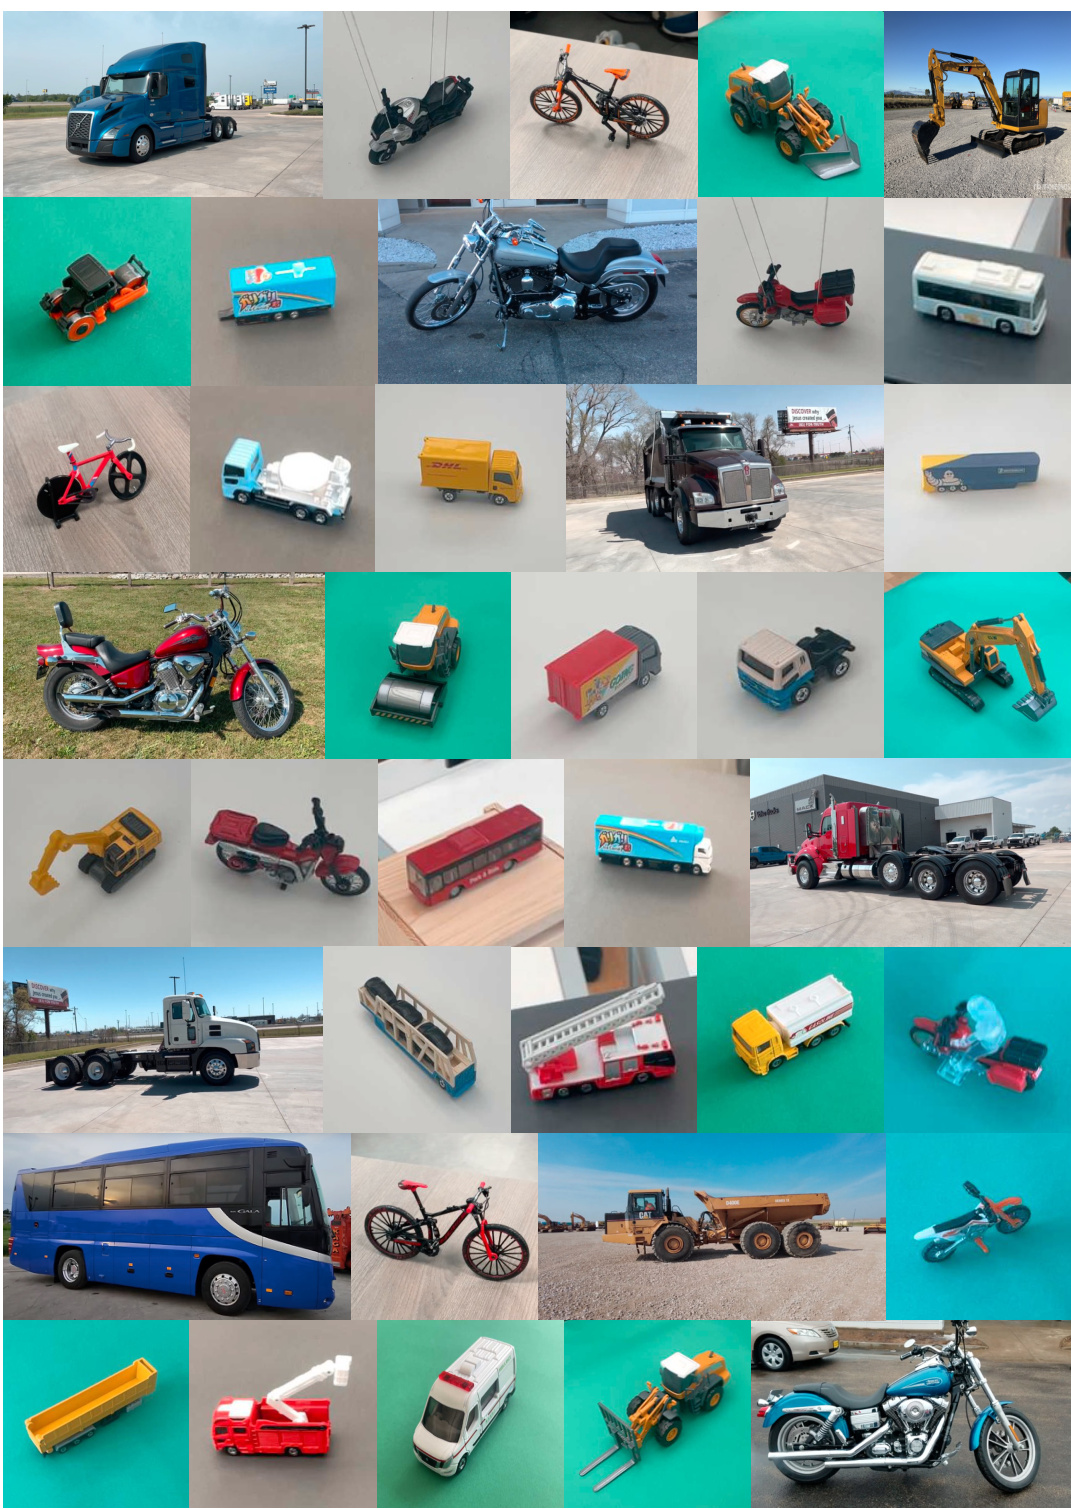
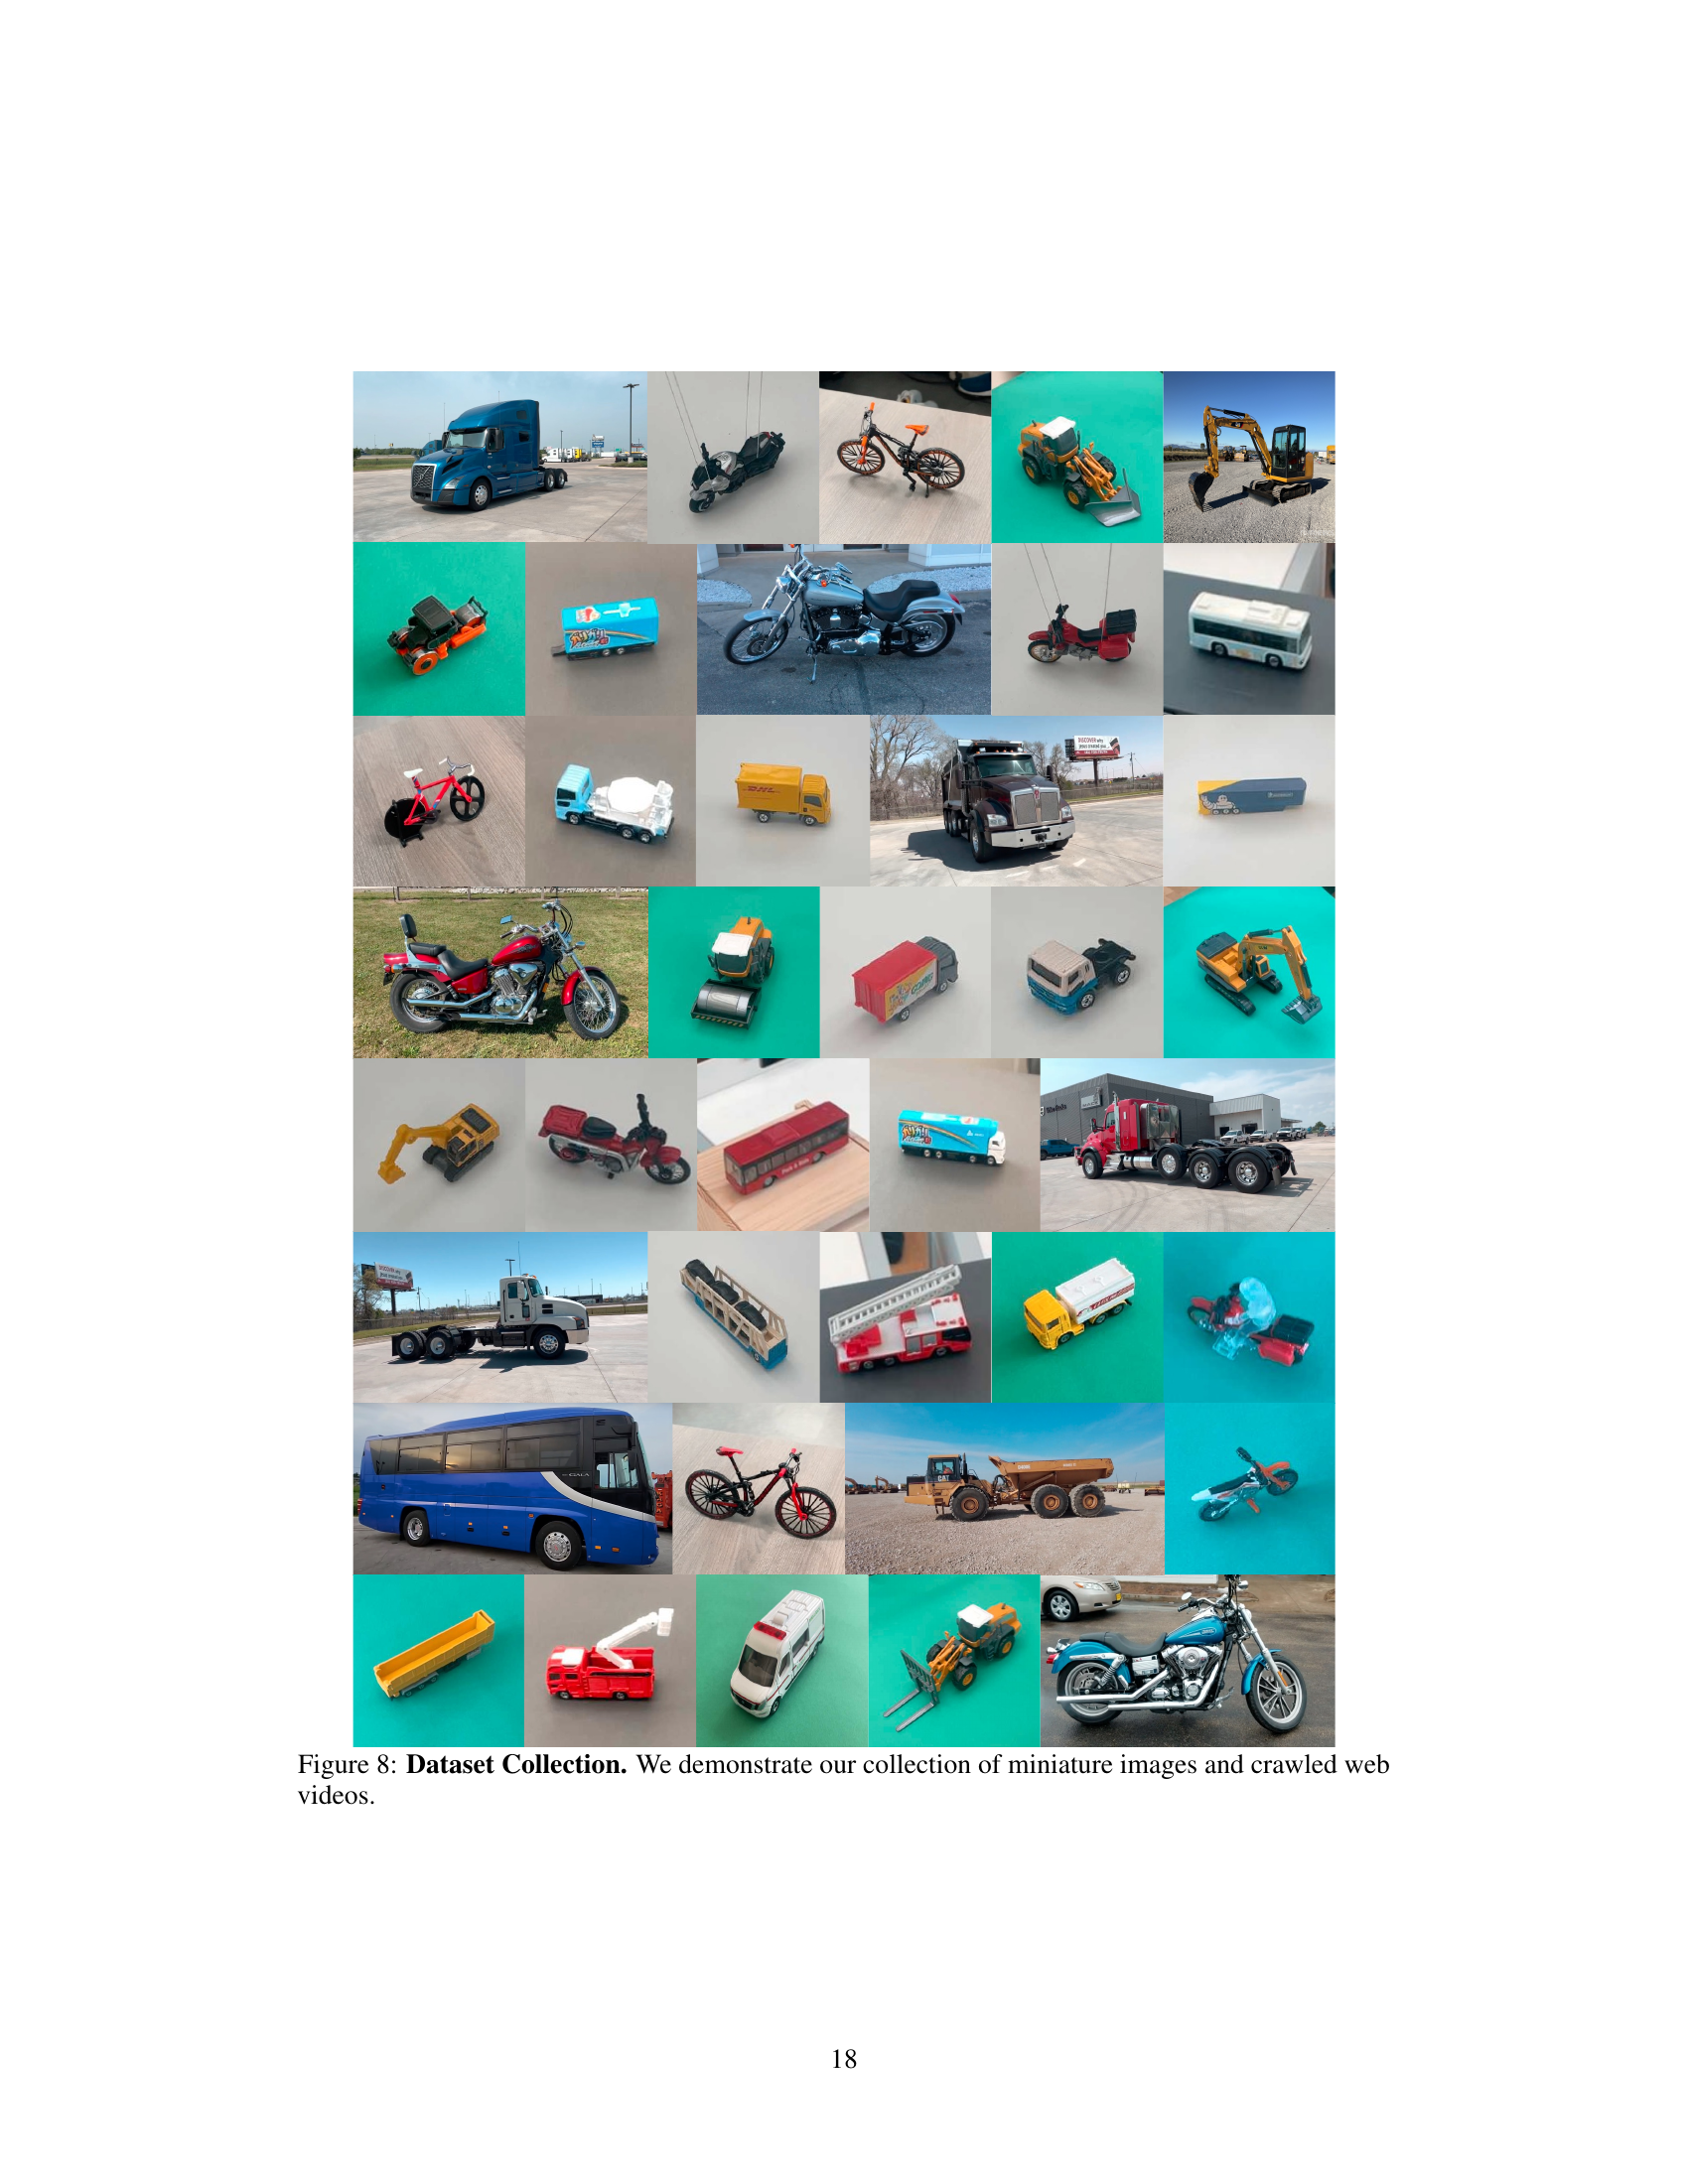
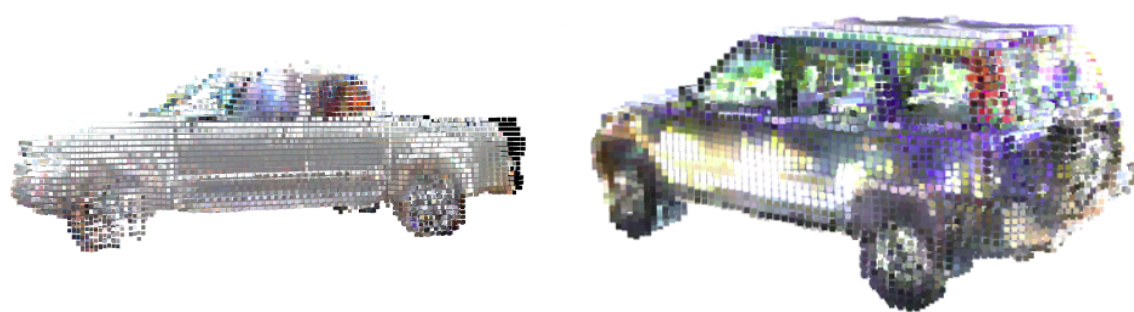
🔼 This figure shows a collection of images used in the paper’s experiments. The top half shows various miniature vehicles (cars, trucks, motorcycles, bicycles, construction equipment), while the bottom half displays images of real-world vehicles captured from web sources. These images were used to generate 3D volumetric representations of minority classes for data augmentation to address class imbalance in 3D object detection. The diversity of vehicles in the images helps to enrich the training dataset and improve the model’s ability to detect these less frequent objects.
read the caption
Figure 8: Dataset Collection. We demonstrate our collection of miniature images and crawled web videos.
🔼 This figure illustrates the Pseudo Ground Truth Augmentation (PGT-Aug) framework. It shows the three main steps: 1) Volumetric 3D instance reconstruction from multi-view images using a 2D-to-3D view synthesis model; 2) Object-level domain alignment through spatial rearrangement and LiDAR intensity simulation; and 3) Hybrid context-aware placement of the generated pseudo-LiDAR point clouds into the target scene using ground and map information. The generated point clouds are stored in a PGT bank for later use.
read the caption
Figure 2: Overview of Pseudo GT (PGT)-Aug Framework. Given multiview images, we first reconstruct their volumetric representations (Section 3.1). We post-process RGB point clouds using spatial rearrangement and LiDAR intensity simulator (Section 3.2), producing pseudo-LiDAR point clouds. Such points are stored in a psuedo LiDAR bank, and we paste the sampled objects into the target scene with the proposed augmentation scheme (Section 3.3).

🔼 This figure illustrates the Pseudo Ground Truth Augmentation (PGT-Aug) framework. It shows the process of collecting multi-view images, reconstructing volumetric representations using a 2D-to-3D view synthesis model, aligning object-level domains with LiDAR intensity simulation, and placing the resulting pseudo-LiDAR point clouds into target scenes using a hybrid context-aware placement method. The framework involves three key steps: Volumetric Instance Collection, Object-level Domain Alignment, and Pseudo LiDAR Point Clouds Augmentation. The generated point clouds are stored in a pseudo LiDAR bank for later use in augmentation.
read the caption
Figure 2: Overview of Pseudo GT (PGT)-Aug Framework. Given multiview images, we first reconstruct their volumetric representations (Section 3.1). We post-process RGB point clouds using spatial rearrangement and LiDAR intensity simulator (Section 3.2), producing pseudo-LiDAR point clouds. Such points are stored in a psuedo LiDAR bank, and we paste the sampled objects into the target scene with the proposed augmentation scheme (Section 3.3).
🔼 This figure provides a high-level comparison of existing data augmentation methods and the proposed PGT-Aug method. Existing methods typically involve copying and pasting LiDAR points from other scenes. This approach is limited by the lack of sample diversity and suitable placement for minority classes. In contrast, PGT-Aug generates pseudo-LiDAR samples from miniatures and web videos and incorporates them into the scene flexibly. This process leads to a greater diversity of samples and enhanced placement flexibility, resulting in improved performance, especially for minority classes.
read the caption
Figure 1: Overview. We present PGT-Aug, a novel cost-effective pipeline that generates and augments pseudo-LiDAR samples (from miniatures and web videos) to effectively reduce the performance gap between majority-class vs. minority-class objects.
🔼 This figure shows a collection of images used in the paper’s dataset. The images depict various miniature models of vehicles (cars, trucks, motorcycles, bicycles, construction equipment) and real-world vehicles from public web sources. These images were used in the volumetric 3D instance collection process of the proposed PGT-Aug framework for augmenting pseudo-LiDAR point clouds to resolve class imbalance issues in object detection.
read the caption
Figure 8: Dataset Collection. We demonstrate our collection of miniature images and crawled web videos.
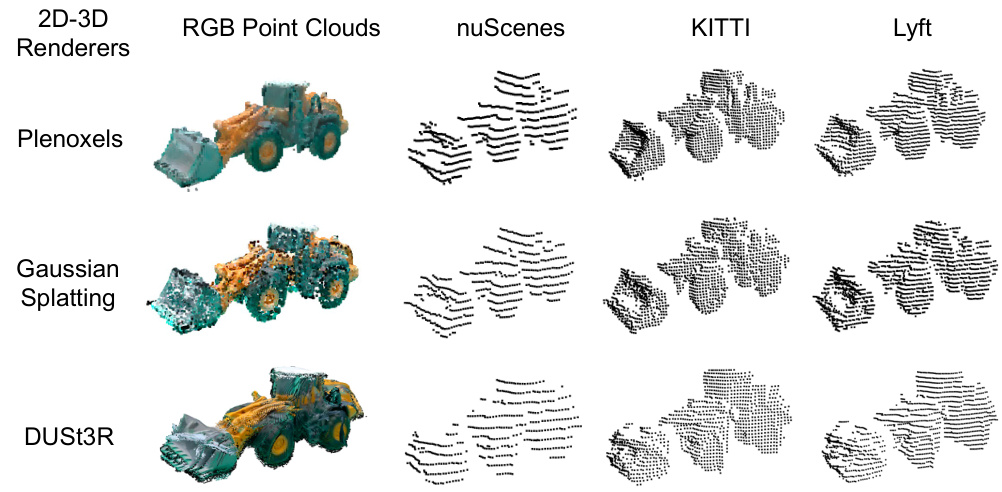
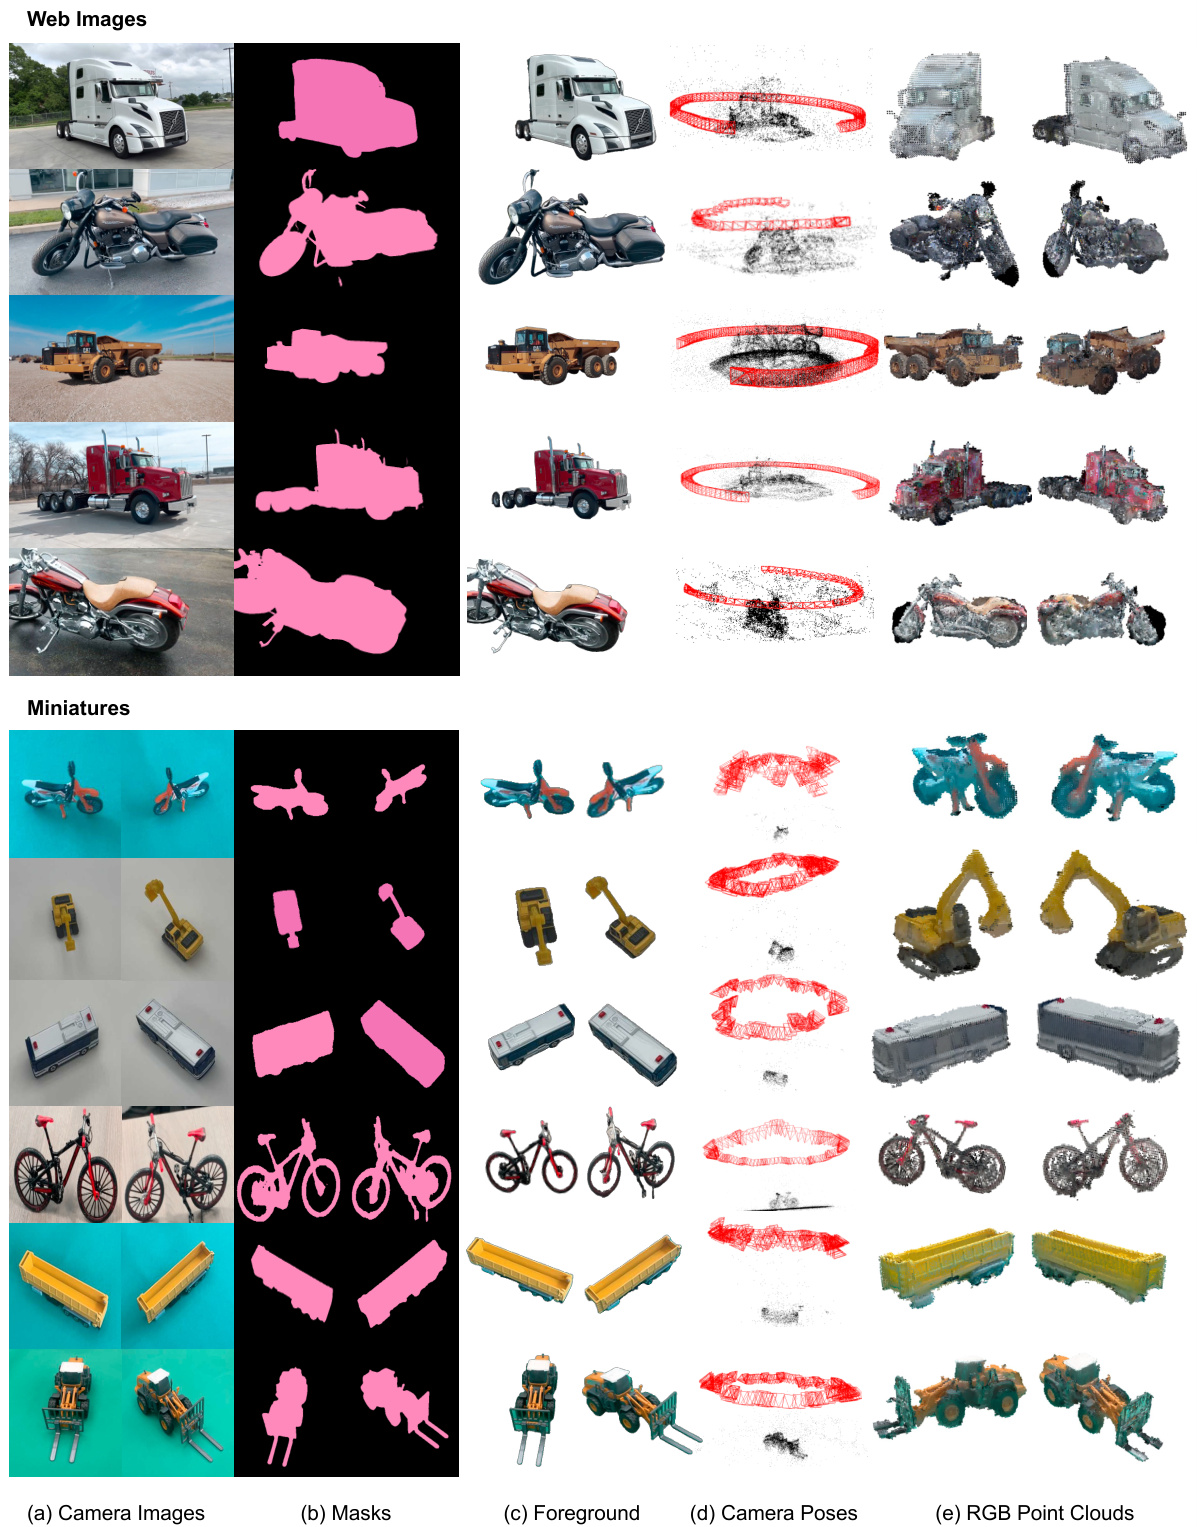
🔼 This figure shows the RGB point clouds and the generated pseudo LiDAR point clouds from various 2D-to-3D renderers (Plenoxels, Gaussian Splatting, and DUSt3R) for different datasets (nuScenes, KITTI, and Lyft). It visually demonstrates the consistency of the proposed framework in generating high-quality LiDAR objects, regardless of the underlying 3D rendering technique used.
read the caption
Figure 13: Examples of RGB Point Clouds and Generated Pseudo LiDAR from Various 2D to 3D Renderers.
More on tables
🔼 This table presents a comparison of object detection performance on the nuScenes validation set using different data augmentation and object placement strategies. The results are measured using Average Precision (AP), mean Average Precision (mAP), and NuScenes Detection Score (NDS). The table compares the performance of the baseline CV-Voxel model against modifications including random object placement, ground-based placement, and the proposed ground+map-based placement. It also shows the impact of incorporating pseudo-LiDAR samples generated by the proposed method.
read the caption
Table 1: Detection performance comparison on nuScenes val set in terms of AP, mAP, and NDS. Based on CV-Voxel [5], we compare different placement methods, such as random [1], ground-based [12], and our placement. We also report the effect of using our pseudo-LiDAR samples.
🔼 This table presents a comparison of object detection performance on the nuScenes validation set using different data augmentation and object placement techniques. It compares the performance of a baseline model (CV-Voxel) with various augmentation methods (random placement, ground-based placement, and the proposed Ground+Map-based placement), both with and without the addition of pseudo-LiDAR samples generated by the proposed method. The metrics used for comparison are Average Precision (AP), mean Average Precision (mAP), and NuScenes Detection Score (NDS). The results highlight the effectiveness of the proposed method in improving detection performance, particularly for minority classes.
read the caption
Table 1: Detection performance comparison on nuScenes val set in terms of AP, mAP, and NDS. Based on CV-Voxel [5], we compare different placement methods, such as random [1], ground-based [12], and our placement. We also report the effect of using our pseudo-LiDAR samples.
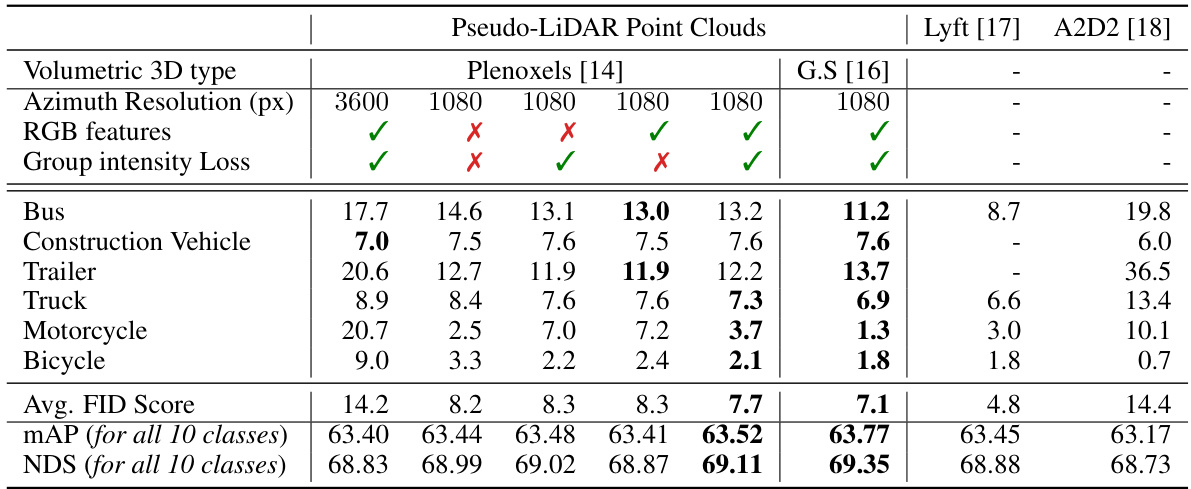
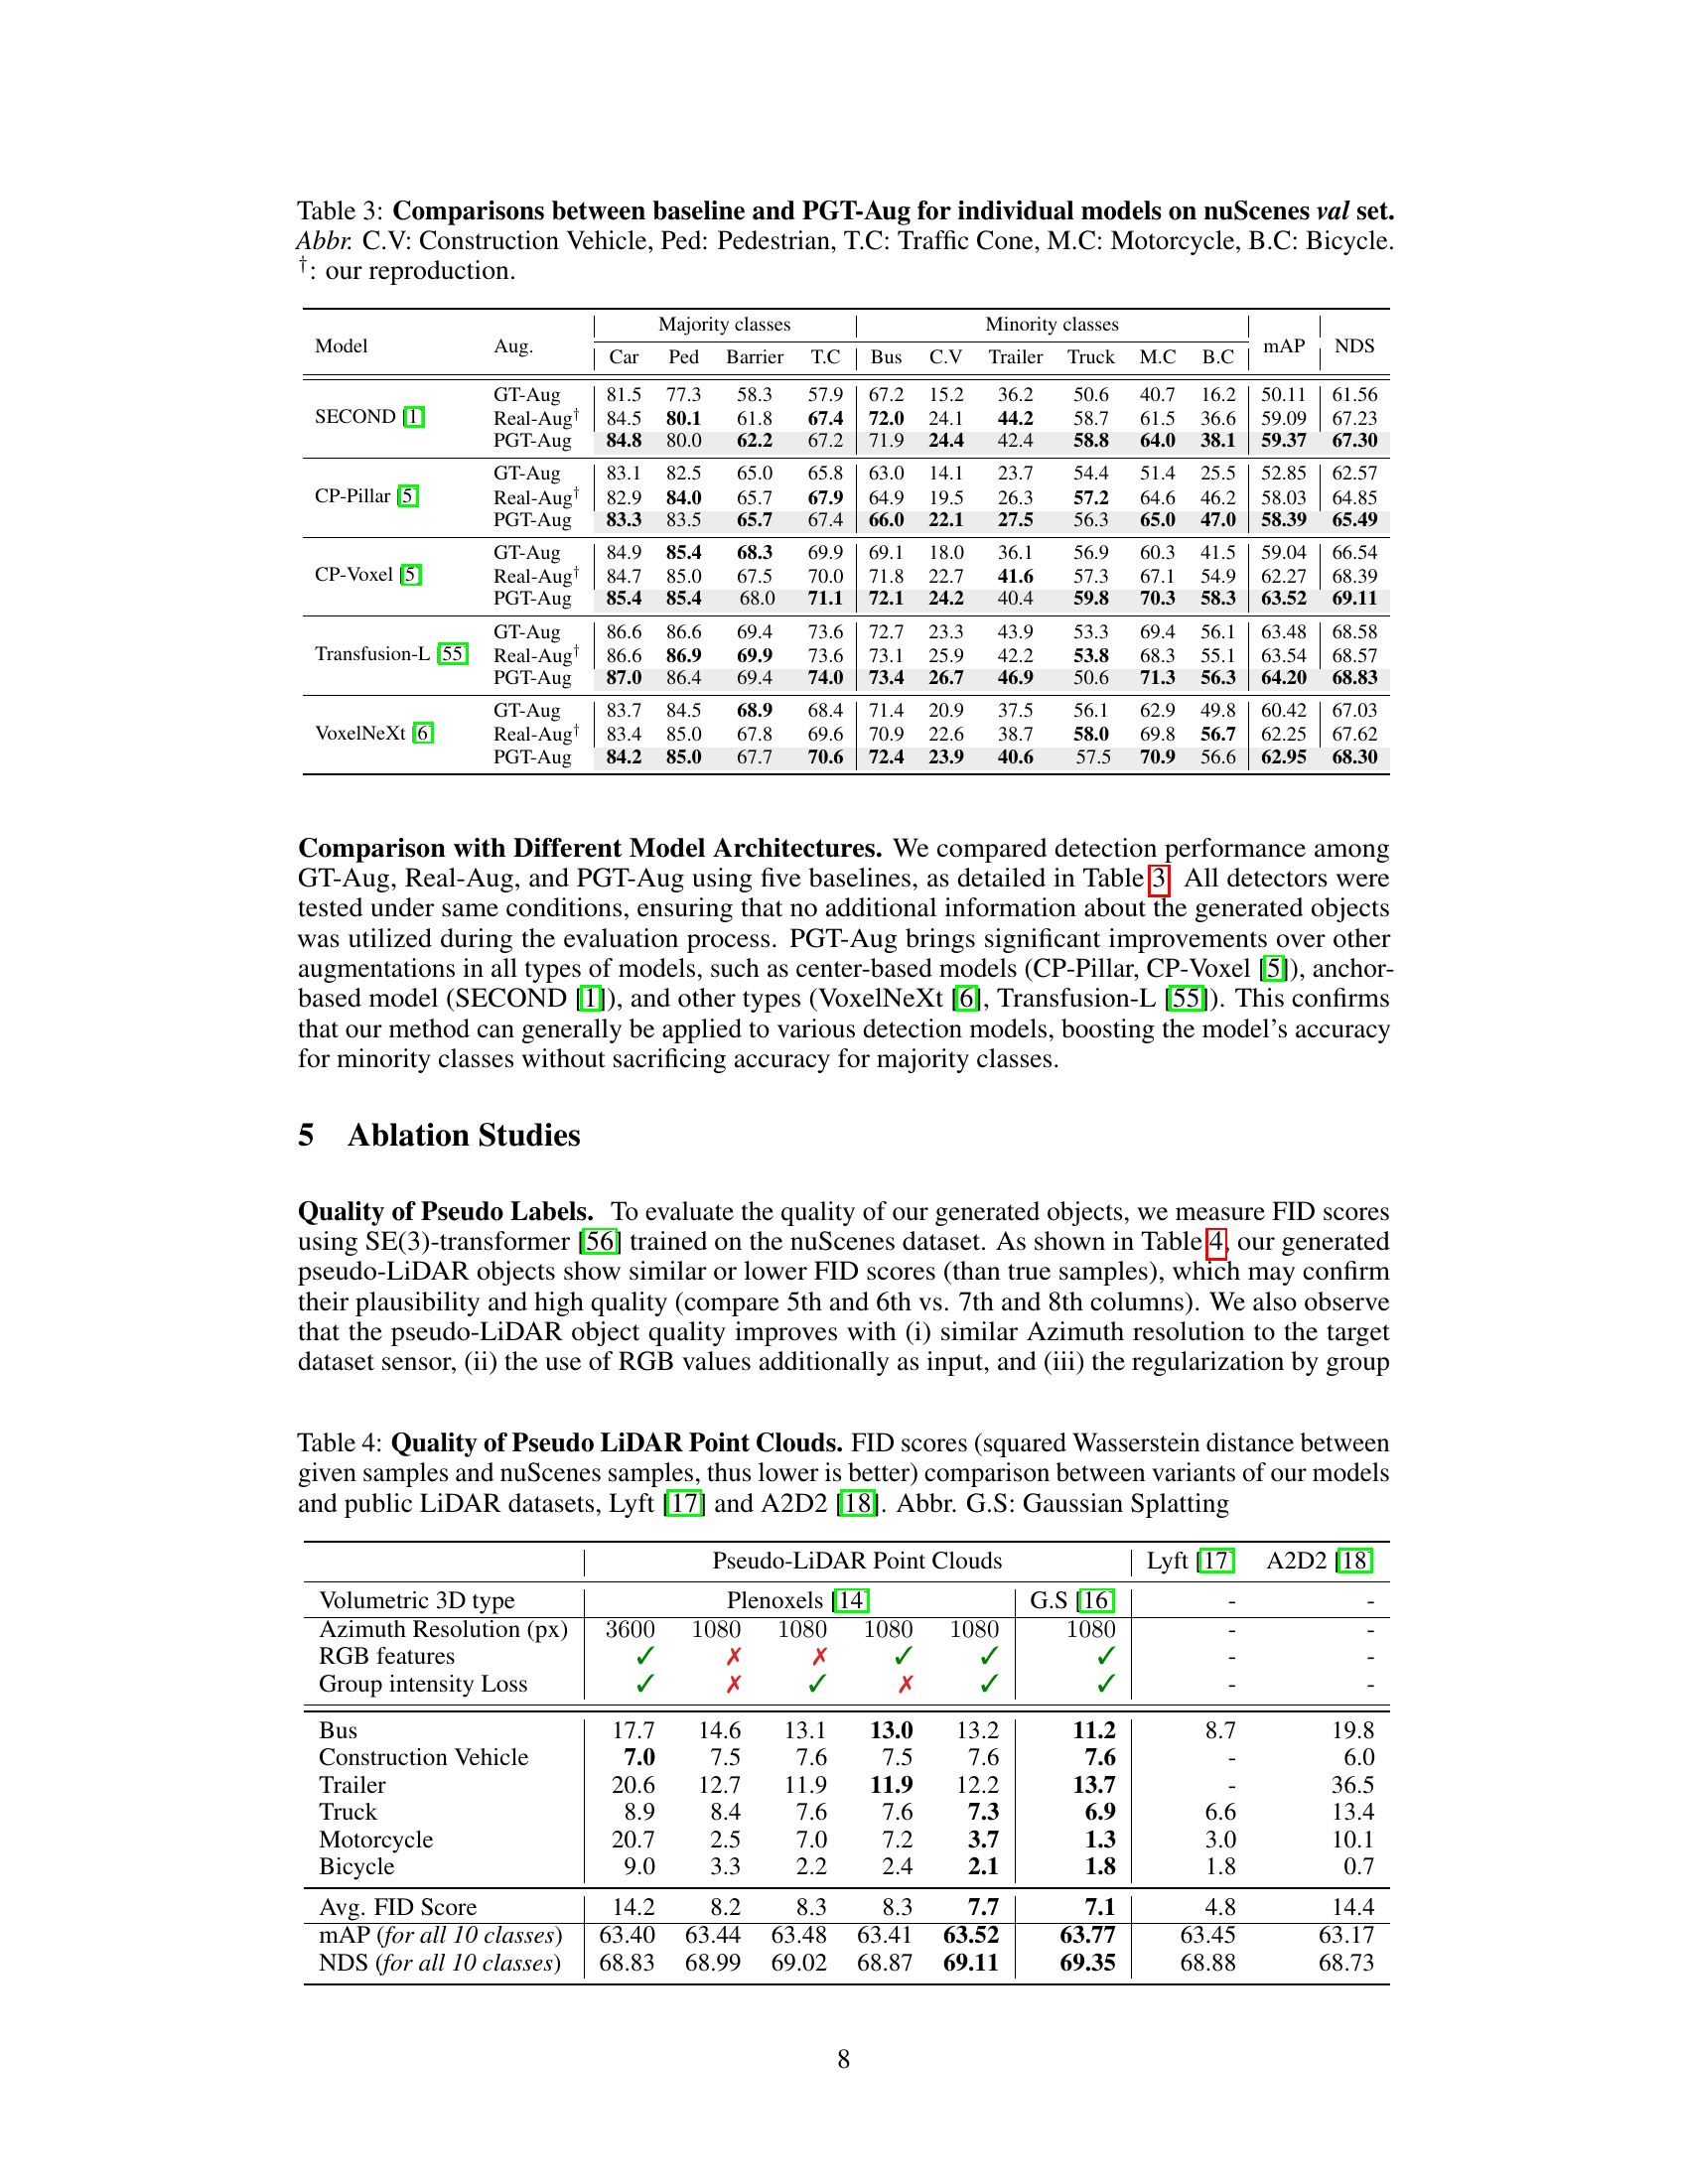
🔼 This table presents the FID (Fréchet Inception Distance) scores, comparing the quality of generated pseudo-LiDAR point clouds against real LiDAR data from the nuScenes dataset, as well as public Lyft and A2D2 datasets. Lower FID scores indicate higher similarity to real data. The table analyzes the impact of different factors on the quality of the generated point clouds, such as the type of volumetric 3D rendering method used (Plenoxels or Gaussian Splatting), azimuth resolution, inclusion of RGB features, and the use of group intensity loss. Results are broken down by object class (Bus, Construction Vehicle, etc.) and overall metrics (average FID, mAP, and NDS).
read the caption
Table 4: Quality of Pseudo LiDAR Point Clouds. FID scores (squared Wasserstein distance between given samples and nuScenes samples, thus lower is better) comparison between variants of our models and public LiDAR datasets, Lyft [17] and A2D2 [18]. Abbr. G.S: Gaussian Splatting
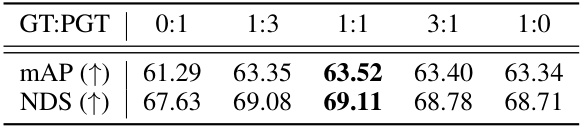
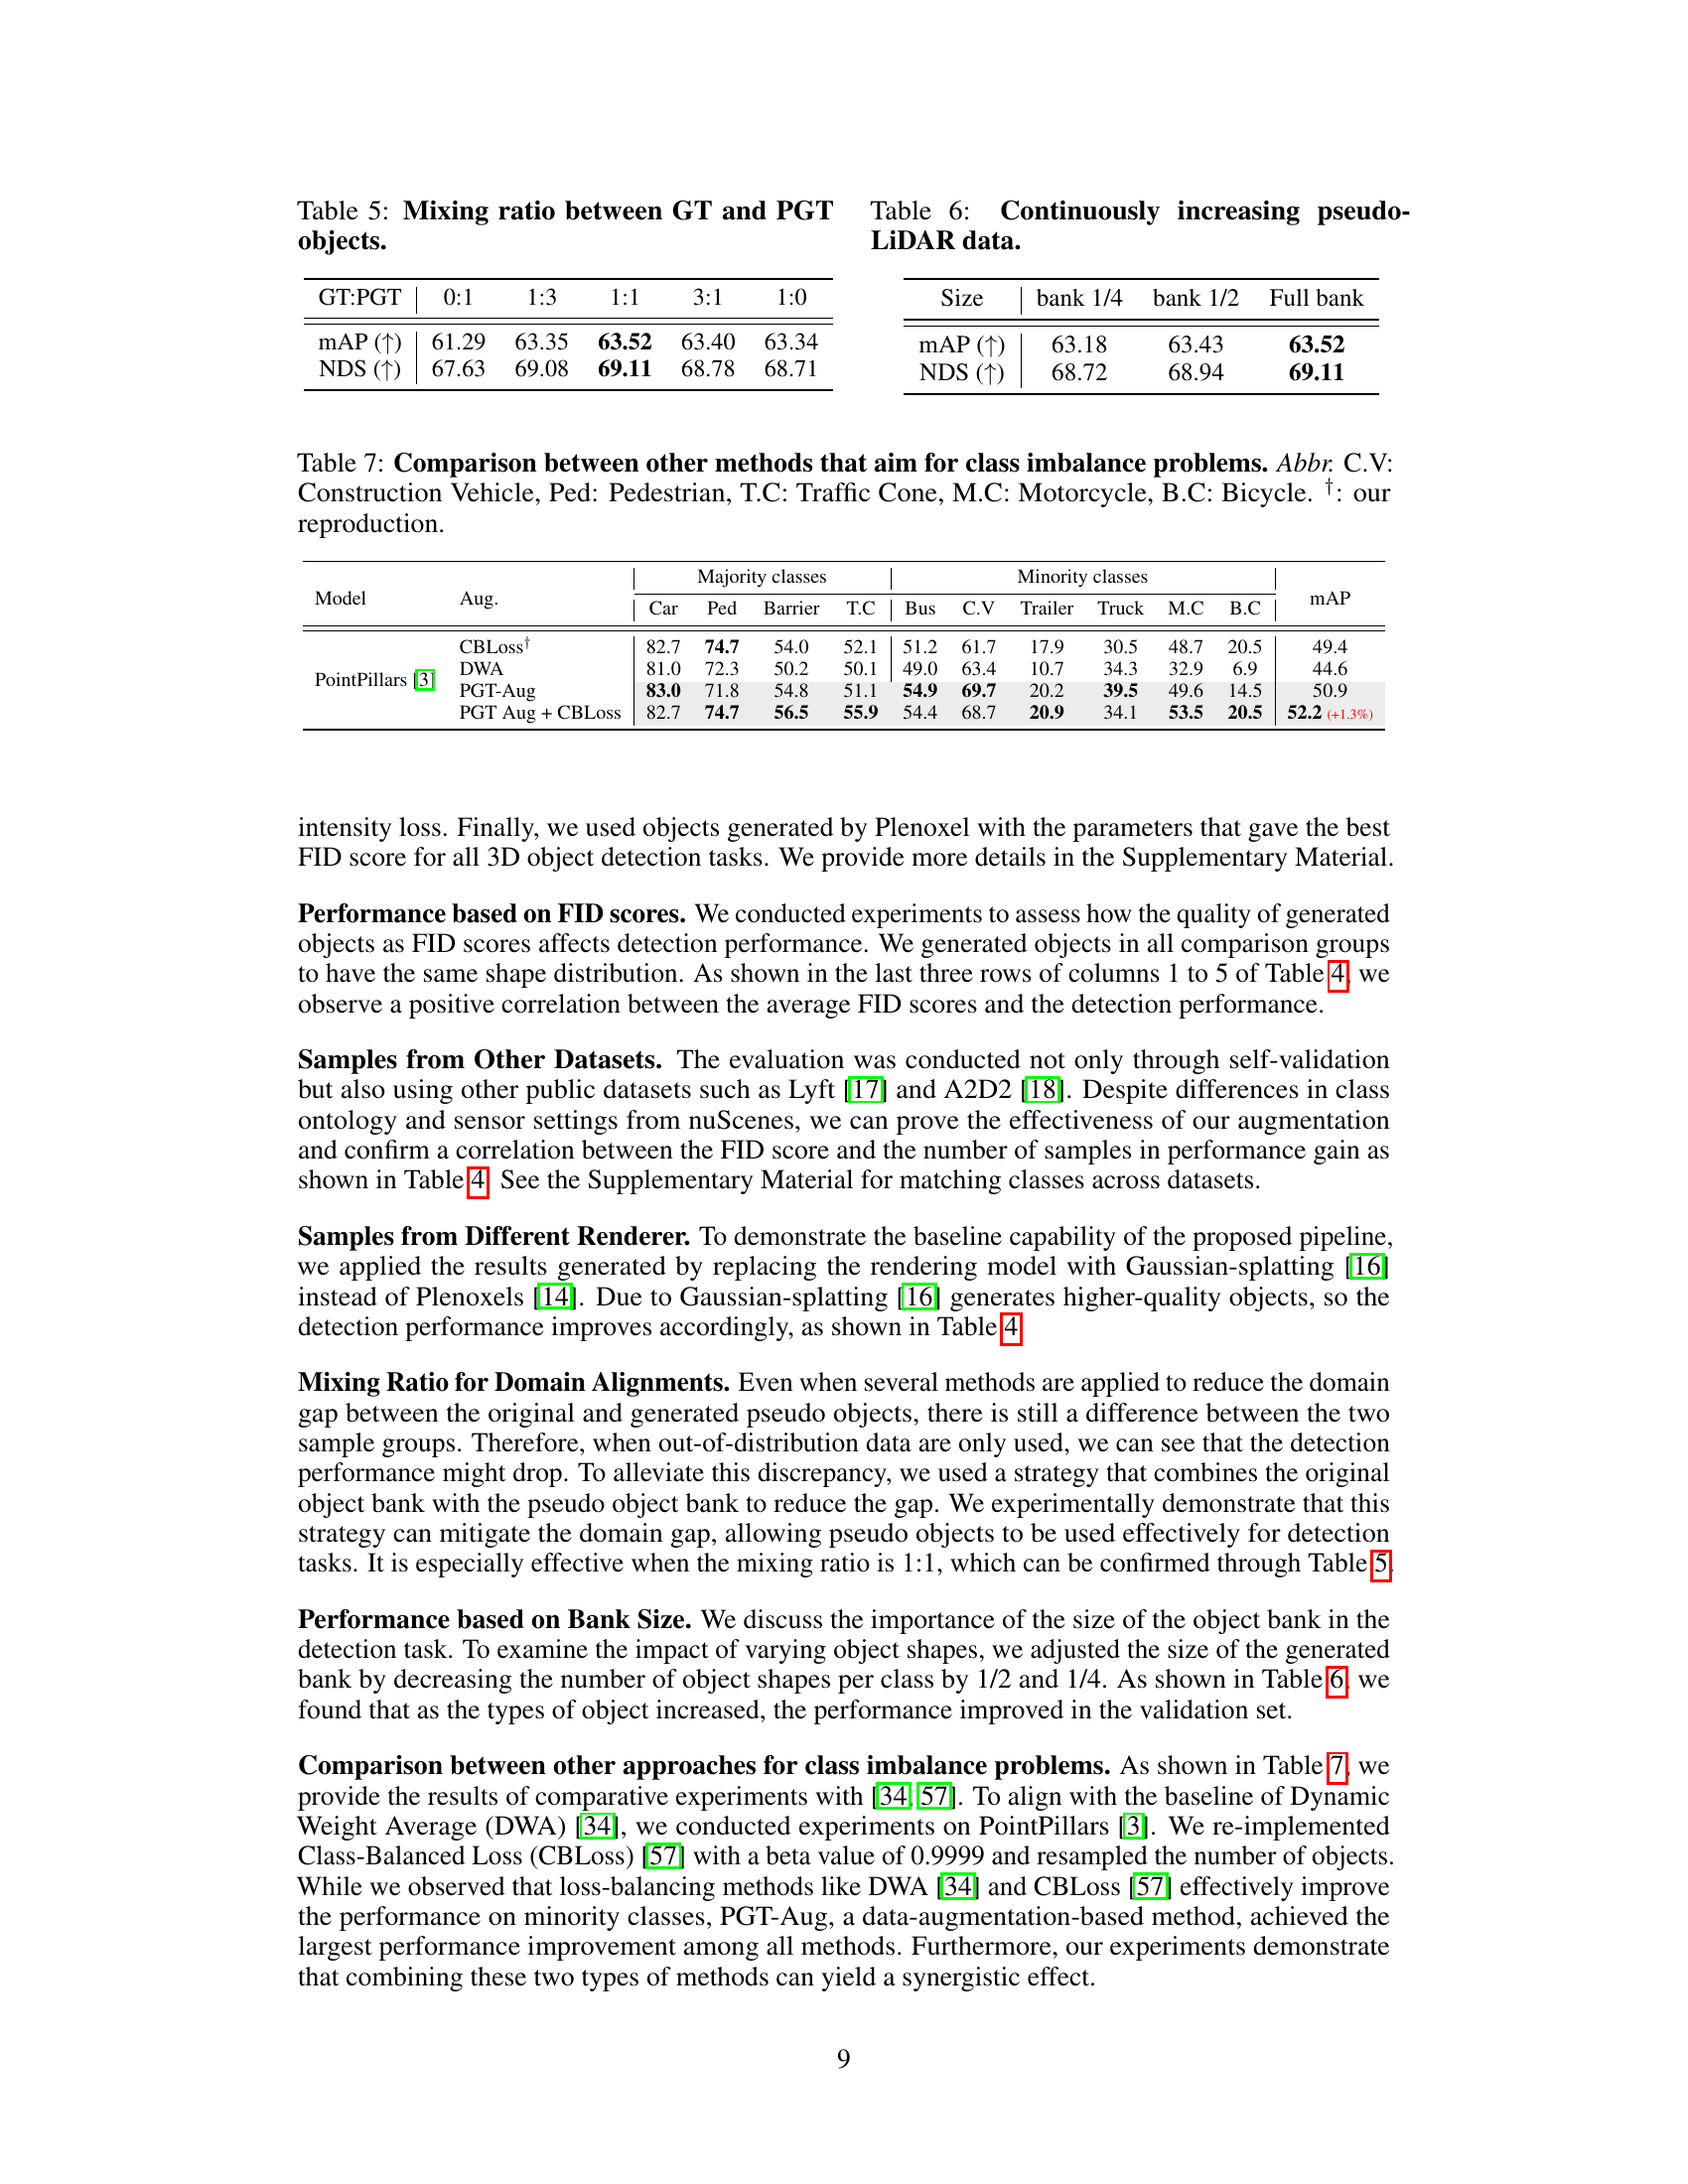
🔼 This table presents the results of an experiment to determine the optimal mixing ratio between ground truth (GT) objects and pseudo ground truth (PGT) objects in a 3D object detection task. Different ratios of GT:PGT objects were tested (0:1, 1:3, 1:1, 3:1, 1:0), and the resulting mean Average Precision (mAP) and NuScenes Detection Score (NDS) are shown. The best performance is observed with a 1:1 ratio of GT:PGT objects.
read the caption
Table 5: Mixing ratio between GT and PGT objects.
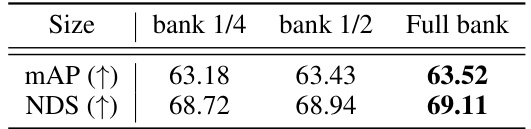
🔼 This table shows the mean Average Precision (mAP) and NuScenes Detection Score (NDS) on the nuScenes validation set when using different sizes of the pseudo-LiDAR object bank. The results demonstrate that continuously increasing the size of the pseudo-LiDAR object bank leads to improved performance.
read the caption
Table 6: Continuously increasing pseudo-LiDAR data.
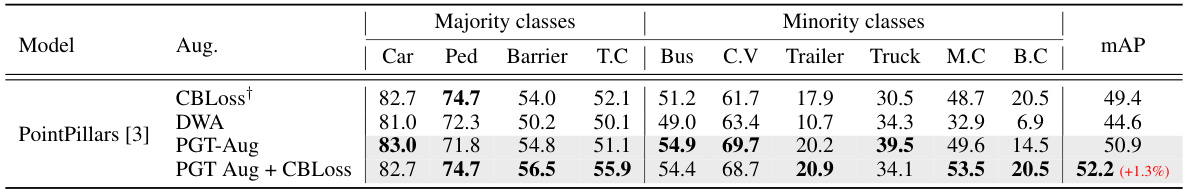
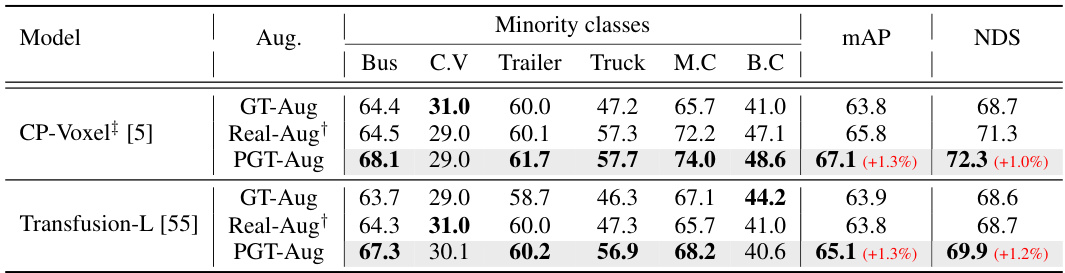
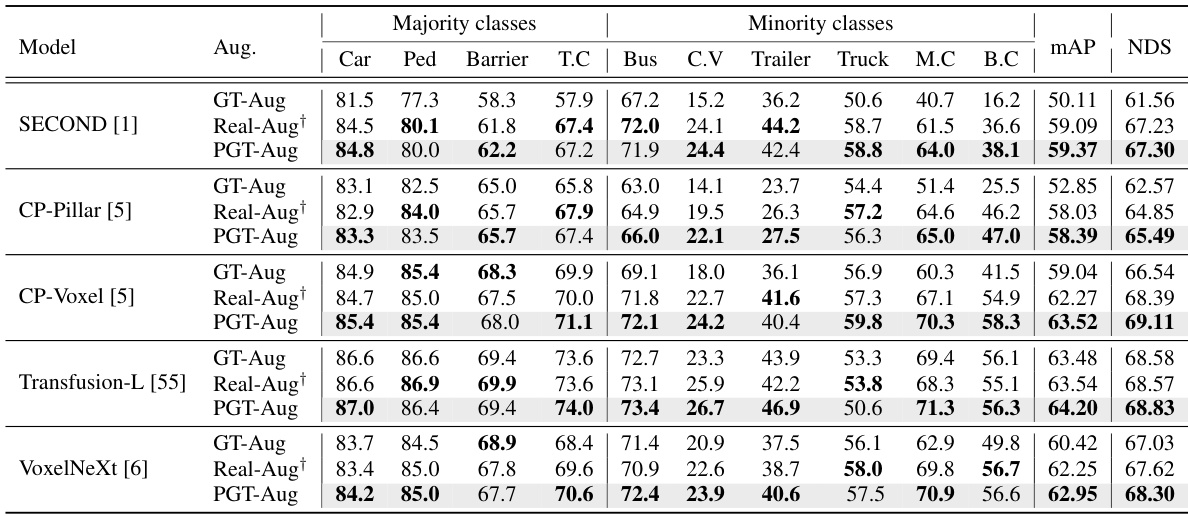
🔼 This table compares the performance of different 3D object detection models on the nuScenes validation set, with and without the proposed PGT-Aug data augmentation method. It shows the mean Average Precision (mAP) and NDS scores for both majority and minority classes, across several base models. The results highlight the improvement achieved by integrating PGT-Aug, especially for the minority classes, showing its effectiveness in mitigating the class imbalance problem.
read the caption
Table 3: Comparisons between baseline and PGT-Aug for individual models on nuScenes val set. Abbr. C.V: Construction Vehicle, Ped: Pedestrian, T.C: Traffic Cone, M.C: Motorcycle, B.C: Bicycle. †: our reproduction.
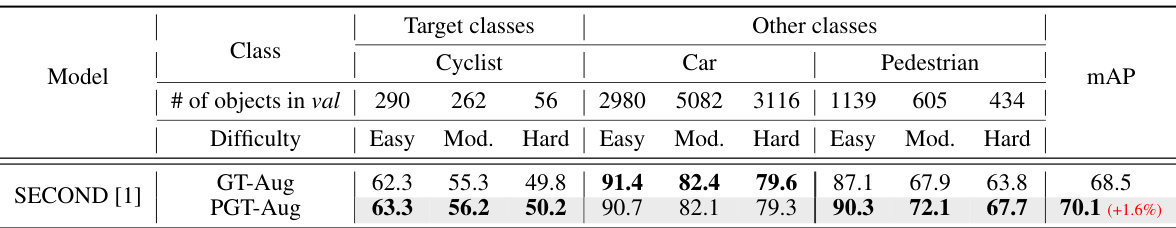
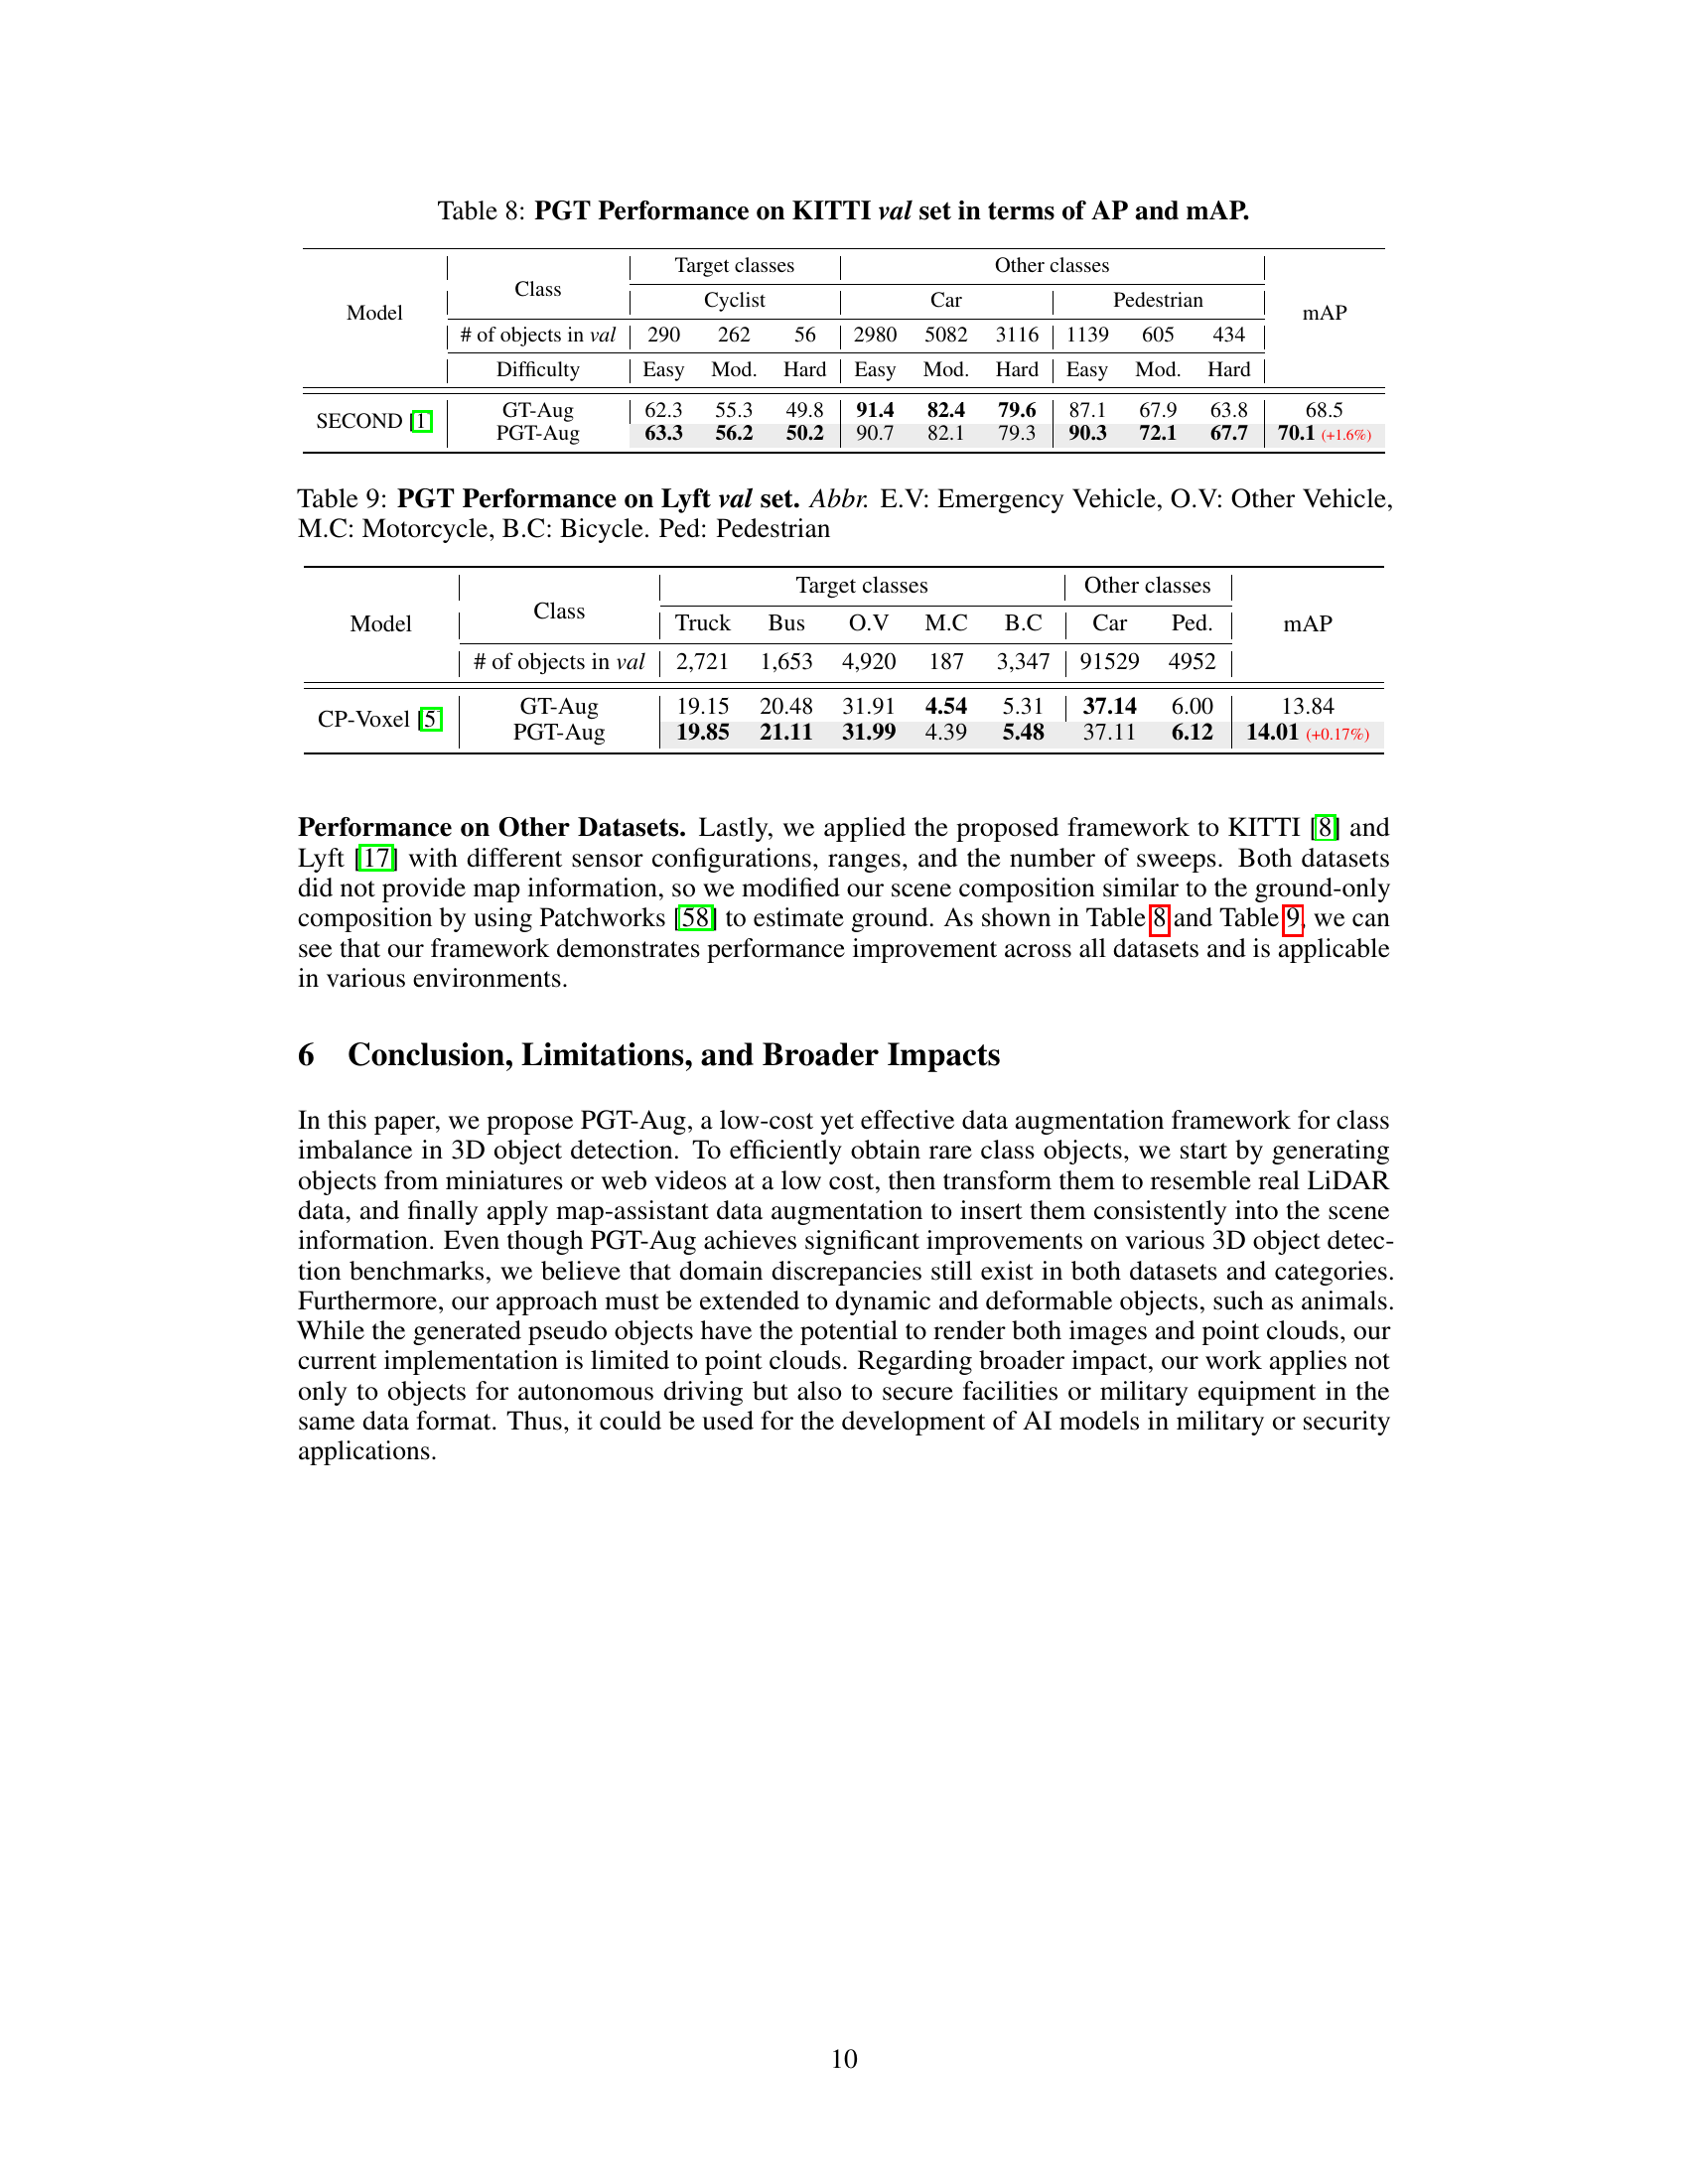
🔼 This table presents the performance of the PGT-Aug method on the KITTI validation set. It shows Average Precision (AP) and mean Average Precision (mAP) scores for different object classes (cyclist, car, pedestrian) and difficulty levels (easy, moderate, hard). The results demonstrate the effectiveness of PGT-Aug in improving object detection accuracy, particularly for challenging cases.
read the caption
Table 8: PGT Performance on KITTI val set in terms of AP and mAP.
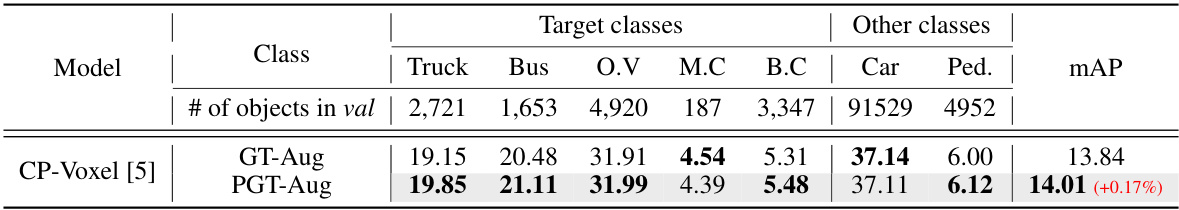
🔼 This table presents the performance comparison of the proposed PGT-Aug method against the baseline (GT-Aug) on the Lyft dataset’s validation set. The results are broken down by object class (Truck, Bus, Other Vehicle, Motorcycle, Bicycle, Car, Pedestrian) and show the Average Precision (AP) for each class as well as the mean Average Precision (mAP) across all classes. The table highlights the improvement achieved by PGT-Aug, especially for minority classes.
read the caption
Table 9: PGT Performance on Lyft val set. Abbr. E.V: Emergency Vehicle, O.V: Other Vehicle, M.C: Motorcycle, B.C: Bicycle. Ped: Pedestrian
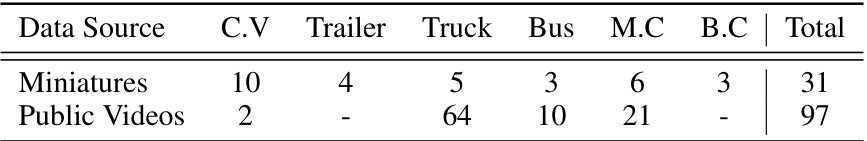
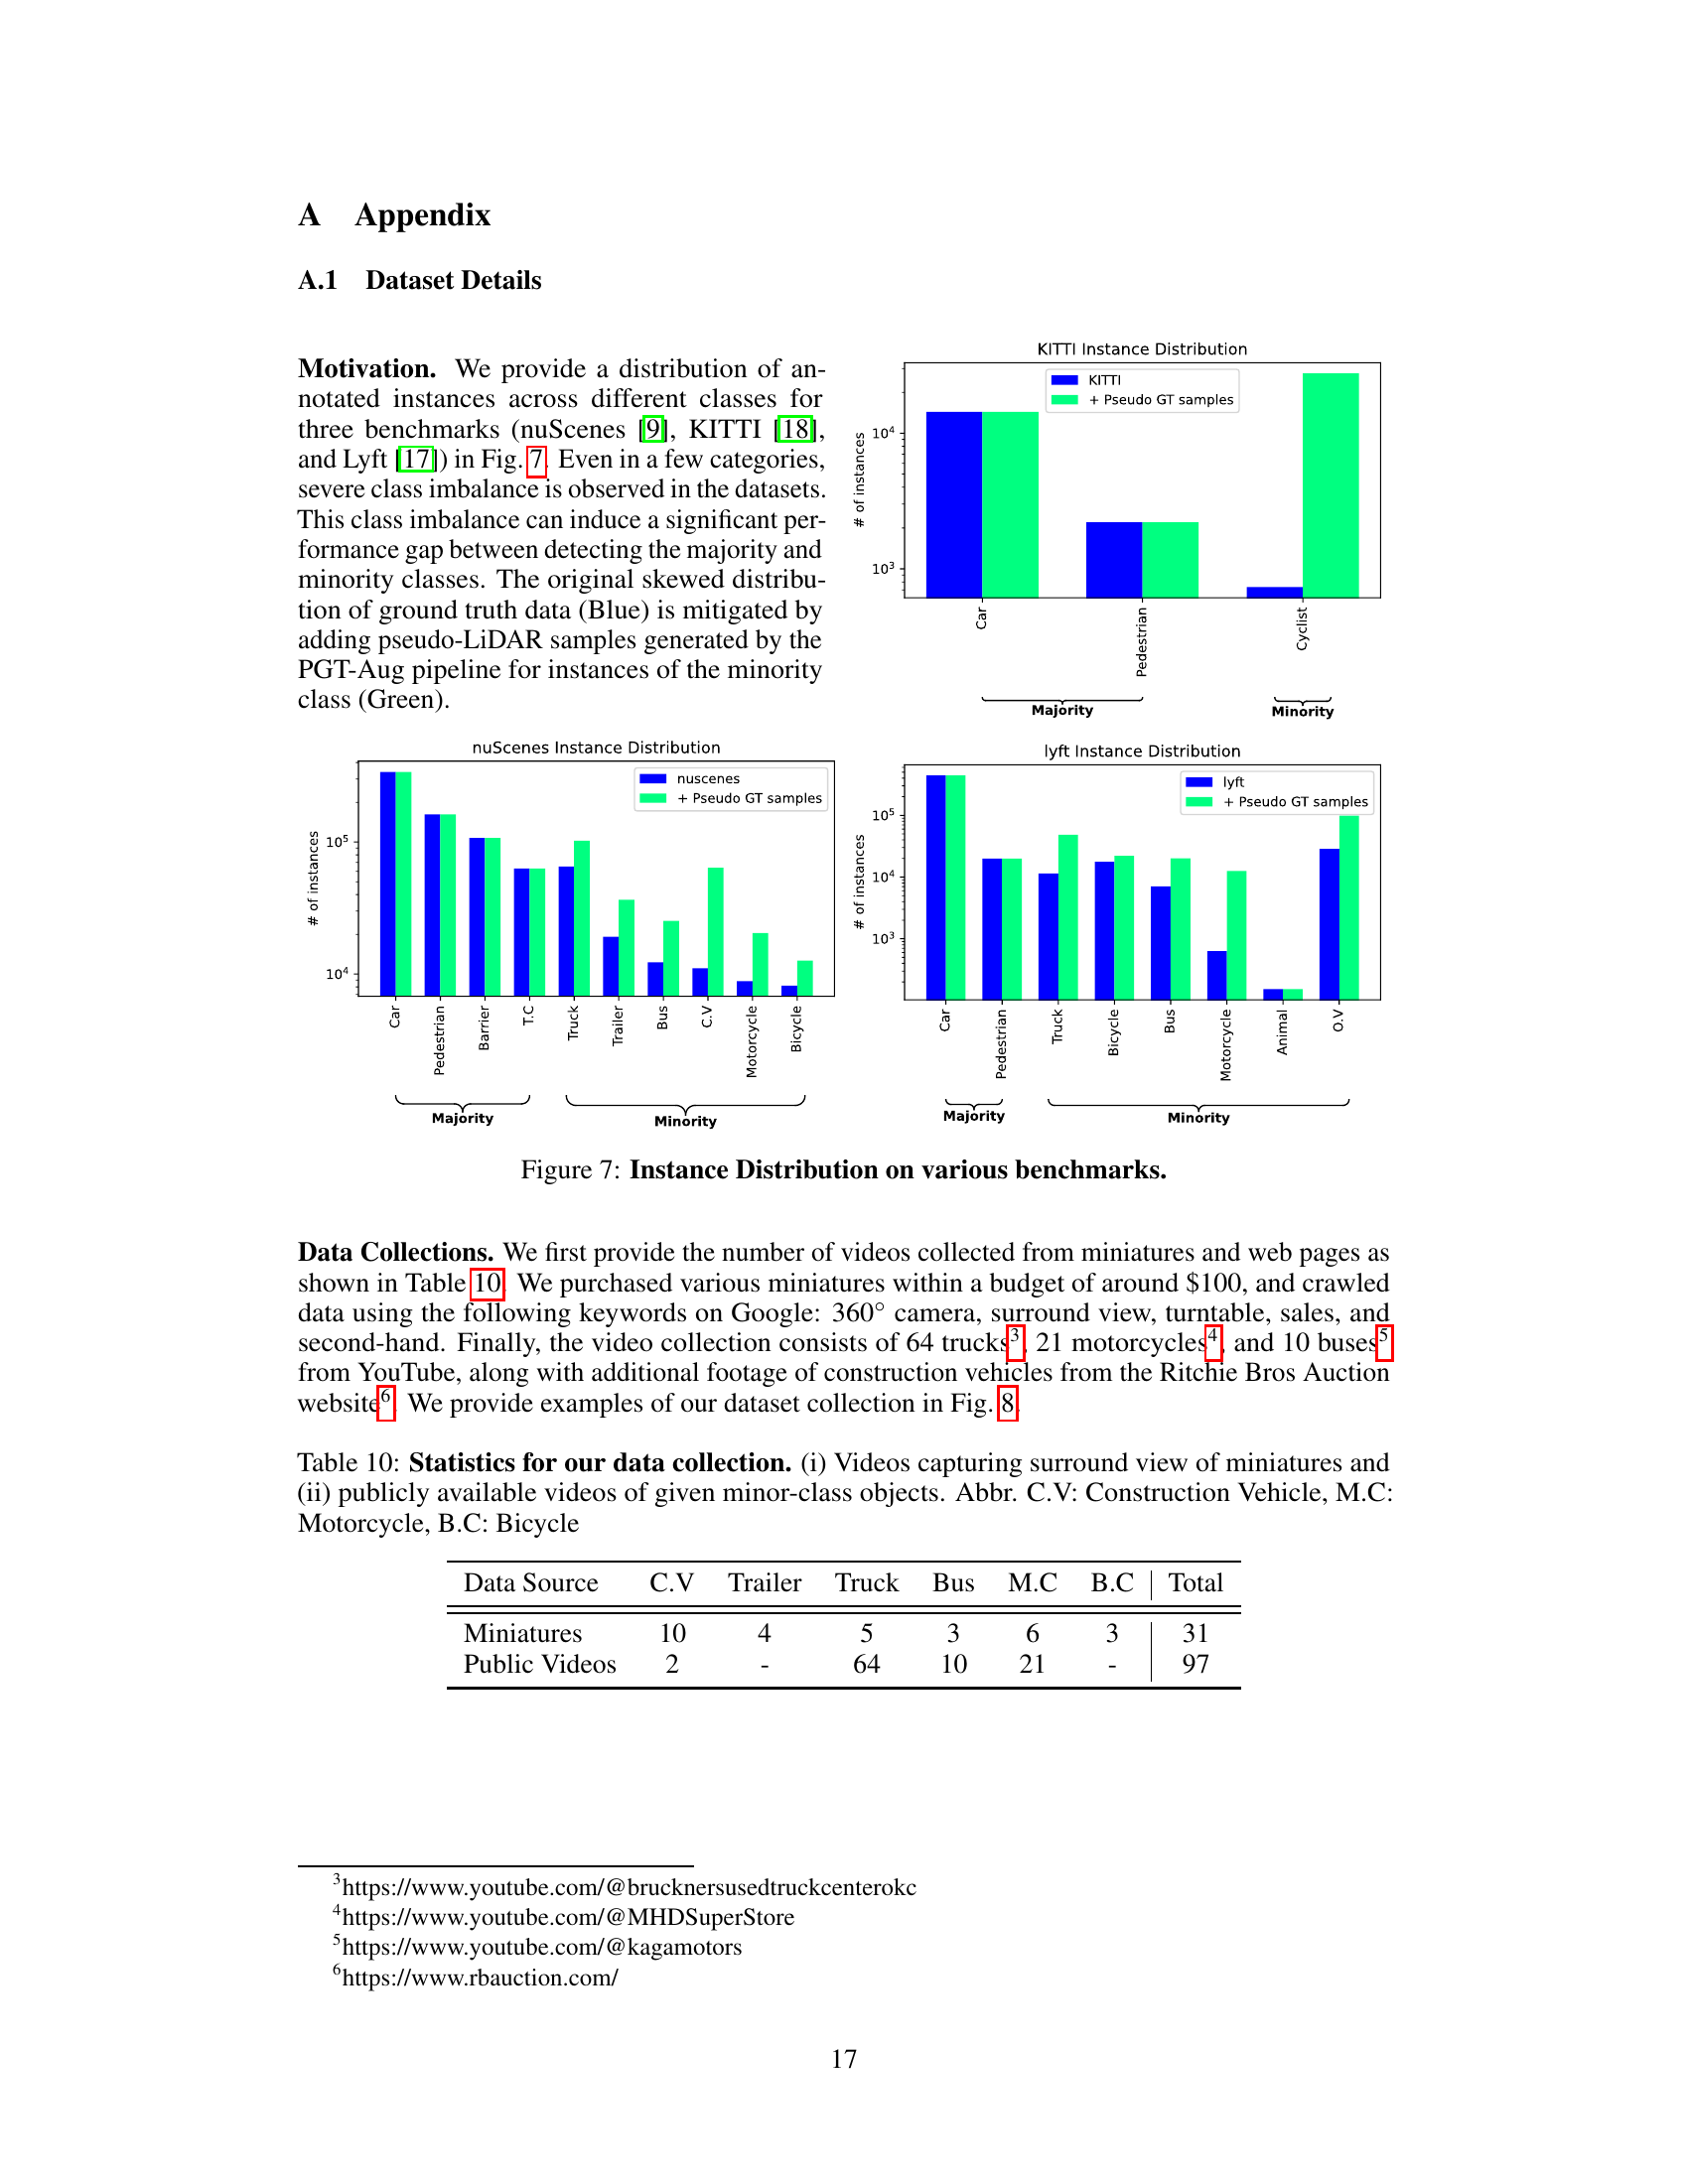
🔼 This table shows the number of videos collected for each minority class from two sources: miniature videos and publicly available videos. The miniature videos were collected by filming various miniature vehicles (trucks, trailers, buses, motorcycles, and construction vehicles), while the public videos were sourced from YouTube and other online video platforms. The table lists the number of videos collected for each object class from each source.
read the caption
Table 10: Statistics for our data collection. (i) Videos capturing surround view of miniatures and (ii) publicly available videos of given minor-class objects. Abbr. C.V: Construction Vehicle, M.C: Motorcycle, B.C: Bicycle
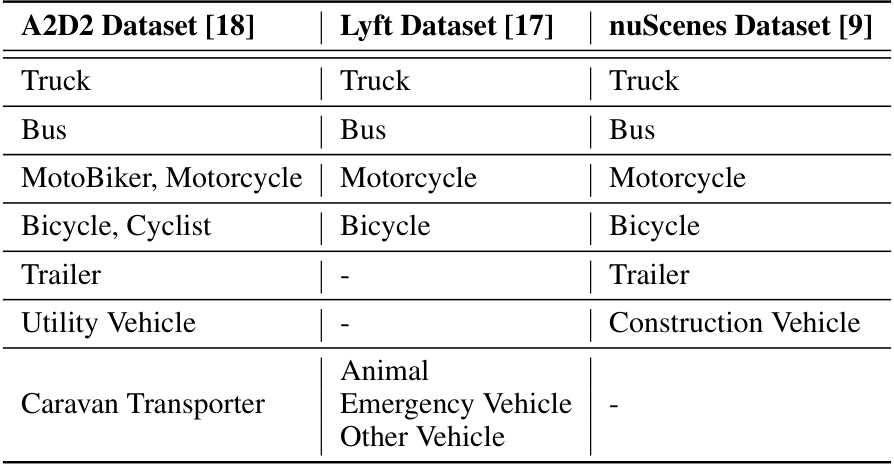
🔼 This table shows the mapping between object categories across different datasets used for FID (Fréchet Inception Distance) evaluation and 3D object detection. It ensures that consistent class comparisons can be made between the nuScenes, Lyft, and A2D2 datasets when evaluating the quality of synthetically generated objects.
read the caption
Table 11: Categories agreement among datasets for FID evaluation and 3D object detection.
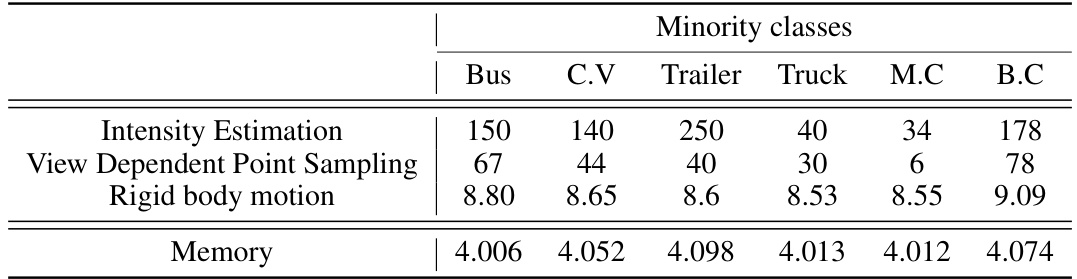
🔼 This table shows the average processing time and memory usage for each step in the pseudo LiDAR generation pipeline for different minority classes in the nuScenes dataset. The steps include intensity estimation, view-dependent point sampling, and rigid body motion. The memory usage is also provided for each class.
read the caption
Table 12: Average processing time (per instance, in msec) and memory usage (MB) C.V: Construction Vehicle, Ped: Pedestrian, T.C: Traffic Cone, M.C: Motorcycle, B.C: Bicycle.
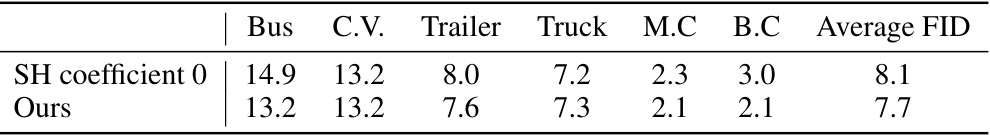
🔼 This table presents a comparison of FID (Fréchet Inception Distance) scores between two versions of the pseudo-LiDAR point cloud generation method. One version uses only the first spherical harmonic coefficient (SH coefficient 0), while the other uses the authors’ full approach. Lower FID scores indicate better similarity to real LiDAR data. The results show that the authors’ method produces point clouds with significantly lower FID scores, suggesting that they are more realistic and closer to real-world LiDAR data than those generated using only the first SH coefficient.
read the caption
Table 13: FID score evaluation between SH coefficient 0 and ours. Abbr. C.V: Construction Vehicle, Ped: Pedestrian, T.C: Traffic Cone, M.C: Motorcycle, B.C: Bicycle.
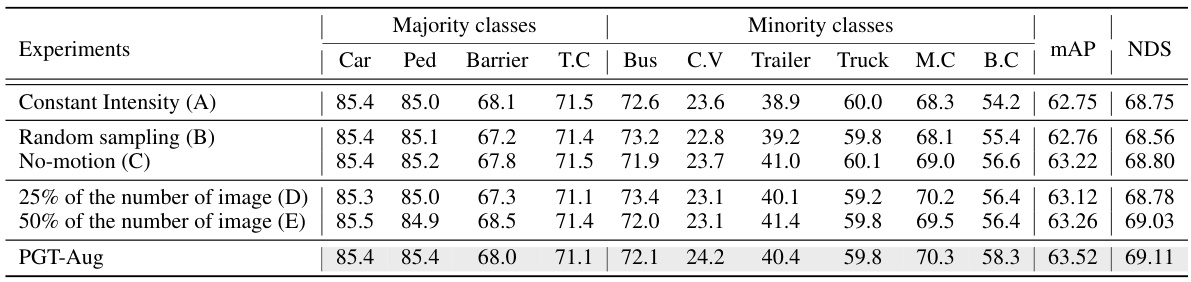
🔼 This table presents the results of an ablation study conducted to evaluate the impact of different components of the proposed PGT-Aug framework on the performance of 3D object detection. It shows the effects of removing or modifying key aspects such as intensity generation, sampling methods, motion modeling, and the number of input images used in the 3D reconstruction process. The results are presented in terms of average precision (AP) and NuScenes Detection Score (NDS) for both majority and minority classes, demonstrating the contribution of each component to the overall performance.
read the caption
Table 14: Ablation study in intensity, the number of images, data alignment on nuScenes val set. Abbr. C.V: Construction Vehicle, Ped: Pedestrian, T.C: Traffic Cone, M.C: Motorcycle, B.C: Bicycle. †: our reproduction.
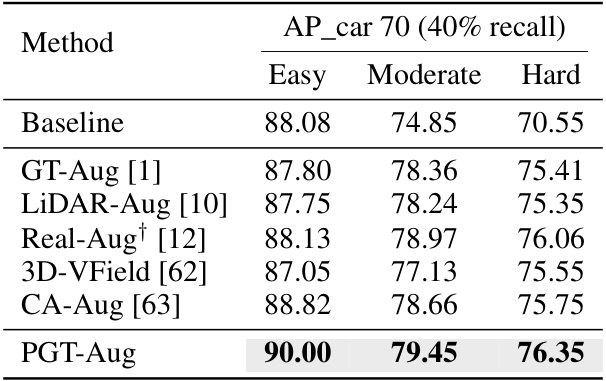
🔼 This table compares the performance of PGT-Aug with other data augmentation methods on the KITTI Car benchmark, using PointPillars as the baseline model. It shows the Average Precision (AP) for the ‘car’ class, broken down by difficulty level (Easy, Moderate, Hard), demonstrating the effectiveness of PGT-Aug in improving performance across all difficulty levels.
read the caption
Table 15: Performance comparison with other data augmentation approaches. †: our reproduction
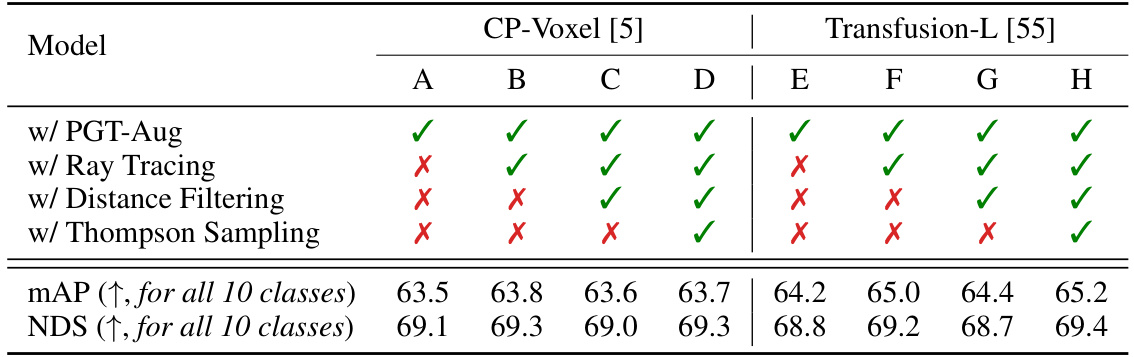
🔼 This table presents the ablation study results on the nuScenes validation set using two baseline models, CP-Voxel and Transfusion-L. It shows the effect of adding several modules to the baseline model, including PGT-Aug, ray tracing, distance filtering, and Thompson sampling. Each module’s impact on the mean Average Precision (mAP) and the NuScenes Detection Score (NDS) is evaluated and presented, providing insights into the effectiveness of each component and their combined impact on the overall performance.
read the caption
Table 16: Detection performance comparison for additional modules on nuScenes val set in terms of AP, mAP, and NDS. We use CP-Voxel [5] and Transfusion-L [55] as a baseline model.
Full paper#