TL;DR#
Current 3D scene segmentation methods often involve complex processes or require extensive training. This limits their applicability and efficiency. Existing 3D Gaussian Splatting (3DGS)-based approaches typically modify the 3DGS optimization process, adding to computational costs. Moreover, they often rely on video segmentation models, limiting their flexibility.
GaussianCut addresses these issues by proposing a novel interactive 3D segmentation technique. It directly operates on the 3D Gaussian splatting representation, simplifying object selection using intuitive user input. By utilizing a graph-cut algorithm and a novel energy function, GaussianCut efficiently partitions Gaussians into foreground and background, providing high-fidelity segmentation without requiring additional training. Its adaptability across different scene types and competitive performance demonstrate its significant contribution to the field.
Key Takeaways#
Why does it matter?#
This paper is significant because it presents GaussianCut, a novel method for interactive 3D scene segmentation that leverages the efficiency of 3D Gaussian Splatting. It offers a user-friendly approach that doesn’t need additional segmentation-aware training, making it accessible and applicable to broader research. The method’s efficiency and adaptability to different scene types open new avenues for research in interactive 3D scene understanding and manipulation.
Visual Insights#

🔼 This figure shows the overall pipeline of the GaussianCut method. Starting with multiview images of a scene, a pretrained 3D Gaussian Splatting (3DGS) model is used to represent the scene as a set of 3D Gaussians. The user provides input in the form of sparse point clicks, scribbles, or a text prompt on a single viewpoint. GaussianCut then uses this input to partition the set of Gaussians into foreground and background, effectively segmenting the object(s) of interest. The figure visually depicts this process, showing how the user input leads to the separation of foreground and background Gaussians in the 3D model.
read the caption
Figure 1: Our method, GaussianCut, enables interactive object(s) selection. Given an optimized 3D Gaussian Splatting model for a scene with user inputs (clicks, scribbles, or text) on any viewpoint, GaussianCut partitions the set of Gaussians as foreground and background.

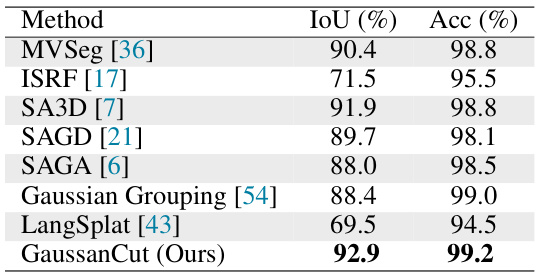
🔼 This table presents a quantitative comparison of the proposed GaussianCut method against several state-of-the-art baselines for 2D mask segmentation on the NVOS dataset. The evaluation metrics used are IoU (Intersection over Union) and Acc (Accuracy), both represented as percentages. Higher values indicate better performance. The table showcases GaussianCut’s competitive performance compared to other methods.
read the caption
Table 1: Quantitative results for 2D mask segmentation on NVOS dataset [44].
In-depth insights#
3DGS Segmentation#
3D Gaussian Splatting (3DGS) offers a unique approach to 3D scene representation, presenting both opportunities and challenges for segmentation. The explicit representation of a scene as a set of Gaussians allows for intuitive object selection via user interaction with a single view, using clicks, scribbles, or even text prompts. This contrasts with implicit representations like NeRFs, which require different segmentation strategies. However, 3DGS segmentation methods often involve augmenting each Gaussian with additional low-dimensional features, increasing computational cost and memory footprint. GaussianCut cleverly addresses this by leveraging graph-cut algorithms, applying them to a graph where nodes represent Gaussians and edge weights reflect spatial and color similarity, effectively partitioning the scene into foreground and background without modifying the core 3DGS optimization process. This approach offers high-fidelity segmentation comparable to state-of-the-art methods while retaining the efficiency and real-time rendering capabilities inherent to 3DGS.
GraphCut Approach#
The core of the proposed method lies in its innovative GraphCut approach. This technique elegantly transforms the 3D Gaussian Splatting scene representation into a graph structure, where each Gaussian ellipsoid becomes a node. Edge weights are meticulously defined, incorporating spatial proximity and color similarity of neighboring Gaussians, reflecting the inherent scene structure. The method intelligently integrates user input (clicks, scribbles, text) via a video segmentation model to obtain likelihood scores for each Gaussian’s foreground/background classification. This likelihood, combined with edge weights, forms the basis of an energy function minimized via the Boykov-Kolmogorov algorithm. This efficient graph cut algorithm partitions the graph into foreground and background Gaussian sets, achieving high-fidelity segmentation without retraining the underlying 3DGS model. The approach’s adaptability stems from the ability to leverage intuitive user interaction and dense segmentation masks, effectively combining user-centric feedback with the intrinsic properties of the 3D Gaussian representation. The strategy is computationally efficient, owing to the fast nature of 3DGS rasterization. Therefore, this graph-cut-based approach is innovative in its combination of robust scene representation and effective object selection and partitioning.
Interactive Input#
Interactive input in research papers significantly influences user engagement and data quality. Intuitive interfaces, such as point clicks, scribbles, or text prompts, are crucial for ease of use and accessibility. The choice of interactive modality depends on the research context and user expertise. The method of translating this input into the underlying scene representation (e.g., 3D Gaussian splatting) is vital for accurate and efficient processing. Error handling and robustness to noise in user input are critical considerations. Finally, the system’s responsiveness to user interactions directly impacts the overall user experience, particularly in time-sensitive applications. A well-designed interactive input system can bridge the gap between human intuition and computer processing, significantly improving the feasibility and usability of research projects.
Comparative Analysis#
A robust comparative analysis section in a research paper is crucial. It should systematically compare the proposed method against relevant baselines, using appropriate metrics and visualizations. The analysis must go beyond simple performance comparisons; it needs to investigate strengths and weaknesses, and highlight where the new method excels and where it falls short. Ideally, a qualitative analysis is included to provide a deeper understanding. It’s essential to account for experimental design and potential biases. This could involve discussing dataset characteristics, hyperparameter choices, and limitations of each approach, providing a nuanced and fair comparison. The choice of metrics is also vital – appropriate choices that reflect the core contributions are key, and the analysis should explain any limitations of those metrics. Statistical significance of any reported differences must be addressed, ensuring robust conclusions. Ultimately, a strong comparative analysis offers compelling evidence for the contribution and value of the proposed research.
Future Directions#
Future research could explore more sophisticated user interaction methods such as freehand sketching or more intuitive 3D manipulation tools to further enhance the efficiency and ease of use. Investigating alternative graph construction techniques that better capture object relationships in the scene and experimenting with different energy functions within the graph-cut framework to handle complex scenes and object boundaries more effectively are crucial. The integration of advanced 3D representation methods beyond Gaussian splatting and the exploration of hybrid approaches combining Gaussian splatting with other techniques is also warranted. Furthermore, extending the method to handle dynamic scenes and exploring the use of temporal information to improve segmentation accuracy are promising avenues. Finally, a thorough benchmarking against a wider range of datasets and state-of-the-art techniques would consolidate the paper’s findings and showcase the approach’s robustness and generalizability.
More visual insights#
More on figures

🔼 This figure illustrates the overall pipeline of the GaussianCut method. It starts with user input (clicks, scribbles, or text) on a single viewpoint image. This input is fed into a video segmentation model to generate dense segmentation masks across multiple views. Then, these masks are used with a rasterization step to determine the contribution of each 3D Gaussian in the optimized 3D Gaussian Splatting (3DGS) scene representation to the foreground (masked pixels) and background (unmasked pixels). This results in a weighted graph where each node is a Gaussian and weights represent the foreground/background likelihoods. Finally, a graph cut algorithm partitions the graph into foreground and background Gaussian sets, enabling separation of objects of interest from the scene.
read the caption
Figure 2: Overall pipeline of GaussianCut. User input from any viewpoint is passed to a video segmentation model to produce multi-view masks. We rasterize every view and track the contribution of each Gaussian to masked and unmasked pixels. Then, Gaussians are formulated as nodes in an undirected graph and we adapt graph cut to partition the graph. The red edges in the graph highlight the set of edges graph cut removes for partitioning the graph.

🔼 This figure illustrates the overall pipeline of the GaussianCut method. It shows how user input (from any viewpoint) is processed through a video segmentation model to generate multi-view masks. These masks are then used to track each Gaussian’s contribution to masked and unmasked pixels in the scene. The Gaussians are then represented as nodes in a graph, and a graph cut algorithm is applied to partition the graph into foreground and background Gaussians based on user input and scene properties.
read the caption
Figure 2: Overall pipeline of GaussianCut. User input from any viewpoint is passed to a video segmentation model to produce multi-view masks. We rasterize every view and track the contribution of each Gaussian to masked and unmasked pixels. Then, Gaussians are formulated as nodes in an undirected graph and we adapt graph cut to partition the graph. The red edges in the graph highlight the set of edges graph cut removes for partitioning the graph.

🔼 This figure compares the 3D segmentation results obtained from GaussianCut and three other state-of-the-art methods (ISRF, SA3D, SAGD) when using a textual prompt. The image shows that GaussianCut produces a segmentation with finer details and a more accurate representation of the plant’s features compared to the other methods, especially when considering the details captured in the graph cut component, such as the plant decorations. Coarse splatting, a simpler technique, is also included for further comparison and shows a less accurate result.
read the caption
Figure 4: Qualitative comparison: 3D segmentation results of GaussianCut using text on 360-garden [1] scene. Compared to ISRF [17], SA3D [7], SAGD [21], GaussianCut segment contain finer details. The graph cut component of GaussianCut also retrieves fine details (like decorations on the plant) that are missed in coarse splatting.
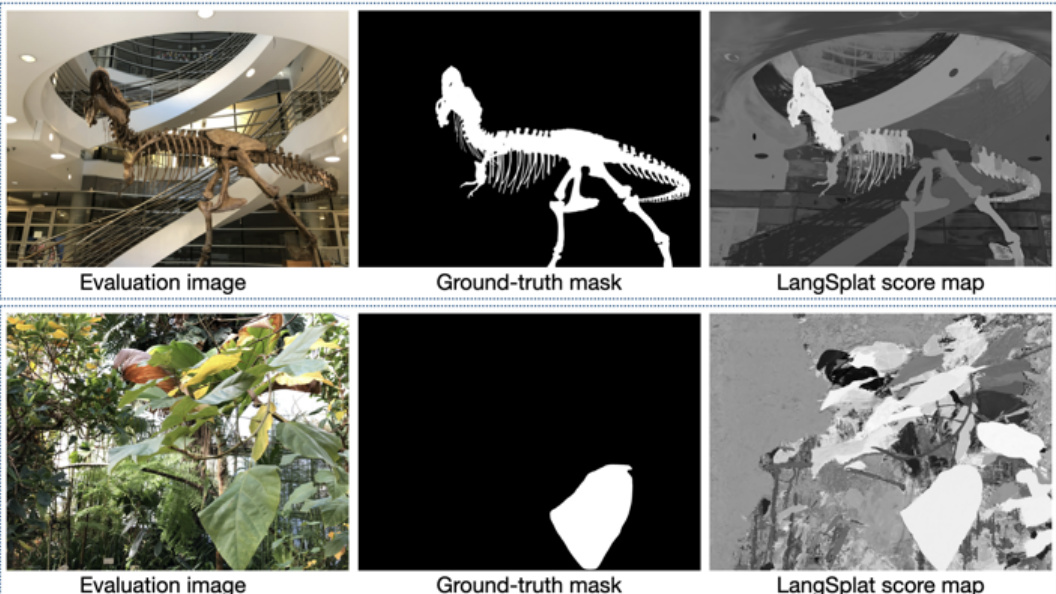
🔼 This figure shows limitations of LangSplat method in segmenting objects from two scenes in the NVOS benchmark dataset. The top row demonstrates the failure to extract parts of a T-Rex model, while the bottom row highlights the inclusion of background leaves along with the intended foreground leaves. This showcases the challenges faced by LangSplat in achieving precise object segmentation, particularly when dealing with complex scenes containing intricate objects or overlapping elements.
read the caption
Figure 5: Limitation of LangSplat on Trex and Leaves scenes from NVOS benchmark. Parts of the trex can not be extracted in the top row. In the bottom row, background leaves are also selected along with front leaf.

🔼 This figure shows a comparison of segmentation results between SAM-Track and GaussianCut on a bicycle scene. SAM-Track struggles to accurately capture the bicycle when its orientation changes, missing details such as the wheels and pedals. GaussianCut, while improving upon SAM-Track’s output, still struggles with some aspects of accurate segmentation. It highlights how the accuracy of the method relies heavily on the quality of the input 2D video segmentation.
read the caption
Figure 7: SAM-Track fails to capture major sections of the bicycle when its orientation significantly deviates from the initial position. Even in the reference image, the segmentation mask omits finer details such as the bicycle wheel rims, pedals, and bottle holder. GaussianCut improves segmentation by eliminating substantial portions of the bench to isolate the bicycle, and it partially restores the visibility of the wheel rims. Despite these improvements, the segmentation remains imprecise.
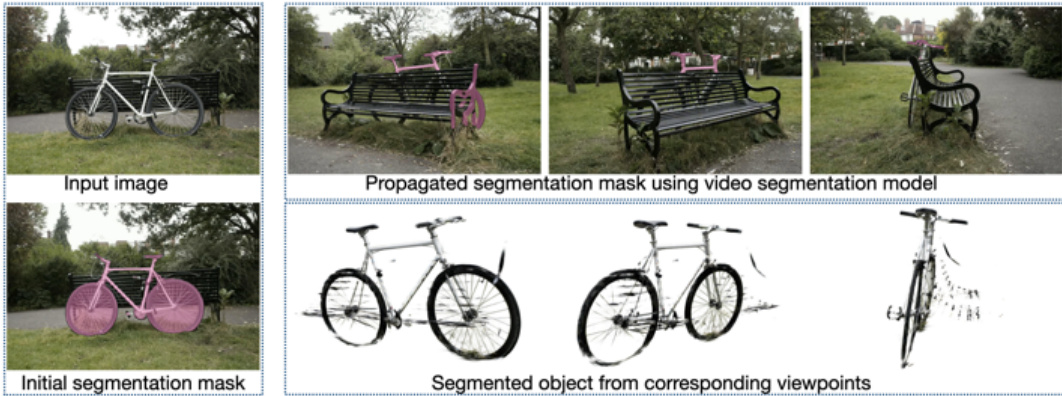
🔼 This figure demonstrates a limitation of the SAM-Track model in handling significant changes in object orientation. The video segmentation model fails to accurately capture the entire bicycle in several views, missing key details like wheel rims. GaussianCut enhances the segmentation by removing parts of the background, thus isolating the bicycle more effectively, though some imprecision remains. This highlights the challenges in using video segmentation for accurate 3D object extraction.
read the caption
Figure 7: SAM-Track fails to capture major sections of the bicycle when its orientation significantly deviates from the initial position. Even in the reference image, the segmentation mask omits finer details such as the bicycle wheel rims, pedals, and bottle holder. GaussianCut improves segmentation by eliminating substantial portions of the bench to isolate the bicycle, and it partially restores the visibility of the wheel rims. Despite these improvements, the segmentation remains imprecise.

🔼 This figure shows how GaussianCut handles inconsistencies in video segmentation masks. Even when the video segmentation model produces inaccurate or incomplete masks across multiple views (due to challenges like object pose changes), GaussianCut can still accurately extract the target object with fine details preserved, demonstrating its robustness to noisy inputs.
read the caption
Figure 8: GaussianCut precisely retrieves fine details, such as the mirrors on the front of the truck, even in instances where video-segmentation model struggles to maintain consistency across different views in the scene.

🔼 This figure shows examples of object selection using GaussianCut on different scenes from the Mip-NeRF and LERF datasets. For each scene, the leftmost image shows the reference image with the initial selection (point clicks) overlaid. The remaining images in each row display the segmented object rendered from various viewpoints, showcasing the accuracy and consistency of GaussianCut’s 3D segmentation across different perspectives. This demonstrates the effectiveness of the method in isolating objects from complex scenes.
read the caption
Figure 9: Visualization of selected objects on the Mip-NeRF and LERF dataset. Initial object selection, based on point clicks, and the reference image is shown on the left.

🔼 This figure compares the qualitative results of object segmentation on the Shiny dataset between the proposed GaussianCut method and the SA3D method. It shows four scenes from the Shiny dataset with the reference image showing the user input points used for object selection. The results demonstrate that GaussianCut achieves higher accuracy and better rendering of the segmented objects than SA3D, particularly in capturing finer details and handling complex object shapes in cluttered environments.
read the caption
Figure 10: Qualitative results on the Shiny dataset, compared against SA3D [7]. The points used as user inputs are highlighted in the reference image.

🔼 This figure presents a qualitative comparison of segmentation masks generated by the proposed GaussianCut method and the ground truth masks from the SPIn-NeRF dataset. It visually demonstrates the performance of GaussianCut on several scenes, including those with trucks, pinecones, orchids, and Lego constructions. Each row showcases an example scene: (a) shows the original image; (b) displays the ground-truth segmentation mask; (c) presents the segmentation mask generated by GaussianCut; and (d) shows a rendering of the segmented object from the GaussianCut output against a black background. This visual comparison allows for an assessment of the accuracy and quality of the segmentation achieved by the GaussianCut method compared to the ground truth.
read the caption
Figure 11: Qualitative comparison of segmentation masks obtained from GaussianCut and the ground-truth used in SPIn-NeRF dataset.

🔼 This figure shows a comparison of the segmentation masks produced by SAM (Segment Anything) and GaussianCut for three different scenes: Garden, Bonsai, and Truck. For each scene, the RGB image, the SAM mask, and the GaussianCut mask are displayed. The comparison highlights how GaussianCut refines the segmentation provided by SAM, particularly in terms of precision and detail.
read the caption
Figure 12: Visualization of overall segmentation masks from SAM and GaussianCut.

🔼 This figure compares the results of three different segmentation methods: coarse splatting, GaussianCut with a single mask, and GaussianCut with multiple masks. The top row shows the input image, the coarse splatting result (without graph cut), and GaussianCut results using different input types (scribbles, single mask, and multi-view masks). The bottom row shows the ground truth segmentation for comparison. The figure highlights how GaussianCut’s performance improves significantly with the increased input information from multiple views, especially when compared to using only scribbles or a single mask.
read the caption
Figure 13: We compare coarse splatting (w/o graph cut) and GaussianCut. Scribbles refer to using direct input, single mask refers to taking the mask from one viewpoint, and multi-view masks refer to using video segmentation. The effectiveness of GaussianCut becomes more prominent when the inputs are sparse.
More on tables
🔼 This table presents a quantitative comparison of the proposed GaussianCut method with several baseline methods on the SPIn-NeRF dataset. The metrics used for comparison are Intersection over Union (IoU) and accuracy (Acc), both expressed as percentages. Higher values indicate better performance. The table shows that GaussianCut achieves higher IoU and accuracy than most of the baseline methods.
read the caption
Table 2: Quantitative results on the SPIn-NeRF dataset [36].

🔼 This table presents a quantitative comparison of the photorealistic quality of the segmented objects by different methods, including GaussianCut. The evaluation is performed by rendering the segmented foreground object against a black background and computing the SSIM, PSNR, and LPIPS metrics. Higher PSNR and SSIM values indicate better rendering quality, while a lower LPIPS value indicates better perceptual similarity to the ground truth.
read the caption
Table 3: Object rendering results on NVOS [44].

🔼 This table presents a quantitative comparison of the performance of different methods on the Shiny dataset. The methods compared include SA3D, SAGD, Coarse Splatting (a baseline), and the proposed GaussianCut method. The evaluation metrics used are IoU (Intersection over Union) and Acc (Accuracy), which are common measures for evaluating the quality of segmentation. Higher values for both metrics indicate better performance.
read the caption
Table 4: Quantitative results on Shiny [53].
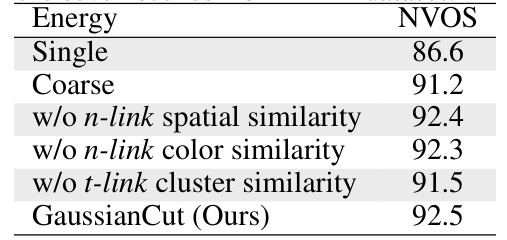
🔼 This table presents the ablation study of the energy function used in GaussianCut. It shows the average Intersection over Union (IoU) scores achieved on seven scenes from the LLFF dataset when different components of the energy function are removed. The results indicate the contribution of each term (spatial similarity, color similarity, and cluster similarity) to the overall performance of the algorithm. The ablation study demonstrates that including all terms is crucial for optimal segmentation performance.
read the caption
Table 5: Ablation of the energy function averaged over the seven scenes from LLFF dataset.

🔼 This table presents the performance (in terms of IoU) of both the Coarse Splatting method and the GaussianCut method on two scenes (Fortress and Lego) using different numbers of views passed to the video segmentation models. The number of views is shown as a percentage of the total number of views available for each scene. The time cost (in seconds) for each experiment is also included, showing the impact of increasing the number of views on computational time. The data demonstrates how the GaussianCut method improves accuracy over the Coarse Splatting method, and highlights the trade-off between accuracy and computation time as the number of views increase.
read the caption
Table 6: Performance of GaussianCut with varying the number of views passed to the video segmentation models. The number in parenthesis is the percentage of total views for the scene.

🔼 This table shows the impact of varying the number of neighbors considered during graph construction on the segmentation performance. Two scenes, ‘Horns’ and ‘Truck’, are evaluated. The number of neighbors ranges from 1 to 100. The table shows that increasing the number of neighbors generally improves the accuracy (IoU) but also significantly increases the processing time (Time (s)).
read the caption
Table 7: Ablation on the number of neighbors.

🔼 This table presents the ablation study on the number of clusters used for high-confidence nodes in the Gaussian graph cut algorithm. It shows the impact of varying the number of clusters (1, 5, 10, and 20) on the performance of the algorithm, measured by IoU, for three different scenes: Fortress, Horns, and Truck. The results indicate that the performance is relatively stable across different numbers of clusters.
read the caption
Table 8: Ablation on the number of clusters for high-confidence nodes.

🔼 This table compares the preprocessing time, fitting time, segmentation time, and performance (IoU) of four different methods on the NVOS dataset. The methods compared are SAGA, Gaussian Grouping, LangSplat, and the authors’ methods (Coarse Splatting and GaussianCut). The table highlights that while GaussianCut has a longer segmentation time, it achieves a significantly better IoU compared to the baselines.
read the caption
Table 9: Comparison of segmentation time (in seconds) on the NVOS benchmark.

🔼 This table presents a quantitative comparison of the proposed GaussianCut method against several state-of-the-art baselines on the SPIn-NeRF dataset. It shows the Intersection over Union (IoU) and accuracy (Acc) for different scenes. The results demonstrate the competitive performance of GaussianCut, particularly on scenes with complex object shapes and challenging viewpoints.
read the caption
Table 10: Quantitative results on each scene in the SPIn-NeRF dataset.

🔼 This table presents a quantitative comparison of the proposed GaussianCut method against three baseline methods (Gaussian Grouping, LangSplat, and Contrastive Gaussian Clustering) on the 3D-OVS dataset. The evaluation uses text queries for object selection, and the results are presented as IoU scores for various objects across different scenes (e.g., Banana, Leather Shoe, Camera, etc.). The table allows for a direct comparison of the segmentation performance of the different methods.
read the caption
Table 11: Quantitative evaluation on 3D-OVS [28] dataset. CGC refers to Contrastive Gaussian Clustering method.

🔼 This table compares the performance of two different weighting schemes for assigning weights to Gaussians based on their likelihood of belonging to the foreground. ‘Soft assignment’ uses a weighted ratio of a Gaussian’s contribution to masked pixels, while ‘Hard assignment’ uses a binary approach, assigning either 1 or 0 depending on whether the Gaussian contributes to a foreground pixel or not. The table presents the IoU results for both methods across five different scenes, showing a negligible difference in performance.
read the caption
Table 12: Comparison of soft and hard weight assignment of wg.

🔼 This table presents the results of an ablation study on the hyperparameter λ, which balances the contributions of unary and pairwise terms in the energy function used for Gaussian graph cut. The table shows the IoU (Intersection over Union) metric for two scenes, Fortress and Lego, under different values of λ (0.5, 1, 2, and 4). This helps to understand how sensitive the model’s performance is to changes in the value of λ.
read the caption
Table 13: Performance comparison for different λ values.

🔼 This table shows the performance of the GaussianCut method with different values of the hyperparameter γ, which controls the balance between spatial proximity and color similarity in the pairwise term of the energy function for graph cut. The results are presented as IoU for two scenes, Fortress and Lego, to illustrate the effect of this hyperparameter on segmentation accuracy.
read the caption
Table 14: Performance comparison for different γ values.
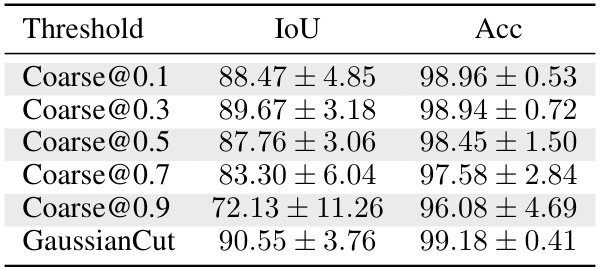
🔼 This table shows the performance of coarse splatting (without using graph cut) with different thresholds for the likelihood of a Gaussian belonging to the foreground (from 0.1 to 0.9). It compares the Intersection over Union (IoU) and Accuracy (Acc) metrics for each threshold, demonstrating the effect of varying the threshold on segmentation performance. The final row shows the results for the GaussianCut approach which incorporates graph cut for improved segmentation.
read the caption
Table 15: Coarse splatting baseline with different thresholds.

🔼 This table presents a comparison of segmentation performance using only user scribbles as input, with and without the application of the graph cut algorithm, and compares it to the performance of the full GaussianCut method. The results are shown for five different scenes from the NVOS dataset.
read the caption
Table 16: Segmentation performance with just user scribbles for NVOS scenes.
Full paper#


