↗ OpenReview ↗ NeurIPS Homepage ↗ Chat
TL;DR#
Machine learning models often exhibit performance discrepancies across different domains, hindering their real-world applicability. Existing methods for analyzing these discrepancies are limited, typically providing only coarse aggregate explanations. They often rely on strong parametric assumptions or require complete knowledge of the causal relationships between variables. These limitations hinder the identification of the root causes and effective corrective actions.
This research introduces a novel nonparametric framework, Hierarchical Decomposition of Performance Differences (HDPD), which addresses these limitations. HDPD provides a hierarchical decomposition of performance gaps into shifts in covariate and outcome distributions, subsequently breaking down these aggregate effects into detailed variable-level attributions. It achieves this without needing causal graph knowledge, using computationally efficient estimators and robust statistical inference procedures to quantify uncertainty. This allows for a deeper understanding of the discrepancies and facilitates the design of more targeted interventions.
Key Takeaways#
Why does it matter?#
This paper is crucial for ML researchers because it offers a novel nonparametric framework for understanding and addressing performance discrepancies across domains, a common and critical challenge in real-world applications. It provides computationally efficient methods and statistical inference for improved model explainability and targeted interventions, paving the way for more robust and reliable ML systems. This work is particularly relevant given the growing interest in fairness, explainability, and robustness in machine learning.
Visual Insights#

The figure demonstrates the HDPD framework, a hierarchical decomposition method for understanding ML performance discrepancies across domains. The left panel shows a hierarchical decomposition of a performance gap into aggregate (covariate and outcome shifts) and detailed components, illustrating how the framework breaks down the overall gap into contributions from individual features. The right panel provides a graphical representation using directed acyclic graphs (DAGs), illustrating how aggregate decompositions represent the impact of interventions on the outcome distribution, while detailed decompositions quantify the contribution of feature subsets.

This table compares the proposed Hierarchical Decomposition of Performance Differences (HDPD) framework with existing methods for decomposing machine learning performance gaps. It highlights key differences across several aspects: whether the methods perform aggregate decomposition, detailed decomposition for covariate shift and conditional outcome shift, whether causal graph knowledge is required, whether confidence intervals are provided, and whether the approach is nonparametric. The table shows that HDPD uniquely combines all these desirable features, providing a more complete and robust framework for understanding ML performance discrepancies.
In-depth insights#
Hierarchical Gap#
A hierarchical gap analysis in machine learning (ML) performance seeks to decompose discrepancies between domains beyond simple aggregate measures. Instead of merely attributing the performance gap to shifts in feature distributions (covariate shift) or outcome distributions (concept/outcome shift), a hierarchical approach drills down into specific variable contributions within each shift type. This granular understanding facilitates the identification of key variables driving performance differences, rather than broad, less actionable insights. The framework’s power lies in revealing the interplay between shifts in feature and outcome distributions at both aggregate and detailed levels, thus pinpointing the most effective interventions to close the performance gaps. Non-parametric methods are particularly valuable because they avoid strong assumptions about data distributions, which are often violated in real-world applications. However, a hierarchical gap decomposition necessitates carefully defining and measuring ‘partial shifts’ – the incremental contribution of variable subsets to the overall shift – which often involves computationally expensive approaches such as Shapley values. The challenge is to devise efficient non-parametric methods to quantify such partial shifts while ensuring statistical rigor. The hierarchical framework allows one to obtain confidence intervals, a crucial step for reliable inference.
Debiased Estimation#
The concept of debiased estimation is crucial for mitigating the impact of bias stemming from the use of machine learning (ML) models within the hierarchical decomposition framework. Standard plug-in estimators, which directly substitute estimated nuisance parameters into the target estimands, are shown to be inefficient and lack the desirable property of asymptotic normality needed for valid statistical inference. The authors address this limitation by employing a one-step correction method, which essentially adjusts the naive plug-in estimates by subtracting their first-order bias terms. This approach provides debiased estimators that converge at the optimal √n rate, thus facilitating the construction of reliable confidence intervals. The application of this technique is especially important for the detailed level decompositions, as the unique structure of those estimands makes standard debiasing methods inapplicable. The development of these debiased estimators, along with the derivation of their asymptotic properties, is a significant technical contribution of the paper, enabling robust statistical inference and more accurate interpretation of the results. This ensures the reliability of explanations regarding performance gaps in the ML algorithm across different domains.
Real-World Use#
The ‘Real-World Use’ section of this research paper would likely detail the application of the proposed hierarchical decomposition framework to real-world datasets. This would involve demonstrating the method’s ability to explain performance discrepancies in practical scenarios, such as medical diagnoses or insurance predictions. A crucial aspect would be showcasing how the framework’s detailed decomposition provides a more granular understanding of the performance gap compared to aggregate methods. Specific examples of real-world applications along with a careful analysis of the results would be pivotal. The effectiveness of the proposed method in pinpointing key variables contributing to the performance gap and the robustness of its estimates would be thoroughly examined. The analysis would likely include the comparison of the framework’s findings with those of existing methods, demonstrating its advantages and highlighting its applicability for informed decision-making and targeted interventions to enhance ML model performance in real-world settings.
Shapley Values#
The concept of Shapley values, borrowed from cooperative game theory, offers a compelling approach to quantify the contribution of individual features within a machine learning model’s performance. In the context of the research paper, Shapley values provide a principled way to decompose an overall performance gap (e.g., accuracy difference across domains) into feature-specific attributions. This decomposition goes beyond aggregate measures by dissecting the effects of covariate and outcome shifts, pinpointing which features most strongly influence these disparities. By assigning a value to the marginal contribution of each feature, Shapley values enable a deeper understanding of the model’s behavior and facilitate the identification of targeted interventions to improve performance. The nonparametric nature of the method is particularly attractive since it avoids strong parametric assumptions often required in competing approaches. However, the computational cost of calculating exact Shapley values can be substantial for high-dimensional datasets. The research cleverly addresses this challenge by adopting efficient approximation techniques.
Future Work#
The paper’s ‘Future Work’ section presents exciting avenues for expansion. Extending the framework to handle more complex performance metrics beyond 0-1 accuracy, such as AUC, is crucial for broader applicability. Similarly, adapting the methodology for unstructured data like images and text would greatly enhance its real-world utility. This would likely involve incorporating techniques to extract meaningful features or utilizing low-dimensional embeddings. Investigating label and prior shifts alongside the current covariate and outcome shifts would provide a more complete picture of domain adaptation challenges. Finally, a significant step would be to move beyond interpreting performance discrepancies to designing optimal interventions. This could involve exploring algorithmic modifications or operational fixes based on the decomposition results, moving the field towards a more actionable understanding of performance gaps.
More visual insights#
More on figures

The figure illustrates the proposed Hierarchical Decomposition of Performance Differences (HDPD) framework for explaining ML performance discrepancies across domains. The left panel shows a hierarchical decomposition of the overall performance gap into aggregate terms (covariate and outcome shifts) and further into detailed terms quantifying each feature’s contribution to these shifts. The right panel uses directed acyclic graphs (DAGs) to visually represent the aggregate and detailed decompositions, illustrating how interventions on different variable subsets affect the outcome and how these effects can be explained.

This figure illustrates the Hierarchical Decomposition of Performance Differences (HDPD) framework. The left panel shows a hierarchical decomposition of the performance gap between two domains, starting from an overall gap and breaking it down into covariate and outcome shifts (aggregate level), then further decomposing these into detailed contributions of individual features (detailed level). The right panel uses directed acyclic graphs to visualize the difference between aggregate and detailed decompositions, illustrating how targeted shifts in feature subsets can explain the overall performance gap.

This figure illustrates the proposed Hierarchical Decomposition of Performance Differences (HDPD) framework for analyzing ML performance discrepancies between two domains. The left panel shows a hierarchical decomposition of the overall performance gap into aggregate and detailed components. The right panel visually represents these decompositions using directed acyclic graphs (DAGs), highlighting the effects of covariate and outcome shifts on the overall performance gap.

This figure illustrates the hierarchical decomposition framework (HDPD) for analyzing ML performance discrepancies across domains. The left panel shows a breakdown of the overall performance gap into covariate shift and outcome shift components at the aggregate and detailed levels. The right panel uses directed acyclic graphs (DAGs) to visually represent how this decomposition relates to shifts in feature and outcome distributions.

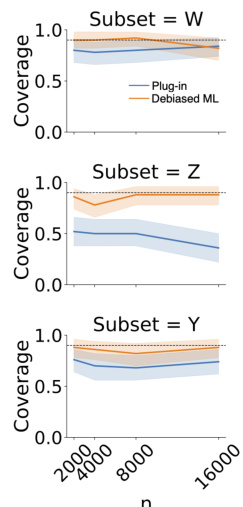
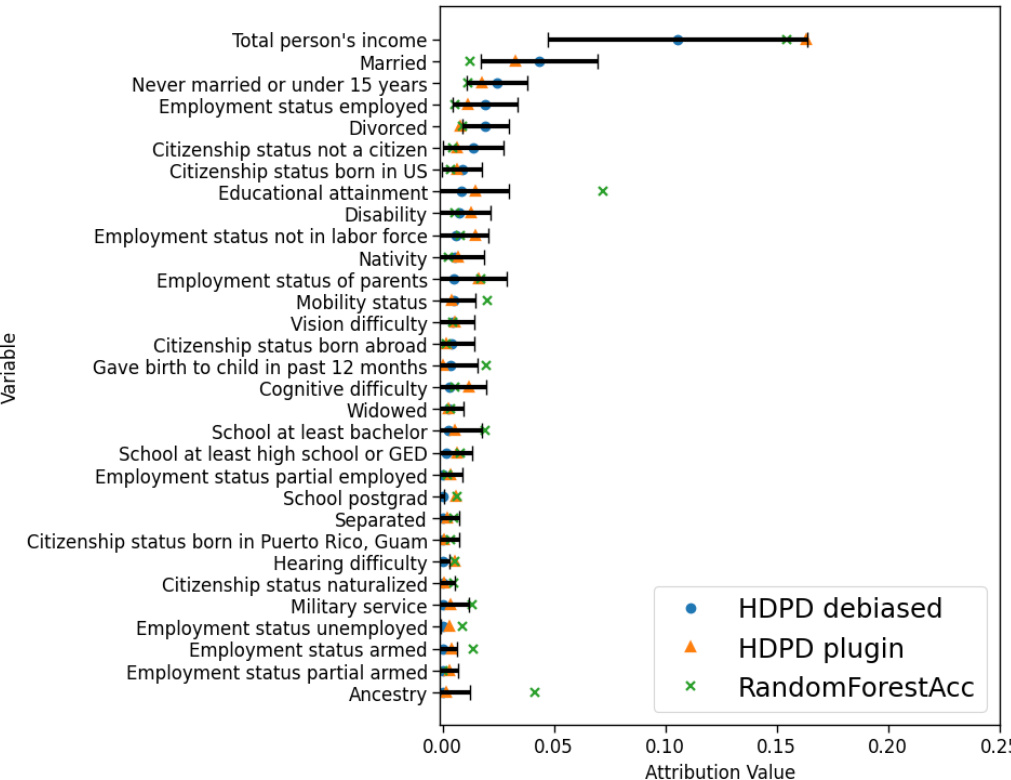
Figure 2(a) shows the coverage of 90% confidence intervals for the values of partial shifts for conditional covariate and outcome shifts for different dataset sizes. The dashed horizontal line indicates the desired 90% coverage rate. Figure 2(b) compares variable importance computed using the proposed method (HDPD, debiased) with other existing methods (WuShift, MeanChange, Oaxaca-Blinder, Plug-in).

This figure shows the results from applying the proposed hierarchical decomposition method to two real-world datasets. The left panel (a) shows the decomposition of the performance gap for a model predicting hospital readmission risk between two populations (general and heart failure patients). The right panel (b) shows the decomposition for a model predicting insurance coverage between two US states (Nebraska and Louisiana). Both panels depict the aggregate decomposition into covariate and outcome shift, as well as the detailed decomposition highlighting feature contributions to the covariate and outcome shift. Specific VI (variable importance) values are presented, with reference made to a more comprehensive list in the Appendix.

This figure visualizes the results of applying the Hierarchical Decomposition of Performance Differences (HDPD) framework to two real-world datasets. Panel (a) shows the decomposition of the performance gap in a readmission risk prediction model between general patient and heart failure patient populations. Panel (b) shows the decomposition for a model predicting insurance coverage across different US states. Each panel displays both aggregate decompositions (overall covariate and outcome shifts) and detailed decompositions (contributions of individual variables to each shift). The figure highlights the most influential variables affecting performance, enabling targeted investigations into the root causes of performance discrepancies.
More on tables

This table compares the proposed Hierarchical Decomposition of Performance Differences (HDPD) framework with existing methods for decomposing ML performance gaps. It highlights that HDPD uniquely combines aggregate and detailed decompositions in a nonparametric way, providing confidence intervals and not requiring causal graph knowledge. Prior methods only address parts of this hierarchical decomposition, often making parametric assumptions or requiring knowledge of the causal graph, limiting their applicability and interpretability.

This table compares the proposed Hierarchical Decomposition of Performance Differences (HDPD) framework with existing methods for decomposing machine learning performance gaps. It highlights that HDPD uniquely combines aggregate and detailed decompositions in a nonparametric way, offering confidence intervals and not requiring causal graph knowledge, unlike many previous approaches.

This table compares the proposed Hierarchical Decomposition of Performance Differences (HDPD) method with existing methods for decomposing machine learning (ML) performance gaps. It highlights HDPD’s unique ability to provide both aggregate and detailed decompositions in a nonparametric way, offering confidence intervals and not requiring knowledge of the causal graph.
Full paper#


