↗ OpenReview ↗ NeurIPS Homepage ↗ Chat
TL;DR#
Current methods for iteratively improving code with LLMs often use simplistic strategies, leading to suboptimal performance. This paper highlights the exploration-exploitation dilemma in this process: should you focus on refining the most promising programs or explore less-tested ones? This is a critical issue because every refinement requires additional LLM calls, which can be costly.
The researchers tackle this issue by formulating the problem as a multi-armed bandit and applying Thompson Sampling. Their resulting algorithm, REX (REfine, Explore, Exploit), intelligently balances exploration and exploitation. Experiments across various domains show that REX solves significantly more problems with fewer LLM calls, providing both improved effectiveness and cost efficiency. REX is broadly applicable to LLM-based code generation tasks.
Key Takeaways#
Why does it matter?#
This paper is important because it addresses a critical challenge in automated program synthesis using large language models (LLMs): the exploration-exploitation tradeoff during iterative code refinement. By framing refinement as a multi-armed bandit problem and employing Thompson Sampling, the researchers introduce a novel algorithm (REX) that significantly improves efficiency and effectiveness. This work is relevant to researchers exploring LLM-based code generation and program repair, specifically those working with complex programming problems where a one-shot approach is insufficient. It opens avenues for exploring adaptive search strategies in automated program synthesis and for developing more efficient and robust LLM-guided problem solving techniques.
Visual Insights#

The figure illustrates the exploration-exploitation tradeoff in program refinement using LLMs. The left panel shows a tree representing the infinite possibilities of iterative refinement, where each node is a program and each edge is a language model sample. The right panel illustrates the tradeoff, showing a choice between exploiting a program that is almost correct (80%) or exploring a less-explored program (60%), which could potentially lead to a better solution.
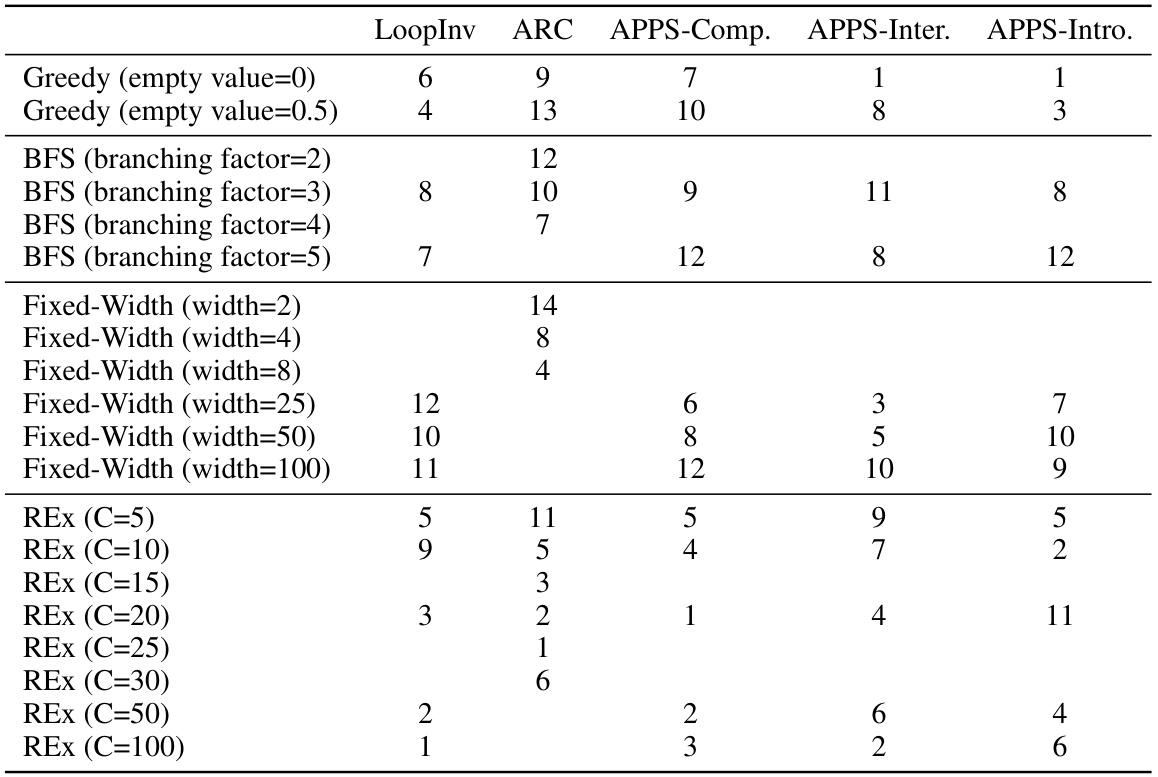
This table analyzes how sensitive different program synthesis methods are to their hyperparameters. The ranking is based on a combined AUC and final success rate. It shows that REx is relatively insensitive to its hyperparameter (C), consistently performing well across different problem types. Greedy and BFS (breadth-first search) show more significant changes with differing parameter settings.
In-depth insights#
LLM Code Refinement#
LLM code refinement represents a paradigm shift in automated program synthesis. Instead of aiming for perfect code generation in one attempt, this approach iteratively improves initial LLM-generated code using feedback, typically from test cases. This iterative process introduces a crucial exploration-exploitation tradeoff: should the system focus on refining the most promising code snippets (exploitation), or explore less refined options that might lead to better solutions (exploration)? Effective refinement strategies become critical to navigate this tradeoff, impacting both the quality of the resulting code and the computational efficiency of the method. The paper highlights the challenges of managing the potentially infinite search space and stochastic nature of LLM outputs during this refinement process. A key contribution lies in framing code refinement as a multi-armed bandit problem, proposing novel algorithms like Thompson Sampling to guide the iterative refinements. This approach balances exploration and exploitation, leading to significant improvements in problem-solving success rates across diverse problem domains while simultaneously reducing the overall number of LLM calls needed. Future work may focus on optimizing the heuristic functions used to assess code quality and exploring advanced bandit algorithms to further enhance the efficiency and robustness of this promising technique.
Explore-Exploit Tradeoff#
The core concept of the Explore-Exploit Tradeoff in the context of code repair with LLMs centers on the challenge of balancing two competing strategies during iterative refinement. Exploration involves investigating less-refined code versions, potentially uncovering hidden solutions that might perform better than currently favored candidates. Exploitation, conversely, focuses on improving already promising code snippets, capitalizing on existing gains to achieve incremental progress. The paper highlights the inherent uncertainty and stochastic nature of LLMs, emphasizing how choosing between exploration and exploitation becomes a critical decision-making problem. Effective strategies, such as Thompson Sampling, help mitigate this inherent uncertainty by probabilistically balancing these two crucial approaches. The key takeaway is that a well-balanced exploration-exploitation strategy, rather than simply favoring one approach, is crucial for efficiently solving complex programming problems with LLMs and minimizing the number of required LLM calls.
Thompson Sampling#
Thompson Sampling is a powerful algorithm for solving the exploration-exploitation dilemma in reinforcement learning and multi-armed bandit problems. It elegantly balances the need to explore less-certain options with the drive to exploit known good choices by maintaining a probability distribution over the possible rewards of each action. Instead of directly selecting the action with the highest expected reward, Thompson Sampling samples from these distributions, and selects the action corresponding to the highest sampled reward. This probabilistic approach ensures that even seemingly inferior actions have a chance of being selected, preventing the algorithm from getting stuck in local optima. The beauty of Thompson Sampling lies in its simplicity and effectiveness: its Bayesian nature allows for efficient updates to the reward distributions as new information becomes available, leading to rapid convergence towards optimal behavior. Its adaptability makes it particularly well-suited for dynamic environments where the reward distributions are not static, and its theoretical guarantees provide a strong foundation for its use in complex scenarios.
REX Algorithm#
The core of the research paper centers around the novel REX algorithm, a method designed to improve iterative code refinement using Large Language Models (LLMs). REX uniquely frames the refinement process as a multi-armed bandit problem, cleverly navigating the exploration-exploitation tradeoff inherent in iteratively improving code. Instead of simple greedy or breadth-first strategies, REX utilizes Thompson Sampling to probabilistically select which program to refine next, balancing the urge to exploit programs close to correctness against the need to explore less-refined alternatives. This approach, combined with a heuristic reward function that estimates program quality, allows REX to efficiently solve problems by dynamically adjusting its exploration and exploitation strategies, hence optimizing the usage of expensive LLM calls. The results demonstrate REX’s effectiveness across multiple programming challenges, including loop invariant synthesis, visual reasoning, and competitive programming, consistently achieving improved problem-solving rates while minimizing the overall LLM usage. The algorithm’s adaptive nature proves particularly valuable in addressing difficult problems that other methods struggle to solve, showcasing REX’s potential for significant advancements in LLM-based program synthesis.
Future Work#
The paper’s “Future Work” section could explore several promising avenues. Improving the heuristic function is crucial; more sophisticated metrics beyond simple pass/fail rates could significantly enhance performance. Investigating alternative bandit algorithms beyond Thompson Sampling, such as those designed for infinite-armed bandits or contextual bandits, could yield further improvements. Incorporating more advanced search strategies, potentially incorporating elements of Monte Carlo Tree Search (MCTS), warrants attention, particularly given the inherently tree-like structure of the refinement process. Finally, extending the methodology to different programming paradigms and languages beyond the ones studied would broaden the applicability and impact. This work could also delve into analyzing the qualitative aspects of code refinement, exploring how different refinement strategies influence the resulting code’s readability, maintainability, and efficiency.
More visual insights#
More on figures

This figure shows how the model’s belief about the benefit of refining a program changes based on the number of times it has been refined (N) and its heuristic value (h). The left panel shows that the expected benefit of refining decreases as N increases and asymptotically decays to zero. The middle and right panels show how the posterior beliefs, initially centered around h, shift towards zero with each refinement. The hyperparameter C controls the rate of decay and the initial concentration of the density around h.

The figure on the left shows the tree-like structure that results from the iterative refinement process, where each node represents a program and each edge represents a language model call that results in a refined version of the code. This tree is infinitely deep and wide due to the stochastic nature of the refinement process. The figure on the right illustrates the tradeoff between exploration (sampling a program that has not been explored thoroughly) and exploitation (sampling a program that is close to the solution). This tradeoff is crucial because it determines how the iterative refinement process proceeds.
This figure shows how the model’s belief about the benefit of refining a program changes based on the number of times it has been refined (N) and its heuristic value (h). The left panel illustrates the decay of the expected benefit of refinement with increasing refinements, asymptotically approaching zero. The middle and right panels display the shift of posterior beliefs from the heuristic value towards zero as the program is refined more, demonstrating an exploration-exploitation tradeoff. The hyperparameter C influences both the initial concentration of the posterior belief around the heuristic value and the rate of its decay.

The figure compares the performance of REx against three baselines (Greedy, Breadth-First Search, and Fixed-Width) across three different problem domains (Nonlinear Loop Invariant, APPS Competition, and ARC) in terms of the number of problems solved given a certain number of LLM calls. It shows that REx consistently outperforms or is competitive with the best baseline in all three domains. The box plots illustrate the robustness of REx to variations in hyperparameters.

This figure compares the performance of REx against three baseline methods (BFS, Greedy, and Fixed-Width) across three different LLMs (GPT-3.5-turbo, Claude-3.5-Sonnet, and Llama-3.1-405B) on the APPS Competition-Level dataset. The x-axis represents the sample budget (number of LLM requests), and the y-axis represents the success rate (percentage of problems solved). The figure shows that REx consistently outperforms or is competitive with the best-performing baseline methods across all three LLMs. The insets show box plots illustrating the distribution of AUC (Area Under the Curve) values for each method. Appendix Figure 12 shows similar results on the ARC dataset.

This figure compares the performance of REx against three baseline methods (Breadth-First Search, Fixed-Width, and Greedy) across four different problem sets: Nonlinear Loop Invariants, ARC, APPS Competition-Level, and APPS Introductory-Level. The y-axis represents the success rate (percentage of problems solved) and the x-axis shows the number of LLM calls (budget). The figure demonstrates that REx consistently outperforms or matches the best-performing baseline method for each problem set. The inset box plots illustrate the variation in performance for different hyperparameter settings for each algorithm, showing that REx is more robust to hyperparameter choices compared to baselines. This robustness is a key claim of the paper.

This figure shows a search tree generated by the REx algorithm. Each node represents a program, and the color gradient (blue to yellow) represents the heuristic value of that program (blue being low, yellow being high). The order of child nodes from left to right shows the order in which programs were generated. The figure illustrates how the algorithm explores and exploits different program refinements, guiding the search towards high-quality solutions.

The figure on the left shows the tree-like structure that results from iteratively refining a program using an LLM. The figure on the right illustrates the exploration-exploitation tradeoff in program refinement. The tradeoff is between exploiting refinements of programs that are closer to being correct (passing more test cases) and exploring less-explored programs.

This figure illustrates the exploration-exploitation tradeoff in program refinement. The left panel shows how the expected reward of refining a program decreases as the number of refinements (N) increases, asymptotically approaching zero. This demonstrates the exploitation aspect – refining a program many times yields diminishing returns. The middle and right panels show how posterior beliefs about a program’s optimality (θ) evolve with both N and the heuristic estimate of its correctness (h). Initially, beliefs center around h, but shift towards zero with each refinement. This shows the exploration aspect; programs with lower initial h values are still given a chance to improve.

The figure compares the performance of REx against three other methods (Breadth-First Search, Fixed-Width, and Greedy) across three different problem domains. The x-axis represents the number of LLM calls (compute budget), and the y-axis represents the success rate. The figure shows that REx consistently outperforms or is competitive with the best-performing baseline across the three domains. Inset boxplots illustrate the performance variability across different hyperparameter settings for each method.

This figure compares the performance of REx against other baselines (BFS, Greedy, and Fixed-Width) across three different LLMs (GPT-3.5-turbo, Claude-3.5-Sonnet, and Llama-3.1-405B) on the APPS Competition-Level dataset. The x-axis represents the sample budget (number of LLM requests), and the y-axis shows the success rate. The inset box plots show the distribution of success rates across multiple runs with different hyperparameter settings for each method. The figure demonstrates REx’s consistent superior performance across different LLMs and hyperparameter choices. More detailed results for ARC are given in Appendix Figure 12.

This figure demonstrates how the model’s belief in the effectiveness of refining a program changes based on the number of times it’s been refined (N) and its heuristic value (h). The left panel shows that the expected reward from refinement decreases and approaches zero as N increases. The middle and right panels illustrate that the model’s posterior belief about the program’s potential (θ) starts near the heuristic value (h) and shifts towards zero with each refinement attempt. The hyperparameter C controls the rate at which this belief shifts.

This figure compares the performance of REx against three baseline methods (BFS, Greedy, and FW) and the state-of-the-art method from Olausson et al. 2023 on the APPS Interview-Level dataset. The left panel shows the success rate (percentage of problems solved) as a function of the number of LLM calls (sample budget). The right panel provides box plots summarizing the final success rate, the area under the curve (AUC), and the number of LLM requests required to achieve similar performance as Olausson et al. 2023. REx demonstrates competitive or better performance compared to the baselines in terms of success rate and AUC, and significantly fewer LLM requests are needed to match the state-of-the-art method.

The figure illustrates the exploration-exploitation tradeoff in program refinement using LLMs. The left panel shows a tree representing the potentially infinite space of program refinements generated iteratively. The right panel depicts a simplified search state after three refinement steps. It highlights the choice between exploiting a refinement that is already quite close to being correct (80% correct) versus exploring a less refined program (60% correct) that might still lead to a better solution in subsequent steps. This tradeoff is central to the paper’s proposed algorithm.

The figure on the left shows a tree representing the iterative refinement process of improving a program with LLMs. Each node is a program and each edge represents an LLM sample generating a new, hopefully better program. The right side illustrates the exploration-exploitation tradeoff. Should refinement focus on the most promising program (exploit) or explore a less-explored program, even if it’s currently less promising?

This figure shows how the model’s belief about the benefit of refining a program changes based on the number of times it has been refined and its heuristic value. The left plot shows that the expected benefit of refining decreases and asymptotically decays to zero as the refinement count increases. The middle and right plots illustrate how posterior beliefs initially center around the heuristic value and shift towards zero with each refinement, showing that a program that has been heavily refined is less likely to be refined further. The hyperparameter C controls the rate of decay.
This figure compares the performance of four different program refinement methods (REX, BFS, Greedy, and Fixed Width) across three different datasets (APPS Competition, APPS Introductory, and Nonlinear Loop Invariants) and a visual reasoning puzzle dataset (ARC). The x-axis represents the number of LLM calls (compute budget), and the y-axis represents the percentage of problems solved. Darker lines represent results with optimal hyperparameters, while lighter lines show performance across a range of hyperparameter settings, emphasizing the robustness of REx. The inset box plots show the distribution of results for each method and different hyperparameters. Baselines included for comparison are listed in the caption.

The figure compares the performance of REx against three baselines (Greedy, Breadth-First Search, and Fixed-Width) across three different problem domains (APPS Competition, Nonlinear Loop Invariants, and ARC). The x-axis represents the number of LLM calls (budget), and the y-axis represents the success rate (percentage of problems solved). The main observation is that REx consistently achieves higher success rates for the same compute budget, particularly for challenging datasets. The figure includes box plots illustrating the effect of varying hyperparameters within each method and shows that REx is more robust to hyperparameter settings. Comparative baselines for each domain are also cited.
The figure compares the performance of four different program synthesis methods (REX, Breadth-First Search, Greedy, and Fixed-Width) across three different problem domains: APPS Competition, APPS Introductory, and Nonlinear Loop Invariants. The x-axis represents the number of LLM calls (compute budget), and the y-axis shows the success rate (percentage of problems solved). The figure shows that REx consistently outperforms other methods, solving more problems with fewer LLM calls. Box plots show the distribution of results across different hyperparameter settings for each method.

The figure compares the performance of REx against three baseline methods (Greedy, Breadth-First Search, and Fixed-Width) across three different problem domains: APPS Competition, Nonlinear Loop Invariant synthesis, and ARC. The x-axis represents the number of LLM calls (compute budget), and the y-axis represents the success rate in solving the problems. The figure shows that REx consistently outperforms or competes with the best baseline methods across all datasets, demonstrating its efficiency and robustness.

The figure consists of two parts. The left part shows the tree structure of possible program refinements using LLMs. The right part illustrates the exploration-exploitation tradeoff in program refinement. It shows that one can choose to either exploit by refining a program that is close to being correct (passing more tests) or explore by refining a less-explored program.
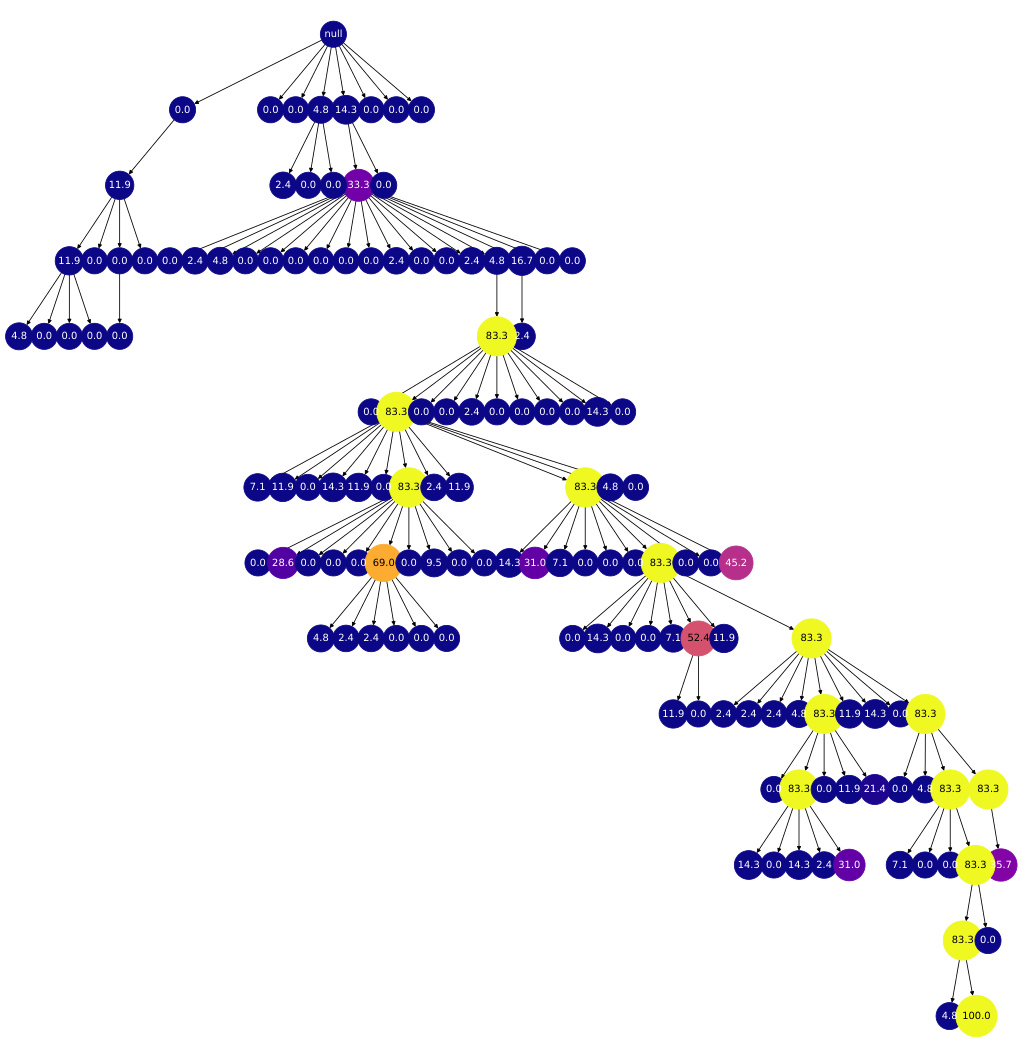
This figure shows a search tree generated by the REx algorithm. Nodes represent programs, and edges represent refinements. The color of each node indicates the heuristic value of the program it represents, with blue representing low heuristic values and yellow representing high heuristic values. The order of the nodes from left to right on each level of the tree shows the order in which the program refinements were explored. The figure illustrates the explore-exploit tradeoff employed by REx, where it explores programs with lower heuristic values but also prioritizes refining programs with high heuristic values. The appendix shows more example search trees.
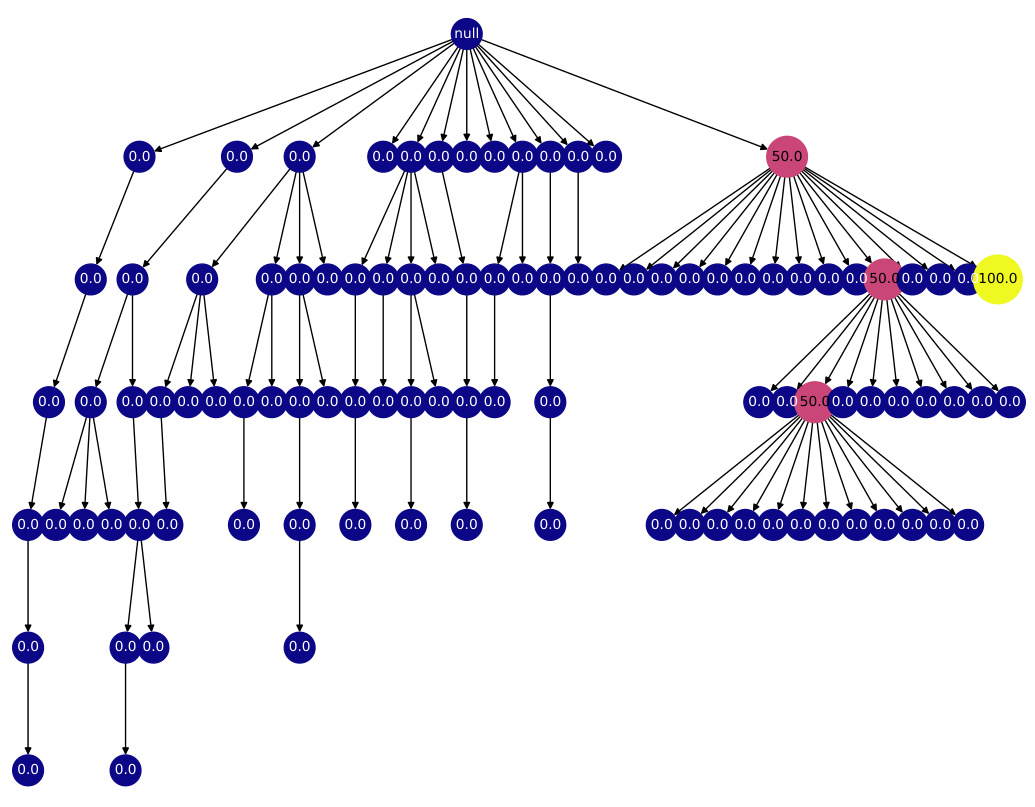
The figure on the left shows the search space for iterative code refinement using LLMs. The search space is an infinitely large tree because each refinement can lead to infinitely many other refinements. The figure on the right illustrates the explore-exploit tradeoff in choosing which branch to explore further during refinement. ‘Exploit’ focuses on refining programs that are close to correct, while ‘Explore’ explores programs that have not been explored enough.
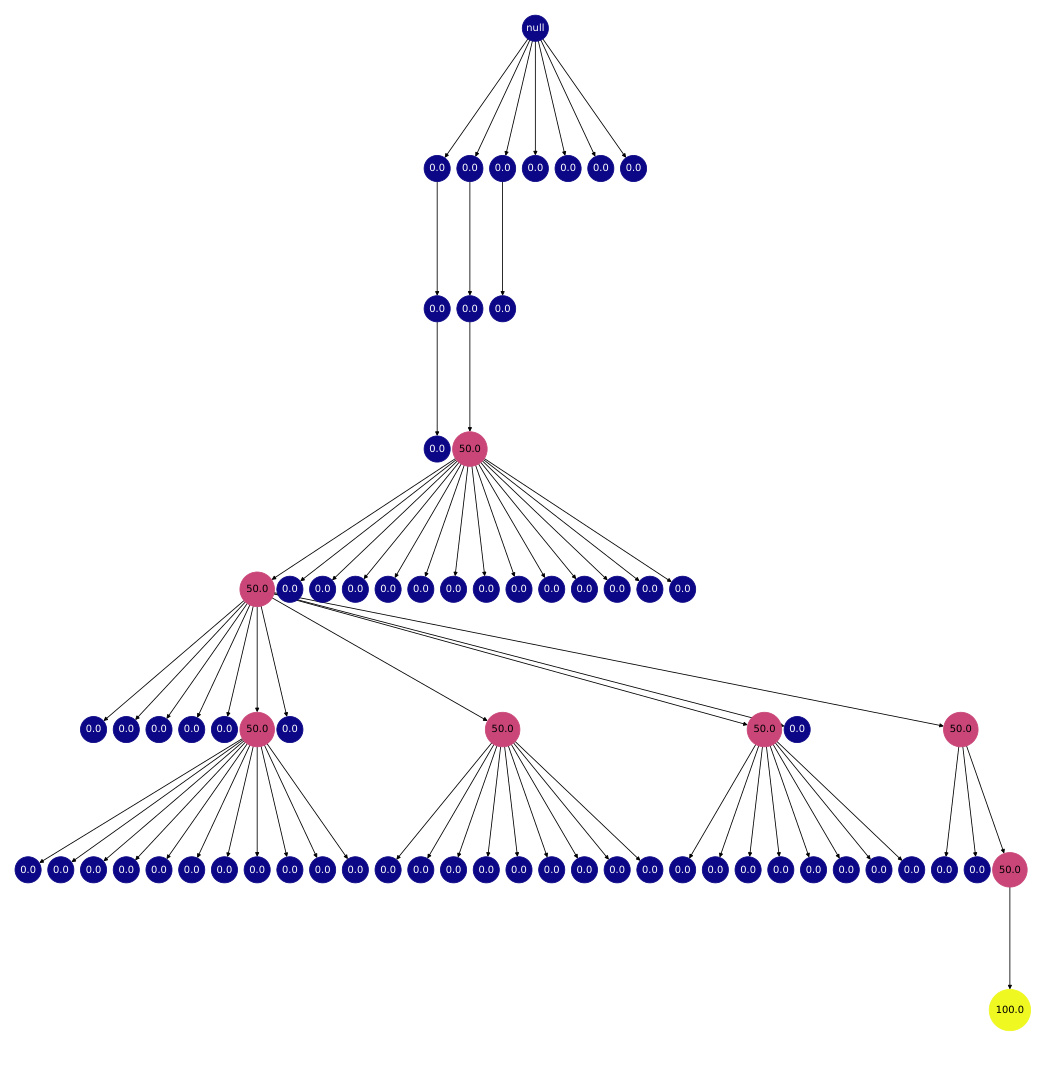
This figure shows an example of a search tree generated by the REx algorithm. Each node in the tree represents a program, and the edges represent refinements performed by the algorithm. The color of each node represents the heuristic value of the corresponding program, with blue indicating a low heuristic value and yellow indicating a high heuristic value. The order of the children of each node indicates the order in which the refinements were performed. The figure also shows that the algorithm explores multiple refinement paths before converging on a solution.
More on tables

This table presents the results of evaluating several programs on the NLA (non-linear arithmetic) benchmark. Each program has one or more loops that require non-linear loop invariants for verification. The table shows the type of invariant (NL = Non-linear or Linear), and whether each method (G-CLN, GSpacer, Loopy-GPT4, and REx) successfully found an invariant for each loop. A checkmark indicates success. The table helps to compare the effectiveness of different approaches in discovering non-linear loop invariants.

This table presents the results of evaluating several programs on a benchmark called NLA, which focuses on non-linear loop invariants. The table shows whether each method (G-CLN, GSpacer, Loopy-GPT4, and REx) successfully finds the loop invariants for different programs. Each program may have multiple loops, which are numbered from outer to inner. The ‘InvType’ column specifies whether the loop invariant is non-linear (‘NL’) or linear (‘Linear’). This helps in understanding the complexity of the task.

This table analyzes how sensitive different code generation methods are to changes in their hyperparameters. It ranks methods based on a combined score of AUC (Area Under the Curve) and final success rate. The table shows that REx, a new method presented in the paper, is relatively insensitive to hyperparameter choices, unlike other methods such as Greedy, BFS, and Fixed-Width, and outperforms or is competitive with these other methods when its hyperparameter C is set to 20. This is particularly true for challenging benchmarks.

This table analyzes how sensitive different code refinement methods are to their hyperparameters. The methods are evaluated across multiple benchmarks (APPS Competition, APPS Interview, APPS Introductory, ARC, and Nonlinear Loop Invariants), using the area under the curve (AUC) and final success rate. The table shows that the performance of methods other than REx is highly dependent on the specific hyperparameter values chosen. In contrast, REx demonstrates consistent outperformance or competitive performance, even when varying the hyperparameter C.

This table analyzes how sensitive different code generation methods are to their hyperparameters by showing their performance rankings across various benchmarks. The ranking is calculated using a combination of AUC and final success rate. The table highlights that REx demonstrates consistent top-tier performance or competitiveness against other leading methods, particularly when its hyperparameter C is set to 20, across challenging benchmarks.

This table presents a hyperparameter analysis of various code generation methods, including REx, across different benchmarks (LoopInv, ARC, APPS-Comp, APPS-Inter, APPS-Intro). The analysis focuses on the impact of adjusting hyperparameters on the methods’ performance, using a ranking system based on the average of AUC and final success rate. It shows REx’s robustness to hyperparameter variations, particularly when C = 20.
Full paper#


