TL;DR#
Current preference-based evolutionary multi-objective optimization (PBEMO) methods often struggle with inefficiency and misalignment with human preferences, particularly due to reliance on reward models and the stochastic nature of human feedback. These issues lead to mis-calibrated reward models and inefficient use of human time and computational resources. This limits the applicability of PBEMO methods to real-world scenarios.
This paper introduces D-PBEMO, a novel framework that tackles these issues directly. It uses a clustering-based stochastic dueling bandits algorithm, eliminating the need for a predefined reward model. This model-free approach learns preferences directly from pairwise comparisons, scaling efficiently to high-dimensional problems. Furthermore, D-PBEMO incorporates a principled termination criterion to manage human cognitive load and computational cost. Experiments show D-PBEMO’s effectiveness, exceeding the performance of existing algorithms on diverse benchmark problems, including those involving RNA inverse design and protein structure prediction.
Key Takeaways#
Why does it matter?#
This paper is crucial for researchers in multi-objective optimization and human-in-the-loop machine learning. It directly addresses the limitations of existing preference-based methods by proposing a novel, efficient framework. The model-free approach and principled termination criterion are particularly significant, offering improved efficiency and alignment with human cognitive constraints. The successful application to complex real-world problems further highlights its potential impact.
Visual Insights#

🔼 Figure 1(a) shows a flow chart of a conventional Preference-Based Evolutionary Multi-Objective Optimization (PBEMO) method, illustrating the three main modules: Optimization, Consultation, and Preference Elicitation. The optimization module explores the search space, the consultation module interacts with the decision-maker (DM) to obtain preference information, and the preference elicitation module transforms this information into a format that guides the optimization process. Figure 1(b) compares three different preference learning strategies in the Consultation module: Reward/Ranking, Parametric/Structured, and Direct. The Reward/Ranking strategy uses scores or rankings from the DM, while the Parametric/Structured strategy uses a parameterized model of preferences, and the Direct strategy uses pairwise comparisons from the DM without explicit reward models.
read the caption
Figure 1: (a) Flow chart of a conventional PBEMO. (b) Conceptual illustration of reward-based, model-based, and direct preference learning strategies.
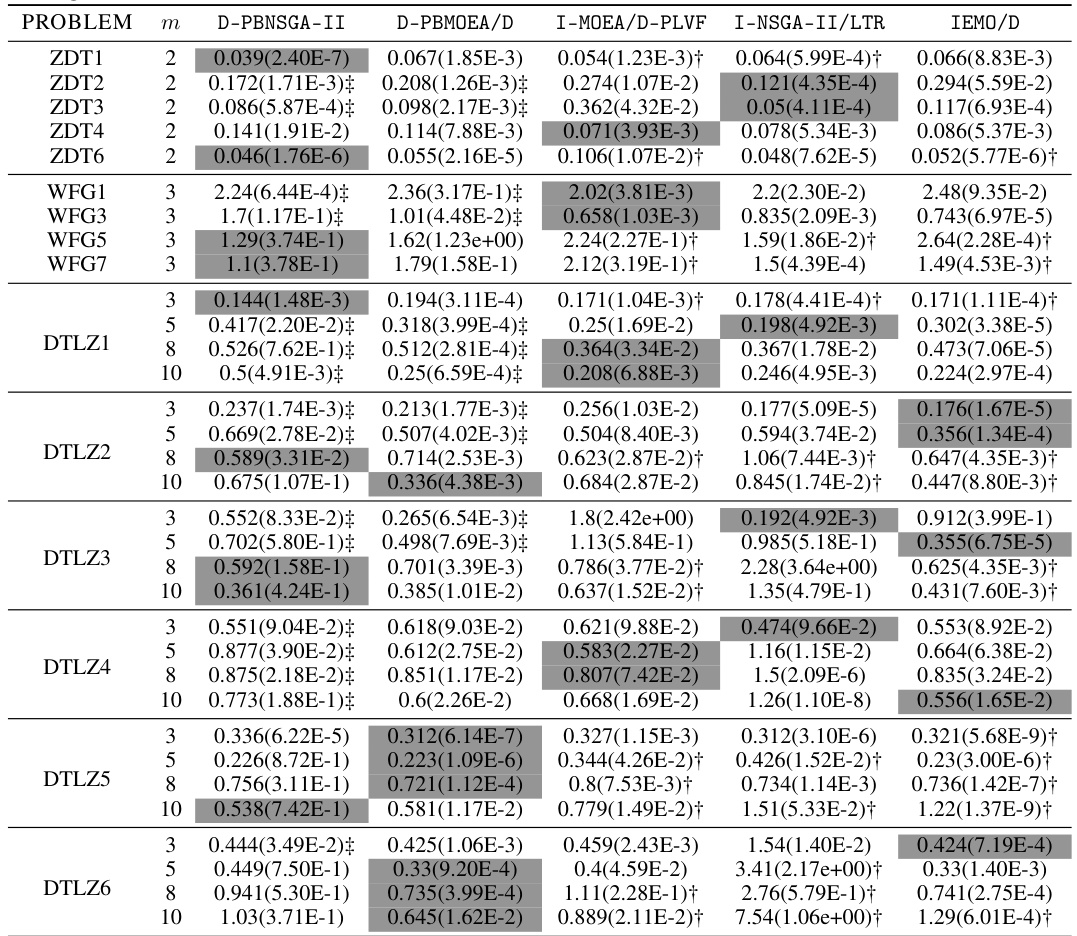
🔼 This table presents the results of a statistical comparison between the proposed D-PBEMO algorithm and existing state-of-the-art PBEMO algorithms across various benchmark problems. The metric used for comparison is the approximation accuracy (ε*(S)), which measures the closeness of the obtained solutions (S) to the decision maker’s preferred solution in the objective space. The mean and standard deviation of ε*(S) are reported for each algorithm on each problem. The table highlights cases where the proposed algorithm significantly outperforms or is significantly underperformed by the comparison algorithms, according to the Wilcoxon rank-sum test at a 0.05 significance level.
read the caption
Table A5: The mean(std) of €* (S) obtained by our proposed D-PBEMO algorithm instances against the peer algorithms.
In-depth insights#
Dueling Bandit MO#
Incorporating dueling bandits into multi-objective optimization (MO) offers a novel approach to preference elicitation. Dueling bandits efficiently leverage pairwise comparisons, allowing decision-makers to express preferences between solution pairs, rather than ranking a large set. This is particularly useful in MO where the concept of a single “best” solution is often not applicable. By directly modeling preferences through comparisons, the method avoids the complexities and potential biases of reward models often used in preference-based MO. However, challenges arise in scaling dueling bandits to high-dimensional spaces where the number of possible solutions (arms) is vast. Algorithms will need to incorporate smart sampling strategies and efficient data structures to reduce computation and human cognitive load. A hybrid approach, combining clustering or other dimensionality reduction techniques with dueling bandits, could be a promising path toward efficient and effective preference learning in complex multi-objective problems. Future research should explore effective algorithms and theoretical analyses of regret bounds in this context.
Direct Preference EMO#
Direct Preference Evolutionary Multi-Objective Optimization (EMO) represents a significant advancement in handling multi-objective problems by directly incorporating human preferences. Traditional EMO methods often struggle to efficiently navigate the Pareto front to find solutions aligning with decision-maker preferences. Direct Preference EMO bypasses the need for intermediate reward models or complex preference learning, thus streamlining the process and improving alignment with the decision-maker’s true aspirations. By using techniques like clustering-based stochastic dueling bandits, it efficiently leverages pairwise comparisons to directly learn preferences, avoiding the complexities and potential biases inherent in alternative approaches. The resulting preference model is incorporated into the EMO algorithm, guiding the search toward preferred regions of the Pareto front more effectively. Furthermore, this approach offers a principled termination criterion, managing human cognitive load and computational costs. The model-free nature of Direct Preference EMO makes it robust and adaptable, handling the stochastic nature of human feedback without relying on strong distributional assumptions. This makes Direct Preference EMO a powerful and promising technique for solving complex real-world multi-objective optimization challenges where direct human involvement is crucial.
Clustering Bandits#
Clustering bandits represent a novel approach to address the limitations of traditional dueling bandits, particularly in high-dimensional settings where the number of arms is substantial. The core idea involves partitioning the arms into clusters, thus reducing the complexity of pairwise comparisons. This clustering strategy effectively mitigates the computational burden associated with directly comparing all arms and allows for strategic exploration and exploitation within clusters. Furthermore, clustering incorporates prior knowledge or inherent structure among arms, potentially leading to faster convergence and improved regret bounds compared to methods that treat arms independently. However, careful consideration must be given to the choice of clustering algorithm and the potential impact of poorly-formed clusters which may hinder performance. The optimal clustering technique will likely depend on the specific application and characteristics of the arms. Effective clustering can thus significantly improve the efficiency and scalability of dueling bandit algorithms, opening avenues for applications previously deemed intractable.
Regret Bound Analysis#
A regret bound analysis for a dueling bandit algorithm is crucial for understanding its efficiency. It quantifies the difference between the performance of the algorithm and that of an optimal strategy. In the context of preference-based multi-objective optimization (PBEMO), where human feedback guides the search, analyzing regret is especially important because human involvement is costly. A tight regret bound provides strong theoretical guarantees on the efficiency of the proposed consultation module, indicating that it strategically scales well with high-dimensional dueling bandits. The analysis typically involves making assumptions about the stochastic nature of human feedback and the properties of the underlying preference distribution. Demonstrating a regret bound that is sub-linear in the number of queries suggests the algorithm learns efficiently, which is essential for managing the cognitive load on human participants. The effectiveness of the clustering-based approach can also be evaluated by comparing its regret bound with the regret bounds of other dueling bandit algorithms. A significant improvement in the regret bound would further strengthen the proposed method’s advantage in efficiency and scalability for PBEMO applications. Ultimately, a rigorous regret bound analysis provides crucial insights into the algorithm’s theoretical performance and its practicality for real-world applications.
PBEMO Advancements#
Preference-based Evolutionary Multi-objective Optimization (PBEMO) has seen significant advancements, addressing limitations of traditional MO methods. Early PBEMO struggled with inefficient human-in-the-loop interaction, often requiring numerous queries. Recent work focuses on model-free approaches, reducing the need for complex reward models and model selection. This improves efficiency and better aligns with DM’s true preferences, particularly relevant with the stochastic nature of human feedback. New algorithms leverage techniques like dueling bandits, enabling strategic preference learning through pairwise comparisons. Clustering methods further enhance scalability, allowing PBEMO to handle higher-dimensional problems. Though challenges still exist regarding regret analysis and handling of highly stochastic feedback, the shift towards model-free and scalable approaches marks a considerable step forward in PBEMO’s development, potentially enhancing usability in real-world applications.
More visual insights#
More on figures

🔼 This figure illustrates the process of the proposed D-PBEMO algorithm. Panel (a) shows an initial EMO population divided into three clusters (subsets). One cluster, S², contains solutions of interest (SOI), represented by a star. Panel (b) shows the result of applying the D-PBEMO algorithm; the algorithm successfully steers solutions towards the SOI, resulting in tighter clusters around the SOI.
read the caption
Figure 2: (a) The evolutionary population of an EMO algorithm is divided into three subsets, where S² covers the SOI (denoted as a *). (b) After a PBEMO round, in the next consultation session, all solutions are steered towards the SOI and their spreads become more tightened towards the SOI.

🔼 This figure shows the density ratio between the winning probability distribution (pw(x)) and the losing probability distribution (pl(x)) for a solution x. The blue shading represents the actual density ratio, while the red shading shows its estimation. Importantly, the solution of interest (SOI) lies within the 95% confidence interval of the estimated Gaussian distribution, highlighting the effectiveness of the density-ratio estimation method in locating the SOI.
read the caption
Figure 3: The density ratio between p₁(x) and pe(x) is shaded in blue, while its estimation is shaded in red. The SOI falls within the estimated Gaussian distribution for 95% confidence interval.

🔼 This figure shows the results of the Scott-Knott test, a statistical method used to compare the performance of multiple algorithms. The box plots represent the distribution of ranks obtained by five different algorithms (D-PBNSGA-II, D-PBMOEA/D, I-MOEA/D-PLVF, I-NSGA-II/LTR, IEMO/D) across 33 benchmark problems, each run 20 times. The ranking indicates the relative performance of each algorithm in terms of achieving the lowest error (€*(S) and ē(S)). A lower rank signifies better performance.
read the caption
Figure 4: Box plot for the Scott-Knott test rank of D-PBEMO and peer algorithms achieved by 33 test problems running for 20 times. The index of algorithms are as follows: 1 → D-PBNSGA-II, 2 → D-PBMOEA/D, 3→ I-MOEA/D-PLVF, 4→ I-NSGA-II/LTR, 5→ IEMO/D.

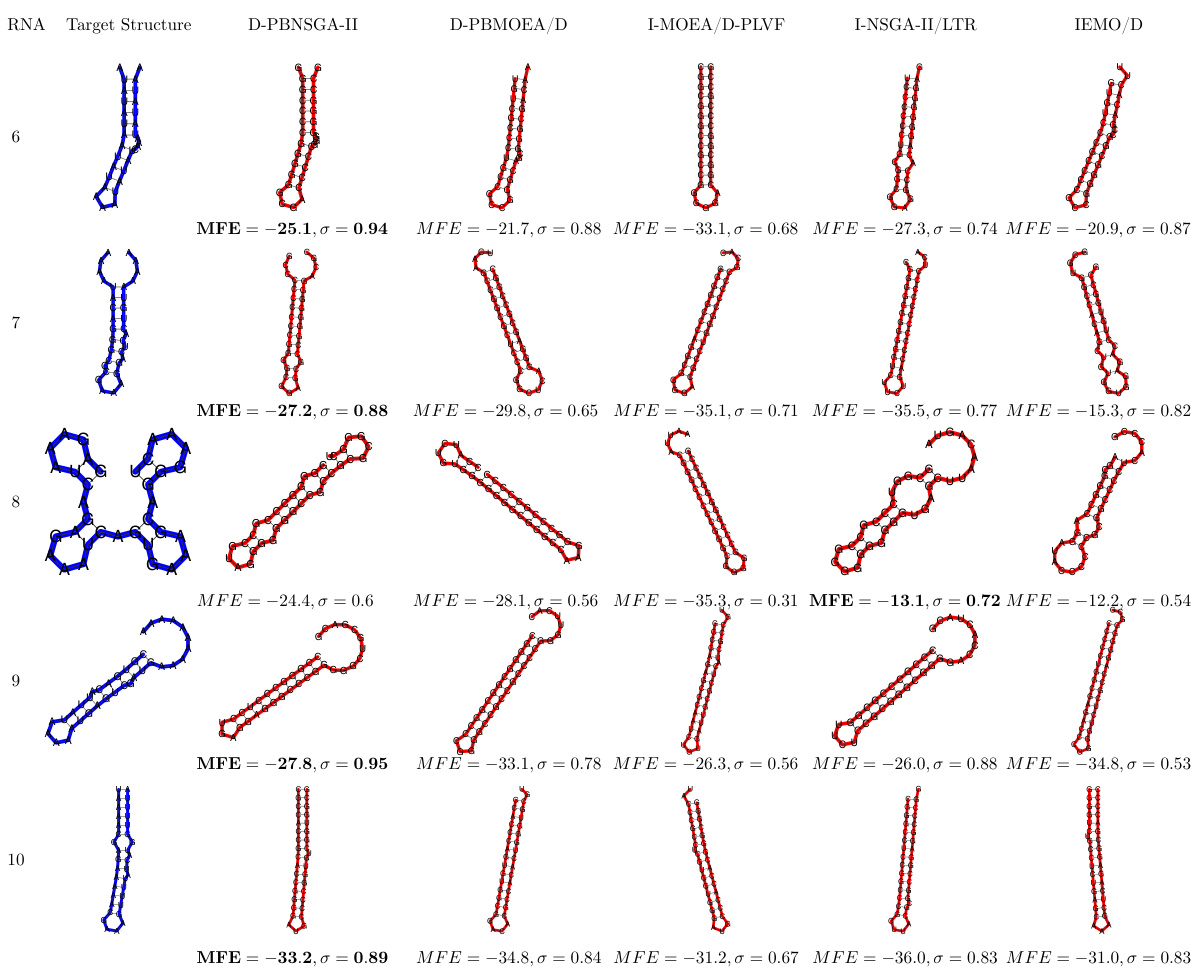
🔼 This figure compares the performance of the proposed D-PBNSGA-II algorithm against three other state-of-the-art preference-based evolutionary multi-objective optimization (PBEMO) algorithms on a specific RNA inverse design task. The target RNA secondary structure is shown in blue, and the predicted structures generated by each algorithm are shown in red. The comparison is based on two metrics: the minimum free energy (MFE) and the similarity (σ) between the predicted and target structures. A higher σ value (closer to 1) indicates better similarity, and a lower MFE value indicates higher stability. The results suggest that D-PBNSGA-II outperforms other algorithms in this specific task, achieving both higher similarity and better stability. Appendix F contains the full results of this experiment.
read the caption
Figure 5: Comparison result of D-PBNSGA-II against the other three state-of-the-art PBEMO algorithms on a selected RNA inverse design task (Eterna ID: 852950). The target structure is shaded in blue color while the predicted structures obtained by different optimization algorithms are highlighted in red color. In this experiment, the preference is set to σ = 1. The closer σ is to 1, the better performance achieved by the corresponding algorithm. When the σ shares the same biggest value, the smaller MFE the better the performance is. Full results can be found in Appendix F.

🔼 This figure compares the results of five different PBEMO algorithms (D-PBNSGA-II, D-PBMOEA/D, I-MOEA/D-PLVF, I-NSGA-II/LTR, and IEMO/D) on five different protein structure prediction (PSP) tasks. The native protein structure is shown in blue, and the predicted structure from each algorithm is shown in red. The Root Mean Square Deviation (RMSD) value is provided for each prediction, indicating the difference between the predicted structure and the native structure; lower RMSD values indicate better prediction accuracy. The figure visually demonstrates the superior performance of the proposed D-PBEMO algorithms compared to the existing ones.
read the caption
Figure 6: Experiments results for comparison results between D-PBEMO and the other three state-of-the-art PBEMO algorithms on the PSP problems. In particular, the native protein structure is represented in a blue color while the predicted one obtained by different optimization algorithms are highlighted in a red color. The smaller RMSD as defined in Equation (29) of appendix, the better performance achieved by the corresponding algorithm.

🔼 This figure illustrates the process of the proposed D-PBEMO algorithm. Part (a) shows the initial partitioning of the evolutionary population into subsets, with one subset (S2) containing the solution of interest (SOI). Part (b) demonstrates how the algorithm uses human feedback in subsequent consultation sessions to steer the search towards the SOI, resulting in a population that is more tightly clustered around the SOI.
read the caption
Figure 2: (a) The evolutionary population of an EMO algorithm is divided into three subsets, where §2 covers the SOI (denoted as a *). (b) After a PBEMO round, in the next consultation session, all solutions are steered towards the SOI and their spreads become more tightened towards the SOI.

🔼 This box plot visualizes the results of a Scott-Knott test, comparing the performance of the proposed D-PBEMO algorithm (D-PBNSGA-II and D-PBMOEA/D) against four other state-of-the-art PBEMO algorithms across 33 benchmark problems. Each problem was run 20 times, and the ranks from the Scott-Knott test are displayed as box plots for each algorithm. This visualization facilitates the comparison of algorithm performance in terms of ranking.
read the caption
Figure 4: Box plot for the Scott-Knott test rank of D-PBEMO and peer algorithms achieved by 33 test problems running for 20 times. The index of algorithms are as follows: 1 → D-PBNSGA-II, 2 → D-PBMOEA/D, 3→ I-MOEA/D-PLVF, 4→ I-NSGA-II/LTR, 5→ IEMO/D.

🔼 This figure displays the results of a Scott-Knott test, a statistical method used to compare the performance of multiple algorithms. The box plots show the ranks of five different algorithms (D-PBNSGA-II, D-PBMOEA/D, I-MOEA/D-PLVF, I-NSGA-II/LTR, IEMO/D) across 33 test problems, each run 20 times. The ranking is based on the approximation accuracy (ε*(S)) and average accuracy (ē(S)) metrics. Lower ranks indicate better performance.
read the caption
Figure 4: Box plot for the Scott-Knott test rank of D-PBEMO and peer algorithms achieved by 33 test problems running for 20 times. The index of algorithms are as follows: 1 → D-PBNSGA-II, 2 → D-PBMOEA/D, 3→ I-MOEA/D-PLVF, 4→ I-NSGA-II/LTR, 5→ IEMO/D.

🔼 This figure illustrates the process of the proposed D-PBEMO algorithm. (a) shows the initial state where the evolutionary population is divided into subsets based on the solution features and one subset contains the solutions of interest (SOI), represented by a star. (b) shows that after one round of PBEMO, the solutions are guided towards the SOI by the learned preferences which results in a tighter spread around the SOI.
read the caption
Figure 2: (a) The evolutionary population of an EMO algorithm is divided into three subsets, where S2 covers the SOI (denoted as a *). (b) After a PBEMO round, in the next consultation session, all solutions are steered towards the SOI and their spreads become more tightened towards the SOI.

🔼 This figure shows the population distribution of the proposed D-PBMOEA/D algorithm and its convergence towards the Pareto front on four different DTLZ test problems (DTLZ1-DTLZ4) with 3 objectives (m=3). The gray lines represent the true Pareto front, the black dots represent the obtained solutions in the population, and the red star (*) indicates the reference point used to guide the search for the solution of interest (SOI). For each problem, the figure illustrates how the population of solutions is steered towards the SOI during the optimization process, showing the algorithm’s effectiveness in converging to the desired area of the Pareto front that meets the DM’s preferences.
read the caption
Figure A10: The population distribution of our proposed method (i.e., D-PBMOEA/D) running on DTLZ test suite (m = 3).

🔼 This figure illustrates the iterative process of the proposed D-PBEMO algorithm. Panel (a) shows an initial population of solutions clustered into three subsets, with one subset (S2) containing solutions of interest (SOI). Panel (b) demonstrates how, after incorporating human preference feedback through the consultation and preference elicitation modules, the algorithm refines the population in the subsequent consultation session. Solutions are drawn closer to the SOI, indicating improved convergence towards the desired region.
read the caption
Figure 2: (a) The evolutionary population of an EMO algorithm is divided into three subsets, where §2 covers the SOI (denoted as a *). (b) After a PBEMO round, in the next consultation session, all solutions are steered towards the SOI and their spreads become more tightened towards the SOI.

🔼 This figure shows the population distribution of the proposed D-PBMOEA/D algorithm and the Pareto front on four different DTLZ test problems with 3 objectives. It illustrates how the algorithm’s population of solutions is distributed across the objective space and how it approaches the Pareto front over different generations. Each subplot represents a different DTLZ problem and shows the progression of the population towards the Pareto front.
read the caption
Figure A10: The population distribution of our proposed method (i.e., D-PBMOEA/D) running on DTLZ test suite (m = 3).

🔼 This figure illustrates the process of the proposed D-PBEMO algorithm. (a) shows how the initial population is partitioned into clusters. One cluster contains solutions close to the SOI, denoted by a star. (b) demonstrates that after one iteration of the algorithm, the population shifts towards the SOI, and the spread of solutions around the SOI is reduced.
read the caption
Figure 2: (a) The evolutionary population of an EMO algorithm is divided into three subsets, where S2 covers the SOI (denoted as a *). (b) After a PBEMO round, in the next consultation session, all solutions are steered towards the SOI and their spreads become more tightened towards the SOI.
🔼 This figure compares the results of D-PBEMO algorithms against three other state-of-the-art PBEMO algorithms on five protein structure prediction (PSP) tasks. The native protein structure is shown in blue, while the predicted structures from each algorithm are shown in red. The smaller the root mean squared deviation (RMSD) value, which is a measure of the difference between the native and predicted structures, the better the algorithm’s performance. This visual comparison highlights the effectiveness of D-PBEMO in achieving more accurate protein structure predictions compared to the other algorithms.
read the caption
Figure 6: Experiments results for comparison results between D-PBEMO and the other three state-of-the-art PBEMO algorithms on the PSP problems. In particular, the native protein structure is represented in a blue color while the predicted one obtained by different optimization algorithms are highlighted in a red color. The smaller RMSD as defined in Equation (29) of appendix, the better performance achieved by the corresponding algorithm.

🔼 This figure compares the performance of D-PBEMO against three other state-of-the-art PBEMO algorithms on five protein structure prediction (PSP) tasks. The native protein structure is shown in blue, while the predicted structures from each algorithm are shown in red. The metric used for comparison is RMSD (root mean square deviation), a measure of the difference between the predicted and native structures. Lower RMSD values indicate better prediction accuracy. The figure visually demonstrates the superior performance of D-PBEMO in accurately predicting protein structures compared to the other algorithms.
read the caption
Figure 6: Experiments results for comparison results between D-PBEMO and the other three state-of-the-art PBEMO algorithms on the PSP problems. In particular, the native protein structure is represented in a blue color while the predicted one obtained by different optimization algorithms are highlighted in a red color. The smaller RMSD as defined in Equation (29) of appendix, the better performance achieved by the corresponding algorithm.
More on tables

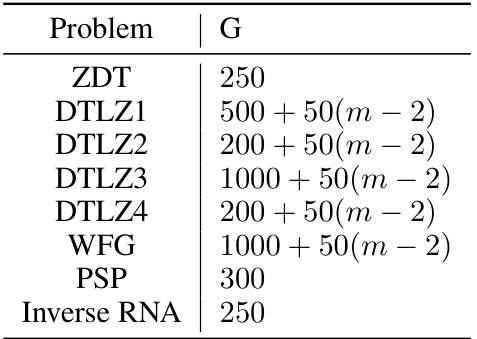
🔼 This table shows the population size (N) used in the experiments for different multi-objective optimization problem instances. The problems are categorized into ZDT, DTLZ, WFG, PSP, and Inverse RNA, each with a specified number of objectives (m). The population size is a parameter used in evolutionary algorithms to control the diversity and convergence of the search process.
read the caption
Table A2: Population size in different problems
🔼 This table shows the mean and standard deviation of the approximation accuracy metric (ϵ*(S)) for different multi-objective optimization algorithms. The algorithms are compared across various benchmark problems with different numbers of objectives (m). The table highlights cases where the proposed D-PBEMO algorithm significantly outperforms or is outperformed by the other algorithms using the Wilcoxon rank sum test.
read the caption
Table A5: The mean(std) of ϵ*(S) obtained by our proposed D-PBEMO algorithm instances against the peer algorithms.

🔼 This table presents the mean and standard deviation of the approximation accuracy (ϵ⋆(S)) achieved by the proposed D-PBEMO algorithm (D-PBNSGA-II and D-PBMOEA/D) and three state-of-the-art PBEMO algorithms (I-MOEA/D-PLVF, I-NSGA-II/LTR, IEMO/D) across various multi-objective optimization problem instances. The results are categorized by problem type (ZDT, DTLZ, WFG) and number of objectives (m). A † symbol indicates that the proposed method significantly outperforms the peer algorithms according to a Wilcoxon rank-sum test at a 0.05 significance level, while a ‡ symbol indicates the opposite.
read the caption
Table A5: The mean(std) of ϵ⋆(S) obtained by our proposed D-PBEMO algorithm instances against the peer algorithms.
🔼 This table presents the mean and standard deviation of the approximation accuracy (ε* (S)) for 33 test problems, comparing the performance of D-PBNSGA-II and D-PBMOEA/D against three state-of-the-art PBEMO algorithms: I-MOEAD-PLVF, I-NSGA2/LTR, and IEMO/D. The results show the average distance of the non-dominated solutions obtained by each algorithm to the DM’s preferred solution. The statistical significance is indicated using the Wilcoxon signed-rank test at a 0.05 significance level, highlighting instances where D-PBEMO algorithms demonstrate statistically significant better performance than its peers.
read the caption
Table A5: The mean(std) of €* (S) obtained by our proposed D-PBEMO algorithm instances against the peer algorithms.
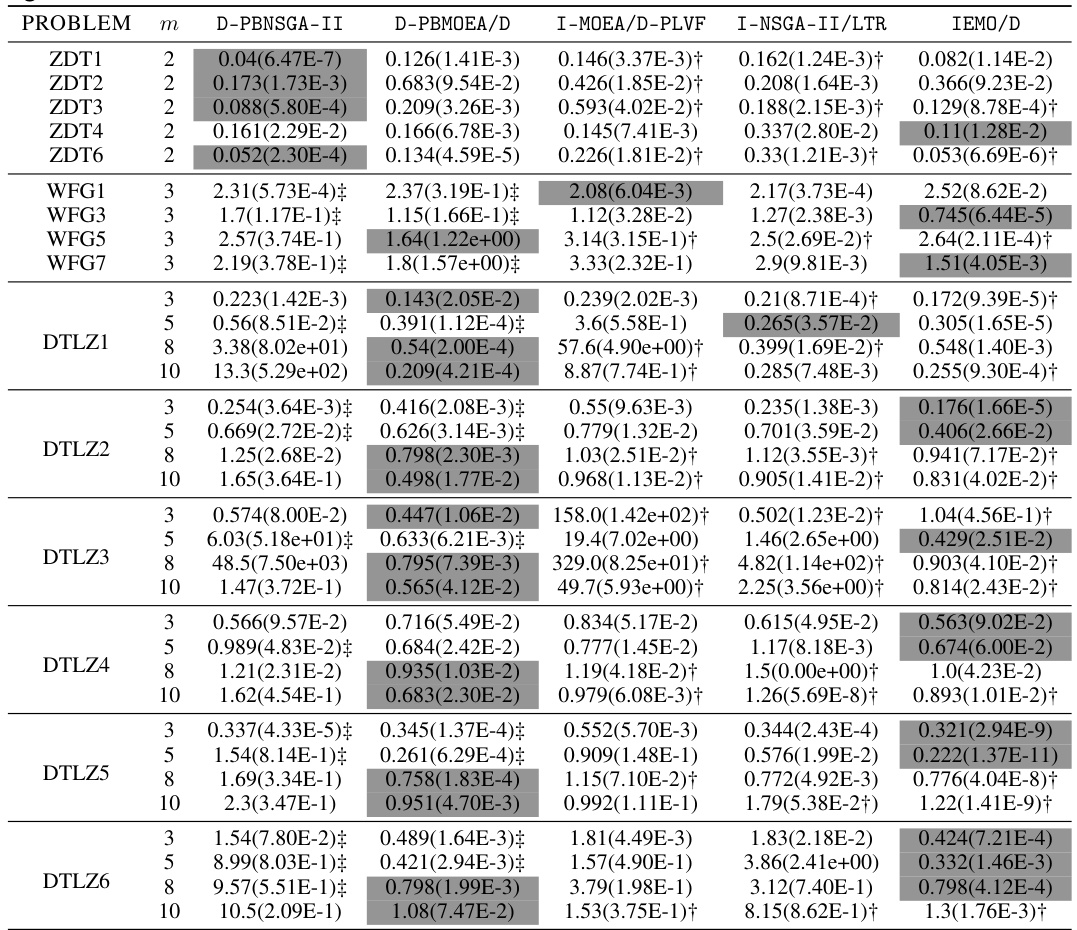
🔼 This table presents the mean and standard deviation of the approximation accuracy (ε* (S)) achieved by the proposed D-PBEMO algorithm (D-PBNSGA-II and D-PBMOEA/D) and three state-of-the-art PBEMO algorithms (I-MOEAD-PLVF, I-NSGA-II/LTR, and IEMO/D). The results are shown for various multi-objective optimization problem instances from the ZDT, DTLZ, and WFG test suites, with different numbers of objectives (m). A Wilcoxon rank-sum test was performed to compare the algorithms, indicating statistically significant superior performance for the proposed approach in many cases.
read the caption
Table A5: The mean(std) of ε* (S) obtained by our proposed D-PBEMO algorithm instances against the peer algorithms.
🔼 This table presents the mean and standard deviation of the approximation accuracy (ε*(S)) for different multi-objective optimization algorithms. It compares the performance of the proposed D-PBEMO algorithms (D-PBNSGA-II and D-PBMOEA/D) against three state-of-the-art algorithms (I-MOEA/D-PLVF, I-NSGA-II/LTR, and IEMO/D) across various benchmark problems (ZDT, DTLZ, and WFG). The results are shown for different numbers of objectives (m) and highlight statistically significant differences in performance.
read the caption
Table A5: The mean(std) of €* (S) obtained by our proposed D-PBEMO algorithm instances against the peer algorithms.
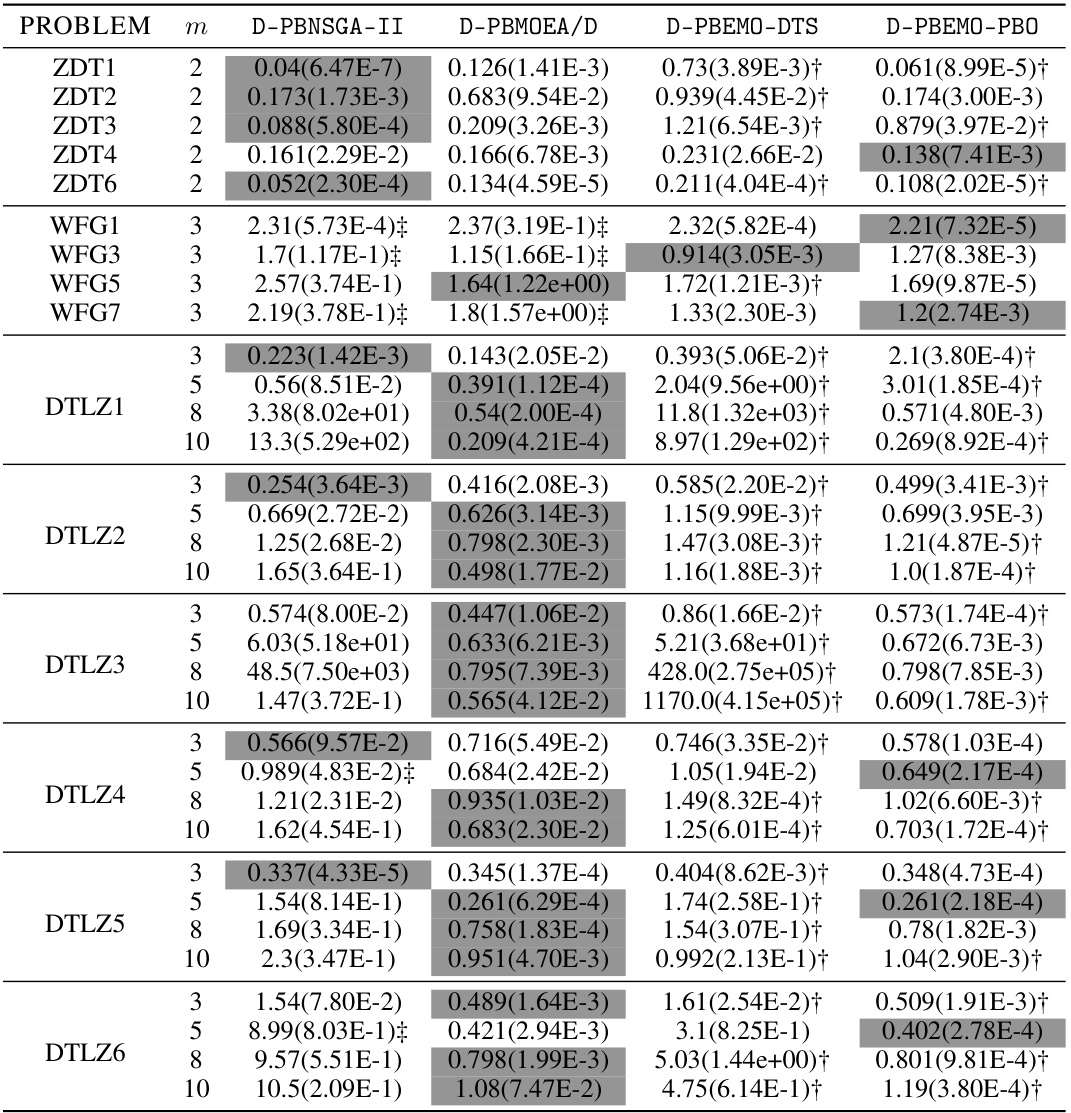
🔼 This table presents the mean and standard deviation of the approximation accuracy (ε*(S)) for different multi-objective optimization algorithms, including the proposed D-PBEMO (D-PBNSGA-II and D-PBMOEA/D) and three state-of-the-art PBEMO algorithms (I-MOEAD-PLVF, I-NSGA2/LTR, IEMO/D). The results are shown for a range of test problems (ZDT1-ZDT6, WFG1-WFG7, DTLZ1-DTLZ6). The statistical significance of the results is indicated using the Wilcoxon rank sum test (p=0.05) to compare against peer algorithms. A symbol (‡) notes where the peer algorithm outperforms the proposed method.
read the caption
Table A5: The mean(std) of €* (S) obtained by our proposed D-PBEMO algorithm instances against the peer algorithms.

🔼 This table presents the mean and standard deviation of the * (S) metric, which measures the approximation accuracy to the preferred solution, for different multi-objective optimization algorithms. The algorithms compared are the proposed D-PBNSGA-II and D-PBMOEA/D, as well as three state-of-the-art PBEMO algorithms: I-MOEAD-PLVF, I-NSGA-II/LTR, and IEMO/D. The results are shown for various benchmark problems (ZDT, DTLZ, WFG) with different numbers of objectives (m). Symbols (†, ‡) denote statistically significant differences based on the Wilcoxon’s rank-sum test. A dagger (†) indicates that the proposed method outperforms others, while a double dagger (‡) indicates a peer algorithm outperforms the proposed one.
read the caption
Table A5: The mean(std) of * (S) obtained by our proposed D-PBEMO algorithm instances against the peer algorithms.

🔼 This table presents the results of the Scott-Knott test comparing the performance of the proposed D-PBEMO algorithm (D-PBNSGA-II and D-PBMOEA/D) against three state-of-the-art PBEMO algorithms (I-MOEAD-PLVF, I-NSGA2/LTR, IEMO/D) across various benchmark problems. The mean and standard deviation of the approximation accuracy (e*(S)) metric are shown for each algorithm and problem instance. The table highlights instances where the Wilcoxon rank-sum test indicates a statistically significant difference in performance between the proposed D-PBEMO algorithm and other algorithms.
read the caption
Table A5: The mean(std) of e* (S) obtained by our proposed D-PBEMO algorithm instances against the peer algorithms.

🔼 This table presents the results of a statistical comparison of the average accuracy metric *(S), obtained using the D-PBMOEA/D algorithm with different numbers of subsets (K=2, 5, 10). The comparison shows the statistical significance of differences in performance between using different numbers of subsets, as determined by the Wilcoxon rank sum test at a significance level of 0.05. The results are relevant to assessing the influence of the hyperparameter K on the performance of the D-PBMOEA/D algorithm.
read the caption
Table A11: The statistical comparison results of *(S) obtained by D-PBMOEA/D with different number of subsets K (m = 2).

🔼 This table presents the results of a statistical comparison of the approximation accuracy (e*(S)) obtained using the D-PBMOEA/D algorithm with different numbers of subsets (K=2, 5, 10) for a set of bi-objective optimization problems. The results are used to assess the impact of the number of subsets on the algorithm’s performance and to determine if there’s a statistically significant difference in the approximation accuracy achieved with different subset numbers.
read the caption
Table A11: The statistical comparison results of e* (S) obtained by D-PBMOEA/D with different number of subsets K (m = 2).

🔼 This table presents the comparison results between the proposed D-PBEMO algorithm and three other state-of-the-art PBEMO algorithms (I-MOEAD-PLVF, I-NSGA2/LTR, IEMO/D) in terms of the mean and standard deviation of the approximation accuracy *(S). The results are shown for 33 synthetic benchmark problems and two real-world applications (RNA Inverse Design and Protein Structure Prediction), categorized by the number of objectives (m). The symbol ‘†’ indicates that the D-PBEMO algorithm significantly outperforms other peer algorithms according to the Wilcoxon rank sum test at a 0.05 significance level, and ‘‡’ indicates the opposite.
read the caption
Table A5: The mean(std) of * (S) obtained by our proposed D-PBEMO algorithm instances against the peer algorithms.
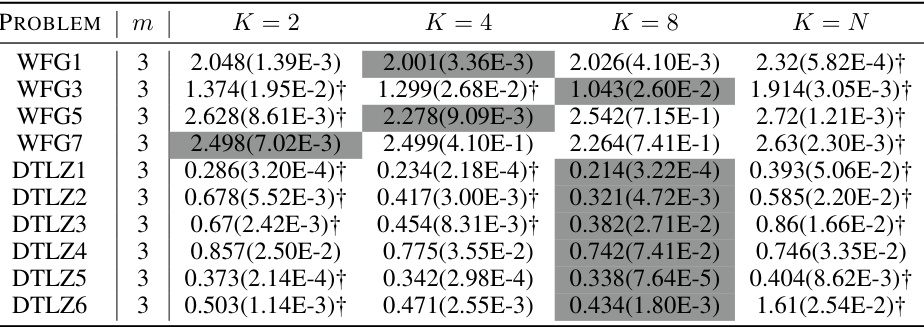
🔼 This table presents the mean and standard deviation of the approximation accuracy (ε*) metric for 33 benchmark problems. The results are compared for five algorithms: D-PBNSGA-II, D-PBMOEA/D, I-MOEA/D-PLVF, I-NSGA-II/LTR, and IEMO/D. The table highlights which algorithm performs significantly better according to the Wilcoxon rank-sum test at a 0.05 significance level, showing the relative performance of the proposed D-PBEMO algorithms against existing methods.
read the caption
Table A5: The mean(std) of €*(S) obtained by our proposed D-PBEMO algorithm instances against the peer algorithms.

🔼 This table presents the statistical comparison of the approximation accuracy (e*(S)) using the D-PBMOEA/D algorithm with different numbers of subsets (K). The results are categorized for different multi-objective optimization problems (DTLZ1-DTLZ6) with 5 objectives (m=5). The table highlights whether the D-PBMOEA/D algorithm with a specific K setting significantly outperforms other K settings according to the Wilcoxon’s rank-sum test at a 0.05 significance level. The values represent mean(standard deviation).
read the caption
Table A15: The statistical comparison results of e*(S) obtained by D-PBMOEA/D results with different K (m = 5).

🔼 This table presents the results of statistical comparisons (Wilcoxon rank-sum test) performed on the metric for the D-PBMOEA/D algorithm across different numbers of subsets (K) in five-objective (m=5) problems. It shows the mean and standard deviation of for each algorithm setting. The ‘+’ symbol indicates that the proposed method with the specific K value significantly outperforms other K values at the 0.05 significance level.
read the caption
Table A15: The statistical comparison results of obtained by D-PBMOEA/D results with different K (m = 5).

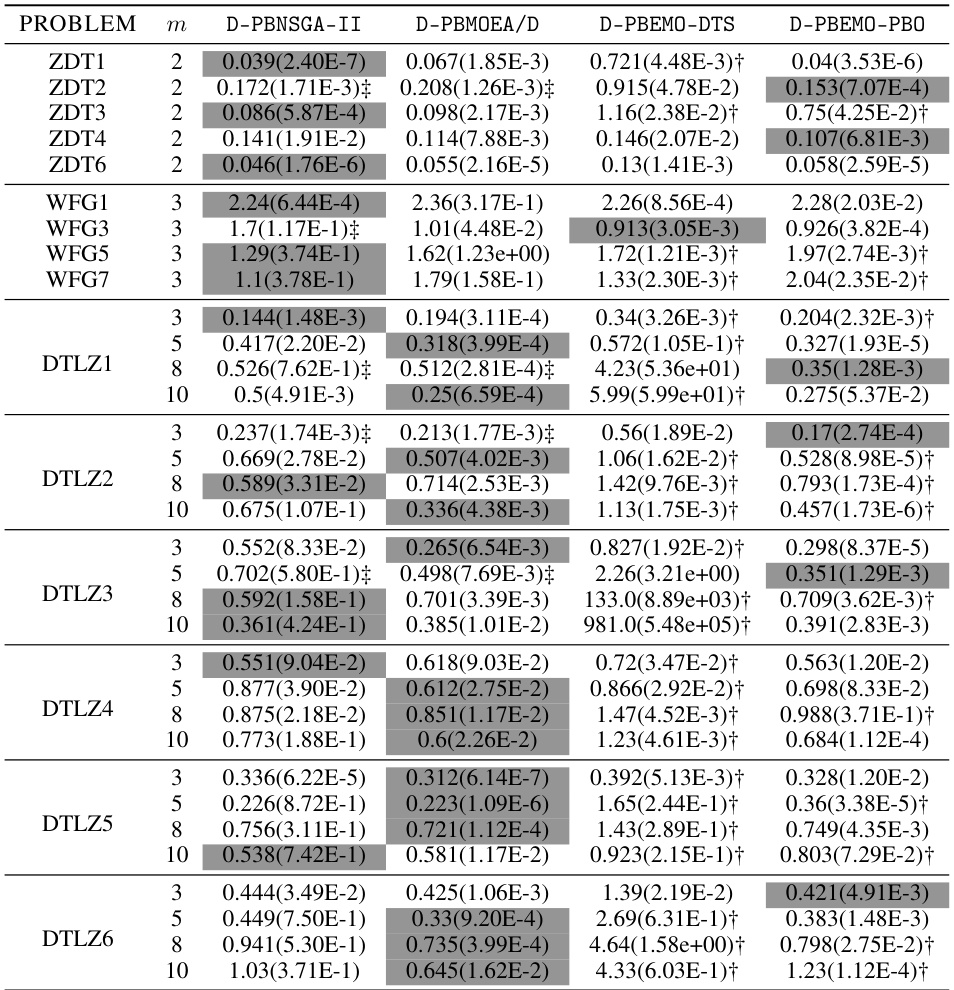
🔼 This table presents the mean and standard deviation of the approximation accuracy (e*(S)) achieved by the proposed D-PBEMO algorithm and three comparison algorithms (D-PBEMO-DTS, D-PBEMO-PBO, and three state-of-the-art PBEMO algorithms) across various benchmark problems with different numbers of objectives. The distillation experiments aim to assess how well the different algorithms perform in finding solutions of interest after preference information is incorporated. The results show the performance of the proposed methods and its sensitivity to the algorithm used.
read the caption
Table A7: The mean(std) of e*(S) obtained by our proposed D-PBEMO algorithm in distillation experiments.

🔼 This table presents the mean and standard deviation of the approximation accuracy (€* (S)) achieved by the proposed D-PBEMO algorithm (D-PBNSGA-II and D-PBMOEA/D) and three alternative approaches (D-PBEMO-DTS and D-PBEMO-PBO) across various test instances (ZDT, DTLZ, and WFG). The results are compared to show the effectiveness of the proposed clustering-based stochastic dueling bandits algorithm within the consultation module. Statistical significance is indicated using the Wilcoxon rank-sum test at a 0.05 significance level.
read the caption
Table A7: The mean(std) of €* (S) obtained by our proposed D-PBEMO algorithm in distillation experiments.

🔼 This table presents the statistical comparison of the approximation accuracy (e*(S)) obtained by the D-PBMOEA/D algorithm using different numbers of subsets (K) for multi-objective problems with 8 objectives (m=8). The results are statistically analyzed using the Wilcoxon rank-sum test at a significance level of 0.05. The table compares the performance of the D-PBMOEA/D algorithm with different K values, highlighting whether the proposed method significantly outperforms other settings.
read the caption
Table A17: The statistical comparison results of e* (S) obtained by D-PBMOEA/D with different K (m = 8).

🔼 This table presents the results of a statistical comparison of the approximation accuracy (e*(S)) using the D-PBMOEA/D algorithm with different numbers of subsets (K) for multi-objective problems with 10 objectives (m=10). The comparison assesses whether using different values of K leads to statistically significant differences in performance. The results are likely used to determine an optimal or near-optimal value of K for the algorithm, balancing efficiency and accuracy.
read the caption
Table A19: The statistical comparison results of e*(S) obtained by D-PBMOEA/D with different K (m = 10).

🔼 This table presents the mean and standard deviation of the approximation accuracy (ϵ*) achieved by the proposed D-PBEMO algorithm (D-PBNSGA-II and D-PBMOEA/D) and three other state-of-the-art PBEMO algorithms (I-MOEAD-PLVF, I-NSGA2/LTR, IEMO/D) across various benchmark problems. The results are broken down by problem (ZDT, DTLZ, WFG), number of objectives (m), and algorithm. A † indicates that D-PBEMO significantly outperforms other algorithms according to the Wilcoxon signed-rank test, while a ‡ denotes cases where a peer algorithm performs better. This provides a quantitative comparison of the performance of the proposed method relative to existing methods.
read the caption
Table A5: The mean(std) of ϵ*(S) obtained by our proposed D-PBEMO algorithm instances against the peer algorithms.

🔼 This table presents the mean and standard deviation of the approximation accuracy (ε*(S)) for different algorithms on inverse RNA design problems. The results are based on the reference point 1, where the target is to find the most similar sequence. The table compares the performance of the proposed D-PBEMO method against several state-of-the-art PBEMO algorithms across 10 different RNA sequences, each represented by a different row. Lower values indicate better performance.
read the caption
Table A22: The mean(std) of * (S) comparing our proposed method with peer algorithms on inverse RNA design problems given reference point 1

🔼 This table presents the mean and standard deviation of the approximation accuracy (ϵ* (S)) for 10 inverse RNA design problems. The results are compared for five different algorithms: D-PBNSGA-II, D-PBMOEA/D, I-MOEA/D-PLVF, I-NSGA2/LTR, and IEMO/D. The reference point used is 1, indicating that the focus is on finding solutions with high similarity to the target structure, even at the cost of stability. The values show the average distance to the optimal solution, with lower values indicating better performance.
read the caption
Table A22: The mean(std) of ϵ* (S) comparing our proposed method with peer algorithms on inverse RNA design problems given reference point 1
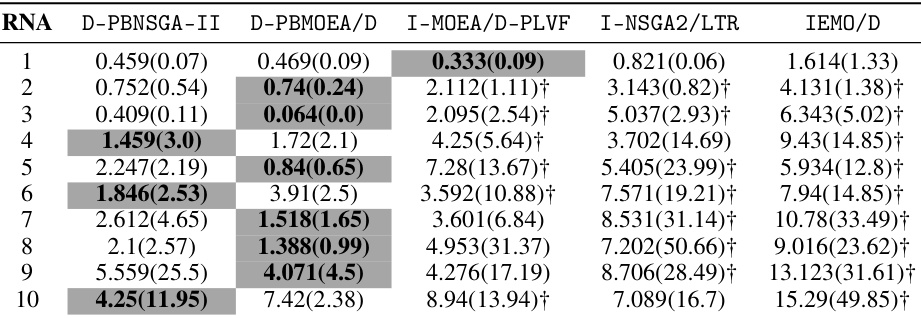
🔼 This table lists the settings used in the RNA inverse design experiments. For each of the ten RNA sequences, the table shows the Eterna ID, the target secondary structure, the reference points used for the two consultation sessions, and a sample solution from the benchmark. Reference point 1 is focused on similarity to the target structure (f2 = 0), while reference point 2 is aimed at finding solutions that balance stability and similarity (f2 ∈ (0,1)).
read the caption
Table A21: RNA experiment settings.
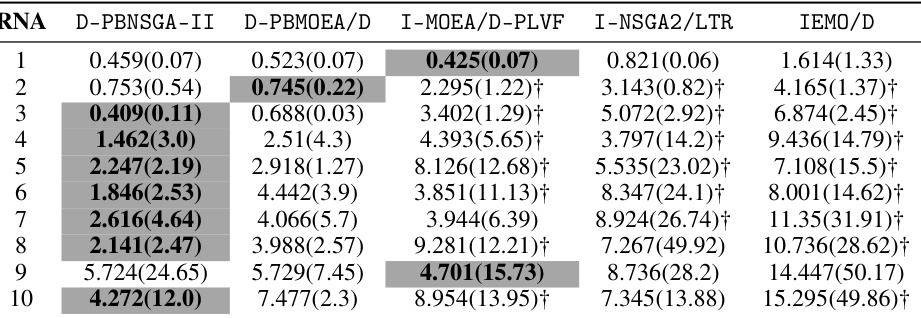
🔼 This table presents the mean and standard deviation of the approximation accuracy (€* (S)) metric for different algorithms on 10 inverse RNA design problems. The reference point used is (-6.3,0), (-9.1,0), (-4,0), (-12,0), (-9,0), (-24,0), (-13,0), (-15,0), (-26.7,0) for each of the 10 RNA sequences respectively. Lower values of €* (S) indicate better performance, showing how close the algorithm’s solutions are to the preferred solution.
read the caption
Table A22: The mean(std) of €* (S) comparing our proposed method with peer algorithms on inverse RNA design problems given reference point 1

🔼 This table presents the mean and standard deviation of the Root Mean Square Deviation (RMSD) for five different algorithms (D-PBNSGA-II, D-PBMOEA/D, I-MOEA/D-PLVF, I-NSGA2-LTR, and IEMO/D) applied to five protein structure prediction (PSP) problems (1K36, 1ZDD, 2M7T, 3P7K, and 3V1A). RMSD is a measure of the difference between predicted and native protein structures. Lower RMSD values indicate better prediction accuracy. The table helps to evaluate the performance of the proposed D-PBEMO algorithms against existing state-of-the-art preference-based evolutionary multi-objective optimization (PBEMO) algorithms in the context of PSP.
read the caption
Table A27: The mean(std) of RMSD comparing our propsoed emthod with peer algorithms on PSP problems.

🔼 This table presents the mean and standard deviation of the Root Mean Square Deviation (RMSD) values for five different algorithms (D-PBNSGA-II, D-PBMOEA/D, I-MOEA/D-PLVF, I-NSGA2-LTR, and IEMO/D) on five different protein structure prediction (PSP) problems. RMSD is a measure of the similarity between the predicted protein structure and the native (true) structure. Lower RMSD values indicate better prediction accuracy. The table allows for comparison of the performance of the proposed D-PBEMO algorithms against existing state-of-the-art PBEMO approaches in the context of PSP problems.
read the caption
Table A27: The mean(std) of RMSD comparing our propsoed emthod with peer algorithms on PSP problems.
Full paper#


