↗ OpenReview ↗ NeurIPS Homepage ↗ Chat
TL;DR#
Graph Neural Networks (GNNs) struggle with the memory and computational costs of processing large, dense graphs. Current methods often employ approximations or subsampling, compromising accuracy or requiring specialized hardware. This limitation significantly restricts the applicability of GNNs to many real-world problems, such as analyzing social networks or spatiotemporal data.
This work introduces Intersecting Community Graphs (ICGs) as a new approach to address this issue. ICGs represent graphs as a combination of intersecting cliques. The key innovation is a new constructive version of the Weak Graph Regularity Lemma, which efficiently constructs ICG approximations. Using ICGs, the proposed algorithm operates directly on the ICG, resulting in linear time and memory complexity with respect to the number of nodes. Experiments demonstrate the efficacy of this approach on node classification and spatiotemporal data processing tasks, surpassing the performance of existing methods.
Key Takeaways#
Why does it matter?#
This paper is crucial for researchers working with large, dense graphs. It offers a novel approach to overcome memory limitations in graph neural networks, opening avenues for applying GNNs to previously intractable datasets and accelerating research in various domains that rely on graph-based data analysis. The algorithmic efficiency and rigorous theoretical framework presented have significant implications for the field.
Visual Insights#

This figure shows a visual comparison between the adjacency matrix of a simple graph and its approximation using an Intersecting Community Graph (ICG) with 5 communities. The top panel displays the adjacency matrix of the original graph, highlighting its inherent structure with dense and sparse regions. The bottom panel illustrates the ICG approximation, capturing the overall statistics of edge densities and community structure. The ICG significantly simplifies the original graph by representing it as a combination of overlapping communities (cliques), resulting in a lower-rank representation that requires less memory and computation to process.

This table presents the results of experiments conducted on dense temporal graphs using various models, including the proposed ICG-NN and ICGu-NN models. The performance of these models is compared against other state-of-the-art models such as DCRNN, GraphWaveNet, and AGCRN. The table highlights the MAE (Mean Absolute Error) achieved by each model on two different datasets, METR-LA and PEMS-BAY. The ‘relative Frob.’ column likely indicates a measure of the approximation error of the graph representation used by the model.
In-depth insights#
ICG Graph Approx#
The heading ‘ICG Graph Approx’ suggests a method for approximating graphs using Intersecting Community Graphs (ICGs). This technique likely involves decomposing a large, complex graph into smaller, overlapping communities (cliques). The core idea is to reduce computational complexity by working with these smaller ICGs instead of the original graph, while maintaining sufficient accuracy. Approximation guarantees are crucial; the method likely includes a theorem proving the quality of the approximation—perhaps bounding the error between the original graph and its ICG representation using a suitable metric (e.g., cut metric). The process would involve an algorithm to efficiently construct the ICG. The method’s success depends on the trade-off between approximation accuracy and the reduction in computational cost. The efficiency gains are likely significant for very large, dense graphs, where traditional methods struggle due to high memory and time complexity. This approach offers a novel pipeline for large-scale graph processing tasks, making it a significant contribution to graph machine learning.
ICG-NN Pipeline#
The ICG-NN pipeline represents a novel approach to graph neural network processing, particularly well-suited for large, dense graphs. It begins with an offline pre-processing step that approximates the input graph using an Intersecting Community Graph (ICG). This ICG efficiently captures the graph’s essential structure using a combination of intersecting cliques, reducing memory complexity from linear in edges (O(E)) to linear in nodes (O(N)). This approximation is crucial, as it overcomes the limitations of standard message-passing networks which struggle with the memory demands of massive, non-sparse graphs. Following the ICG construction, the actual ICG-NN model is trained. This model directly operates on the ICG representation, utilizing community-level and node-level operations, enabling efficient processing in linear time with respect to the number of nodes. By combining these two steps—efficient graph approximation and subsequent linear-time model training—the ICG-NN pipeline significantly improves the scalability and efficiency of graph neural network learning for large graphs, making it suitable for diverse applications.
Subgraph SGD#
The concept of “Subgraph SGD” in the context of large-graph processing suggests a strategy to address computational limitations by applying stochastic gradient descent (SGD) not to the entire graph, but to randomly sampled subgraphs. This approach is particularly relevant when the full graph’s size exceeds available memory resources. The key advantage is a reduction in memory footprint, allowing for efficient training even on massive graphs. However, this method introduces a trade-off: while memory usage decreases, the number of iterations required to converge might increase due to the stochastic nature of the sampled data. The effectiveness hinges on the sampling strategy ensuring that the selected subgraphs are sufficiently representative of the overall graph structure. A critical aspect is the theoretical guarantee of convergence, which should be established to demonstrate the algorithm’s reliability and efficiency. The paper likely provides empirical evidence supporting the practical effectiveness of this approach, potentially demonstrating that the gain in memory efficiency outweighs the increased computational cost associated with more iterations.
Runtime Analysis#
A runtime analysis section in a research paper would typically involve a detailed comparison of the execution times of different algorithms or approaches. For example, a paper on graph neural networks might compare the runtime of a novel method against existing state-of-the-art techniques. This would likely involve benchmarking on various datasets of different sizes and densities to assess scalability. Key metrics often reported include overall runtime, memory usage, and potentially the time complexity of individual operations or algorithm steps. The analysis should go beyond simply reporting numbers, offering an explanation of the observed differences and relating them to the design choices of the methods. Visualizations like graphs or tables can enhance clarity. A strong runtime analysis should provide compelling evidence supporting the efficiency claims of the proposed method and address any potential performance bottlenecks.
Future ICG Work#
Future research involving Intersecting Community Graphs (ICGs) could explore several promising avenues. Extending ICGs to directed graphs is crucial, as many real-world networks exhibit directionality. This would involve developing new theoretical tools and algorithms for constructing and utilizing ICG representations of directed graphs. Another key area is improving the scalability of ICG construction for extremely large graphs, possibly by leveraging distributed computing techniques or developing more efficient approximation algorithms. Investigating the expressiveness of ICGs compared to other graph representations and exploring their theoretical limits in capturing different types of graph structure will further advance our understanding of ICGs’ capabilities and limitations. Finally, researching novel applications of ICGs beyond node classification and spatio-temporal analysis is important to demonstrate the full potential of ICGs in various domains, including complex network analysis and biological systems modeling.
More visual insights#
More on figures

This figure empirically validates the theoretical advantage of using ICGs over standard GNNs (GCN in this case) by comparing their runtimes. The plot shows a strong square root relationship between the runtime of ICGu-NN and GCN, confirming that ICGu-NN’s runtime complexity is indeed O(N) while GCN’s is O(E), where N is the number of nodes and E is the number of edges. The square root relationship arises from the fact that the denser the graph, the closer E is to N², making the difference between O(N) and O(E) less apparent in extremely dense graphs, but still holding true.

This figure compares the performance of ICG-NN and a Multilayer Perceptron (MLP) on the tolokers dataset when different percentages of nodes are removed from the graph. The y-axis shows the ROC AUC score, indicating the model’s performance in classifying nodes. The x-axis displays the ratio of nodes removed from the graph. The shaded area around the ICG-NN line represents the standard deviation across multiple trials. The plot shows a relatively small degradation in performance for ICG-NN as more nodes are removed, suggesting robustness to node removal.

This figure shows the performance of two models, ICGu-NN and ICG-NN, on the tolokers and squirrel datasets for node classification. The x-axis represents the number of communities used in the model, and the y-axis represents the ROC AUC (for tolokers) and accuracy (for squirrel). The plot demonstrates how the model performance varies with the number of communities used. Error bars are included to show the variability of the results.

This figure shows a visual comparison of a simple graph’s adjacency matrix and its approximation using an Intersecting Community Graph (ICG). The top panel displays the adjacency matrix of a simple graph, illustrating the presence of dense and sparse regions. The bottom panel shows the ICG approximation, demonstrating how intersecting communities (cliques) can represent the graph’s underlying structure effectively. The approximation captures the edge density statistics while simplifying the graph’s fine-grained granularity.

This figure shows the empirical runtime comparison between the ICG approximation process and GCN forward pass on both dense and sparse graphs. It demonstrates a strong linear relationship between the runtimes for both types of graphs. This highlights the computational advantage of using ICGs over standard GCN methods.
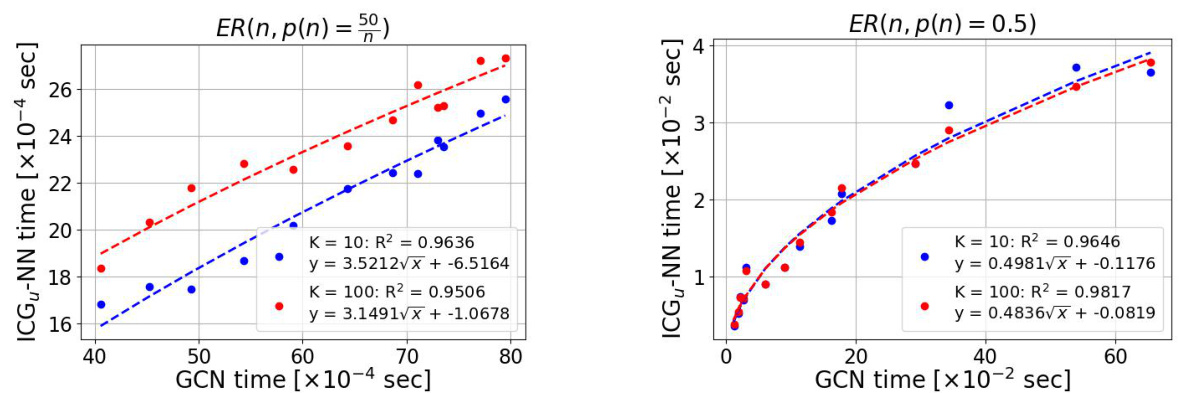
This figure empirically validates the theoretical advantage of ICGu-NN over GCN by comparing their runtimes on Erdős-Rényi graphs. The plot shows a strong square-root relationship between the runtime of ICGu-NN and that of GCN, aligning with the theoretical complexities O(N) and O(E), respectively. The result highlights that ICGu-NN is more efficient for large graphs, demonstrating a clear advantage of using ICGs for graph learning.

This figure shows the memory usage comparison between the proposed ICG approximation method and the standard GCN method. The x-axis represents the memory used by GCN, and the y-axis represents the memory used by the ICG approximation for K=10 and K=100. The figure demonstrates a linear relationship between the memory used by both methods, highlighting the memory efficiency of the ICG approach, especially for larger values of K.
More on tables

This table presents the results of node classification experiments on three large, non-sparse graph datasets: tolokers, squirrel, and twitch-gamers. The table shows the mean ROC AUC (for tolokers) or accuracy and standard deviation for several graph neural network models, including various baselines and the proposed ICG-NN and ICGu-NN methods. The ‘relative Frob.’ column indicates the relative Frobenius error of the ICG approximation for each dataset. The results demonstrate the competitive performance of the ICG-NN models, particularly in the tolokers and twitch-gamers datasets.
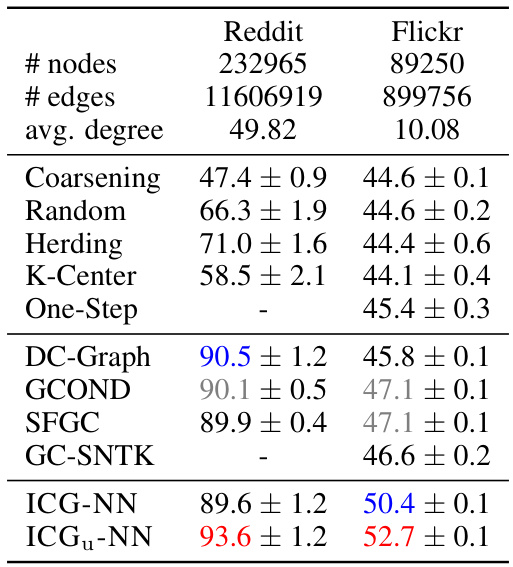
This table compares the performance of ICG-NN and ICGu-NN against various graph coarsening methods on two large graph datasets, Reddit and Flickr. The table shows the accuracy of node classification for each method, highlighting the superior performance of the ICG-NN and ICGu-NN models.

This table presents the results of node classification experiments on the Flickr dataset using 1% node sampling. It compares the accuracy of various methods, including ICG-NN and ICGu-NN, against several graph coarsening methods (Coarsening, Random, Herding, K-Center, One-Step) and graph condensation methods (DC-Graph, GCOND, SFGC, GC-SNTK). The top three performing models are highlighted.

The table compares the training time until convergence for different initialization methods (random and eigenvector) on three large graph datasets: tolokers, squirrel, and twitch-gamers. The results show the average time and standard deviation for each dataset and initialization method, highlighting the potential efficiency gains from using eigenvector initialization. The average degree of each dataset is also provided as context for the comparison.

This table compares the training time until convergence (in seconds) for GCN and ICGu-NN on three large graph datasets: tolokers, squirrel, and twitch-gamers. It highlights the significant speedup achieved by ICGu-NN compared to GCN, demonstrating the efficiency gains of the proposed method.

This table presents the statistics of three real-world node classification datasets used in the paper’s experiments. For each dataset, it shows the number of nodes, the number of edges, the average node degree, the number of node features, the number of classes, and the evaluation metrics used (AUC-ROC for tolokers and ACC for squirrel and twitch-gamers). The datasets vary significantly in size and characteristics.
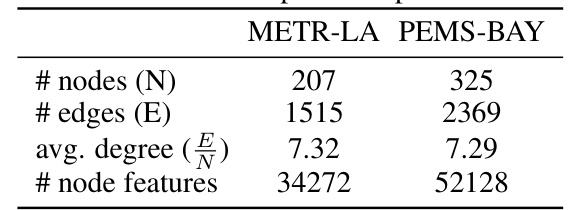
This table presents the number of nodes, edges, average node degree, and number of node features for the METR-LA and PEMS-BAY datasets, which are used in the spatio-temporal experiments of the paper.
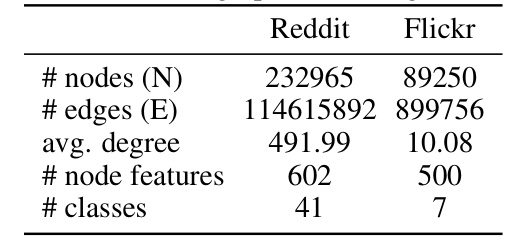
This table compares the performance of ICG-NN and ICGu-NN against various graph coarsening methods on two large graph datasets: Reddit and Flickr. The metrics used are accuracy and standard deviation. The table highlights the superior performance of the ICG-based methods compared to existing coarsening techniques.
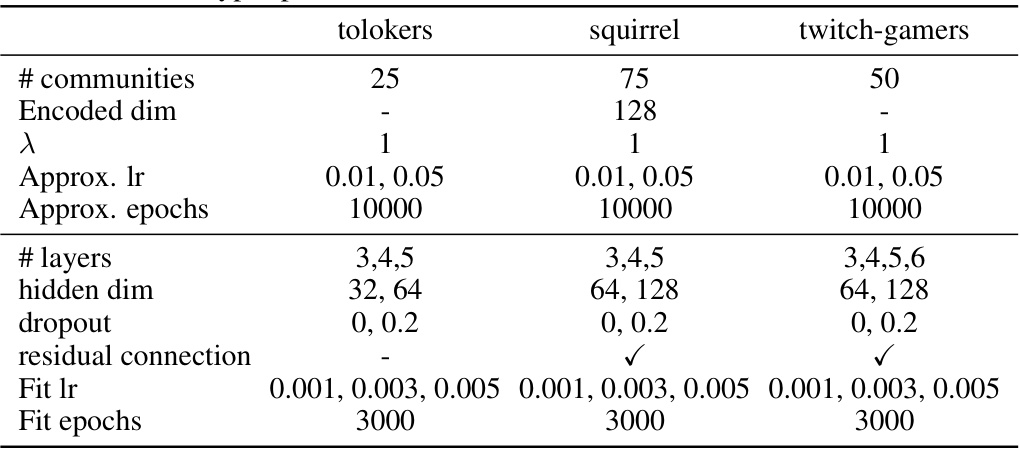
This table presents the results of node classification experiments conducted on three large, non-sparse graph datasets: tolokers, squirrel, and twitch-gamers. The table shows the number of nodes and edges in each dataset, the average node degree, and the relative Frobenius error for the ICG approximation. For each dataset, the performance of several node classification methods is reported, including MLP, GCN, GAT, H2GCN, GPR-GNN, LINKX, GloGNN, ICG-NN, and ICGu-NN. The top three performing models for each dataset are highlighted in color.
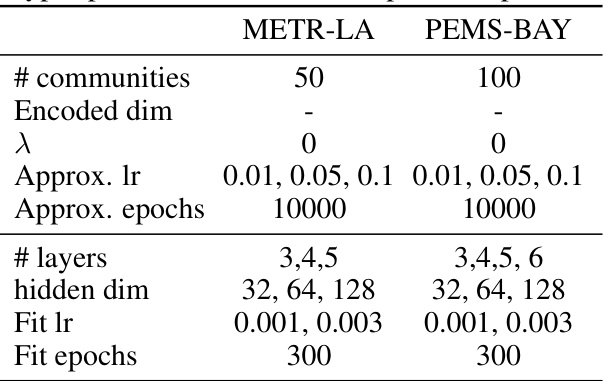
This table shows the hyperparameters used for the spatio-temporal benchmarks METR-LA and PEMS-BAY. The hyperparameters include the number of communities, encoded dimension, lambda (λ), approximation learning rate (Approx. lr), approximation epochs (Approx. epochs), number of layers, hidden dimension, fit learning rate (Fit lr), and fit epochs.
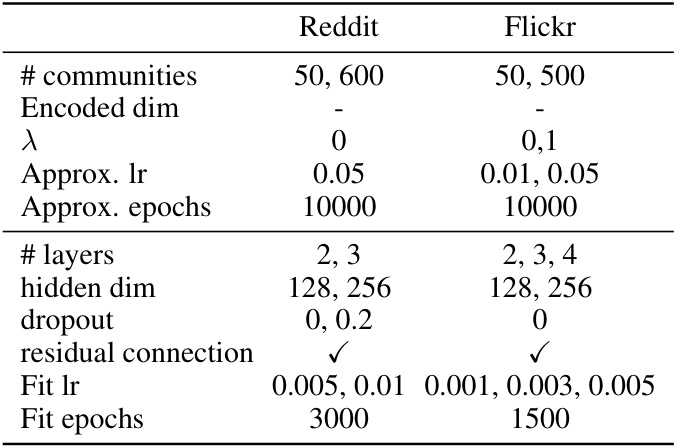
This table compares the performance of ICG-NN and ICGu-NN against various graph coarsening methods on the Reddit and Flickr datasets. It shows the number of nodes, edges, and average node degree for each dataset and lists the accuracy achieved by different methods.
Full paper#


