↗ OpenReview ↗ NeurIPS Homepage ↗ Chat
TL;DR#
Recommender systems heavily rely on Softmax Loss (SL) for training. However, SL suffers from two critical issues: a weak connection to standard ranking metrics and high sensitivity to noisy data. These limitations hinder the performance and robustness of recommendation models. The existing solutions to enhance SL have their limitations, and the relationships between SL and ranking metrics are not well established.
To tackle these issues, the authors propose a new family of loss functions, Pairwise Softmax Loss (PSL). PSL replaces the exponential function in SL with alternative activation functions, such as ReLU or Tanh. This seemingly small change yields substantial improvements. The authors demonstrate theoretically that PSL serves as a tighter surrogate for DCG, better balances data contributions, and acts like a specific BPR loss enhanced by DRO. Extensive experiments confirm PSL’s superiority over existing methods in various settings, especially with noisy data or distribution shifts.
Key Takeaways#
Why does it matter?#
This paper is crucial for researchers in recommender systems due to its novel approach to improving the Softmax Loss (SL). It provides a theoretically sound and empirically validated method (Pairwise Softmax Loss, or PSL) to address SL’s limitations regarding its relationship with ranking metrics and its sensitivity to noise. This opens avenues for developing more robust and accurate recommendation models.
Visual Insights#

Figure 1(a) compares the shape of different activation functions used in the proposed Pairwise Softmax Loss (PSL) and the original Softmax Loss (SL). It shows that PSL’s activation functions (tanh, atan, relu) provide a closer approximation to the Heaviside step function compared to the exponential function used in SL. Figure 1(b) contrasts the weight distribution in SL and PSL. It highlights how PSL’s various activation functions help to mitigate the excessive impact of negative instances with high prediction scores, a key limitation of SL.

This table presents a comparison of different recommendation loss functions’ performance under an independent and identically distributed (IID) setting. It shows Recall@20 and NDCG@20 scores for several models on four different datasets (Amazon-Book, Amazon-Electronics, Amazon-Movies, Gowalla). The table highlights PSL’s superior performance compared to other loss functions, especially SL (Softmax Loss), with statistically significant improvements in NDCG@20 indicated by asterisks.
In-depth insights#
Softmax Loss Issues#
The softmax loss function, while widely used in recommendation systems, suffers from several key limitations. Firstly, its connection to ranking metrics like NDCG is not sufficiently tight, particularly when dealing with large score differences. This leads to suboptimal performance in optimizing for actual ranking quality. Secondly, the softmax loss is highly sensitive to false negative instances, common in recommendation data where user non-interaction doesn’t necessarily imply disinterest. These false negatives disproportionately influence the training process, potentially degrading performance and causing instability. Thirdly, the exponential function inherent in softmax loss is problematic, amplifying the impact of outliers. Therefore, alternative loss functions that address these issues, such as those employing different activation functions or focusing on pairwise comparisons, are needed to improve model accuracy and robustness in real-world recommendation applications. In essence, the issues stem from the function’s inability to accurately reflect ranking objectives and its vulnerability to noise, highlighting the need for alternative approaches with improved properties.
Pairwise Loss PSL#
The proposed Pairwise Softmax Loss (PSL) offers a refined approach to recommendation system loss functions. Instead of relying solely on the exponential function of traditional softmax loss, PSL introduces a family of losses using alternative activation functions, which leads to several key advantages. Firstly, PSL provides a tighter surrogate for ranking metrics like DCG, better aligning the optimization with the ultimate goal of accurate ranking. Secondly, PSL offers greater control over weight distribution during training, reducing sensitivity to noise, particularly false negatives, a common issue in recommendation data. Finally, the analysis reveals that PSL is theoretically equivalent to performing Distributionally Robust Optimization (DRO) over the BPR loss, offering enhanced robustness and generalization capabilities. This means PSL is not only better at ranking but also more resilient to shifts in data distribution, a significant advantage in real-world recommender systems.
Theoretical Links#
A dedicated ‘Theoretical Links’ section in a research paper would deeply explore the established connections between the proposed method and existing theories or frameworks. It would likely demonstrate how the core ideas are grounded in prior work, providing a solid foundation for the approach. Mathematical proofs or rigorous derivations would support the claims made. The section should delve into the assumptions made, their implications, and explore the boundaries of applicability. By highlighting these theoretical underpinnings, the paper strengthens its credibility and positions itself within the broader research landscape. For instance, a strong emphasis on connecting the model to relevant metrics such as NDCG or MRR, especially through mathematical analysis, would solidify the paper’s claims regarding performance improvement. Furthermore, an examination of how the methodology relates to established learning paradigms like contrastive learning or DRO would be crucial. A well-developed ‘Theoretical Links’ section would provide the reader with a deep understanding of the approach’s theoretical basis and contribute to its broader impact and long-term value within the research community.
Robustness Analysis#
A robust recommendation system should reliably perform under various conditions. A robustness analysis would investigate how the system’s performance changes when faced with noisy data, outliers, concept drift, or adversarial attacks. For example, the analysis could measure the system’s accuracy, ranking quality, or efficiency when a specific percentage of ratings are incorrect, or when some users provide unusually high or low scores. The study would also explore how different loss functions or model architectures contribute to robustness. False negative instances present a significant challenge for many recommendation systems, and the robustness analysis should detail how the system mitigates the impact of such errors on prediction accuracy. The effects of data sparsity and imbalanced datasets should also be assessed. Ultimately, the robustness analysis aims to provide a comprehensive understanding of the system’s capabilities and limitations in real-world scenarios, providing insight for developers to design and build systems that are more reliable and resilient.
Future Research#
The paper’s conclusion mentions the inefficiency of softmax loss and its variants, requiring substantial negative sampling. Future research could explore more efficient alternatives, perhaps by leveraging techniques like negative sampling with importance weights or exploring entirely new loss functions designed for ranking tasks with reduced computational complexity. Investigating the impact of different activation functions beyond those tested (ReLU, Tanh, Atan) within the PSL framework, especially those with potentially better properties for approximating the Heaviside step function in DCG, warrants further study. Additionally, a deeper theoretical investigation into the robustness properties of PSL under various distribution shifts (e.g., user preference, item popularity) and noise scenarios is needed. Finally, applying PSL to other recommendation settings beyond collaborative filtering (e.g., knowledge-based recommendation, content-based recommendation) and evaluating its effectiveness in those contexts would provide valuable insights into its generalizability.
More visual insights#
More on figures

This figure compares different surrogate activation functions and their effect on the weight distribution in Softmax Loss (SL) and Pairwise Softmax Loss (PSL). The left panel shows the curves of three surrogate activations (tanh, atan, relu) against the Heaviside step function and the exponential function used in SL. The right panel shows how the weight distribution changes in SL and PSL with the different activation functions. It illustrates that PSL offers more balanced weight distributions, mitigating the potential for excessive influence of false negative instances.

This figure shows two subfigures. Subfigure (a) compares the shapes of different surrogate activation functions used in PSL against the exponential function used in SL and the Heaviside step function. Subfigure (b) shows how the weight distribution changes for SL and PSL with three different activation functions (Tanh, Atan, ReLU). It demonstrates PSL’s ability to control the weight distribution, mitigating the excessive impact of false negatives, compared to SL which is highly sensitive to false negatives.

This figure compares different surrogate activation functions and their effects on the weight distribution in Softmax Loss (SL) and Pairwise Softmax Loss (PSL). Panel (a) shows a graphical comparison of the exponential function used in SL versus three alternative activation functions (Tanh, Atan, ReLU) used in PSL. Panel (b) illustrates how the choice of activation function influences the weighting of different data points during training. It demonstrates how PSL mitigates the excessive influence of false negatives in recommendation systems by providing better control over the weight distribution compared to SL.

This figure shows a comparison of different activation functions used in the proposed Pairwise Softmax Loss (PSL) and the original Softmax Loss (SL). Subfigure (a) illustrates the curves of different activation functions (Tanh, Atan, ReLU) and their relationship with the Heaviside step function, which is crucial for ranking. Subfigure (b) compares the weight distribution of SL and PSL using three different surrogate activations. It demonstrates that PSL offers better control over weight distribution compared to SL, which is particularly sensitive to the impact of false negatives. This visualization supports the authors’ claim that PSL mitigates the excessive impact of false negatives while still approximating ranking metrics.

This figure shows a comparison of different surrogate activation functions and their effect on the weight distribution in the Softmax Loss (SL) and the proposed Pairwise Softmax Loss (PSL). The left panel (a) illustrates the shapes of the exponential function (used in SL), and three alternative functions (Tanh, Atan, ReLU) used in PSL. The right panel (b) visualizes the resulting weight distributions for each function, highlighting how PSL leads to more balanced weights compared to the skewed distribution of SL, making PSL more robust to noisy data. A temperature hyperparameter (τ) of 0.2 is used.

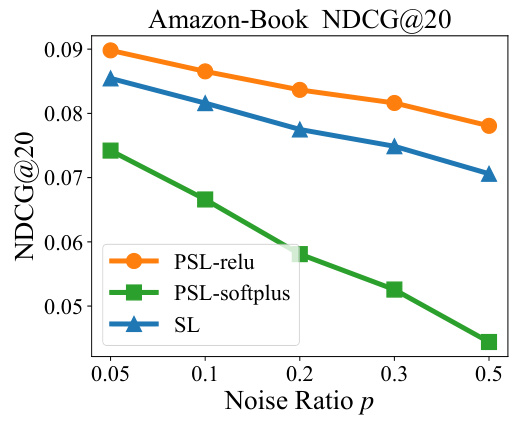
This figure shows the performance of PSL-softplus (a variant of PSL using the softplus activation function) compared to PSL-relu and SL under different noise ratios (p) on the Amazon-Book dataset. The plot demonstrates the impact of noise on Recall@20 for each model. It reveals that PSL-softplus performs worse than both PSL-relu and the original SL across all noise levels.

Figure 1(a) shows a comparison of different activation functions used in Softmax Loss (SL) and Pairwise Softmax Loss (PSL), including exponential, ReLU, arctangent, and hyperbolic tangent functions. The figure highlights how PSL with various activation functions approximates the Heaviside step function better than SL. Figure 1(b) demonstrates how PSL modifies the weight distribution of training instances in comparison to SL, mitigating the excessive influence of false negative instances. In particular, it shows that PSL with different activation functions (ReLU, arctangent, and hyperbolic tangent) better balances the data contributions during training than the exponential function used in SL.

This figure shows two subfigures. Subfigure (a) compares the shapes of different activation functions that are used in the PSL model and the SL model. These include exponential, ReLU, arctan and tanh functions. The exponential function is used in the SL model, while others are used in the PSL model. The y axis shows the values of these activation functions and the x axis shows the score difference between positive and negative items. Subfigure (b) shows the weight distributions of SL and PSL using three different activation functions: tanh, atan, and relu. This figure shows that PSL assigns weights more evenly to each pair than SL, which uses an exponential function that assigns weights unevenly.

The figure shows a comparison of different surrogate activation functions (a) and the weight distributions (b) of the Softmax Loss (SL) and Pairwise Softmax Loss (PSL) functions. The surrogate activation functions considered are ReLU, arctan, and tanh. The figure highlights that PSL, using alternative activation functions, better balances the weights assigned to training instances compared to SL, which is heavily influenced by the exponential function and thus sensitive to noise and outliers.

Figure 1(a) compares the shapes of various activation functions used in the paper, including the exponential function (used in Softmax Loss), and other functions explored as substitutes in the proposed Pairwise Softmax Loss. Figure 1(b) shows how the weight given to training instances varies as a function of the score difference between positive and negative instances (duij) for Softmax Loss (SL) and the three variations of Pairwise Softmax Loss (PSL). This illustrates how PSL mitigates the disproportionate influence of false negatives.

This figure consists of two subfigures. Subfigure (a) shows different surrogate activation functions used in the paper, such as Tanh, Atan, and Relu. These functions are compared against the Heaviside step function and the exponential function. Subfigure (b) shows the weight distributions of Softmax Loss (SL) and Pairwise Softmax Loss (PSL) with different activation functions against duij which is the score gap between positive-negative pairs. This visualization illustrates how PSL better balances the contributions of different instances compared to SL, especially in mitigating the influence of noisy instances.

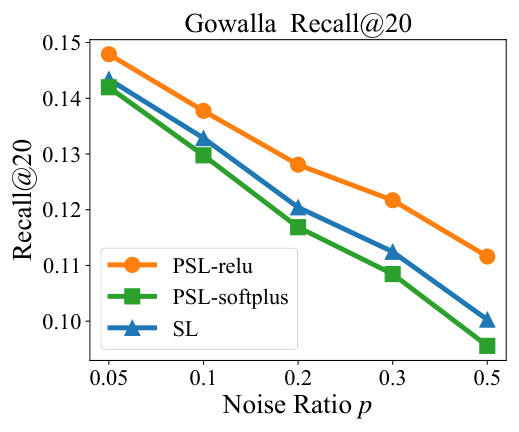
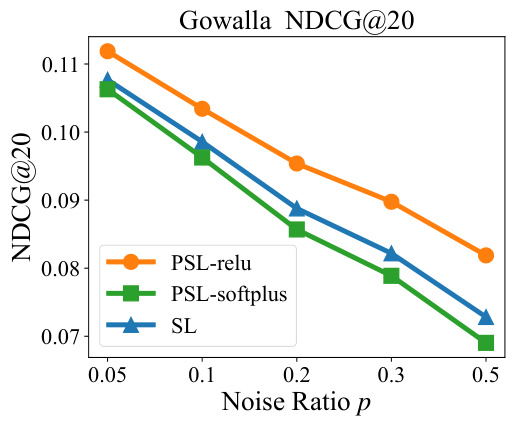
This figure shows the performance comparison of SL and PSL in terms of Recall@20 and NDCG@20 on Gowalla dataset with different false negative noise ratios (p). The shaded area represents the confidence interval for each loss function. The results demonstrate how the performance of each loss changes under varying levels of noise, allowing for a comparison of their noise resistance.
More on tables

This table presents a performance comparison of different recommendation loss functions under the IID (Identically and Independently Distributed) setting. It compares Recall@20 and NDCG@20 (metrics measuring the quality of top-20 recommendations) across several models and datasets. The best performance for each metric is highlighted in bold, and blue shading indicates where the proposed Pairwise Softmax Loss (PSL) outperforms Softmax Loss (SL). The ‘Imp.%’ column shows the percentage improvement of PSL over SL, while the ‘*’ symbol denotes statistically significant improvements (p-value < 0.05).

This table presents a performance comparison of different recommendation loss functions (BPR, LLPAUC, SL, AdvInfoNCE, BSL, and three variants of PSL) under the IID (Identically and Independently Distributed) setting. The metrics used are Recall@20 and NDCG@20. The best performing model for each metric is highlighted in bold, and a blue-colored background highlights cases where PSL outperforms SL. The ‘Imp%’ column indicates the percentage improvement in NDCG@20 achieved by PSL compared to SL, and a ‘*’ indicates statistically significant improvements (p<0.05).

This table presents a comparison of the performance of different recommendation loss functions under the IID (Identically and Independently Distributed) setting. The table shows Recall@20 and NDCG@20 scores for several models and loss functions, including the proposed PSL and existing baselines like BPR, LLPAUC, SL, AdvInfoNCE, and BSL. The best performing model for each metric is highlighted in bold, and blue shading indicates that PSL outperforms SL. The ‘Imp.%’ column shows the percentage improvement in NDCG@20 achieved by PSL compared to SL, with a * indicating statistically significant improvements.

This table presents a comparison of different recommendation loss functions under an independent and identically distributed (IID) setting, where the training and testing data follow the same distribution. The table evaluates the performance of various models (including baselines and the proposed PSL) using Recall@20 and NDCG@20 as metrics. The best-performing model for each metric is highlighted in bold, and the improvements achieved by PSL over the Softmax Loss (SL) baseline are shown with percentages and statistical significance markers.

This table presents the performance comparison of different recommendation loss functions (BPR, LLPAUC, SL, AdvInfoNCE, BSL, PSL variants) in terms of Recall@20 and NDCG@20 under the Out-of-Distribution (OOD) setting using the Matrix Factorization (MF) backbone. The OOD setting simulates real-world scenarios where the item popularity distribution shifts. The best performance for each metric and dataset is shown in bold, and the blue shaded cells highlight cases where the PSL variants outperform the standard Softmax Loss (SL). The ‘Imp.%’ column represents the percentage improvement in NDCG@20 achieved by the PSL variants compared to SL. A ‘*’ indicates that the improvement is statistically significant (p-value < 0.05).

This table presents a comparison of the performance of different recommendation loss functions (including the proposed PSL and several baselines) on four datasets under the IID (Identically and Independently Distributed) setting. It shows Recall@20 and NDCG@20 scores, highlighting the best-performing method for each dataset. The blue shading indicates cases where the new PSL method outperforms the standard Softmax Loss (SL). The Imp.% column shows the percentage improvement of PSL over SL, and asterisks denote statistically significant improvements.
Full paper#


