↗ OpenReview ↗ NeurIPS Homepage ↗ Chat
TL;DR#
Prior research on DNNs suggested that deeper layers compress representations, hindering out-of-distribution (OOD) generalization—a phenomenon called the “tunnel effect.” However, these studies largely used small, low-resolution datasets. This paper investigates how various factors (DNN architecture, training data, image resolution, augmentations) influence the tunnel effect and OOD generalization. It found that the previous conclusions were not universally applicable.
This work comprehensively studied the impact of these variables using extensive experiments. It found that training on high-resolution datasets with many classes greatly reduces representation compression and improves OOD generalization, contradicting previous tunnel effect findings. The study introduces revised metrics for evaluating tunnel effect strength and shows that augmentations can also reduce its impact. It also examines the tunnel effect in widely used pre-trained models, finding that the tunnel effect is not always present.
Key Takeaways#
Why does it matter?#
This paper is crucial for researchers working on transfer learning and out-of-distribution generalization because it challenges existing assumptions about deep neural network (DNN) representations. It highlights the limitations of previous studies that focused on small datasets, providing valuable insights for improving the transferability and robustness of DNN models. It also encourages future work on better understanding and mitigating the “tunnel effect”, suggesting exciting new avenues for research.
Visual Insights#

This figure shows the results of an experiment designed to test the tunnel effect hypothesis. Two identical VGGm-17 neural networks were trained on the same in-distribution (ID) dataset, but one with low-resolution (32x32) images and the other with high-resolution (224x224) images. Linear probes were trained on the embeddings from each layer of the networks to assess their performance on both ID and out-of-distribution (OOD) datasets. The graph shows that ID accuracy increased monotonically for both models, as expected. However, OOD accuracy showed a different trend. For the low-resolution model, OOD accuracy initially increased, but then sharply dropped after layer 9, indicating the presence of a long ’tunnel’. The high-resolution model showed a similar trend but with a much shorter tunnel (layers 13-16), demonstrating that higher resolution training data mitigates the tunnel effect and improves the model’s ability to generalize to OOD data. The shaded area represents the standard deviation across eight different OOD datasets, and the star symbols (✩) highlight where the tunnel effect begins.

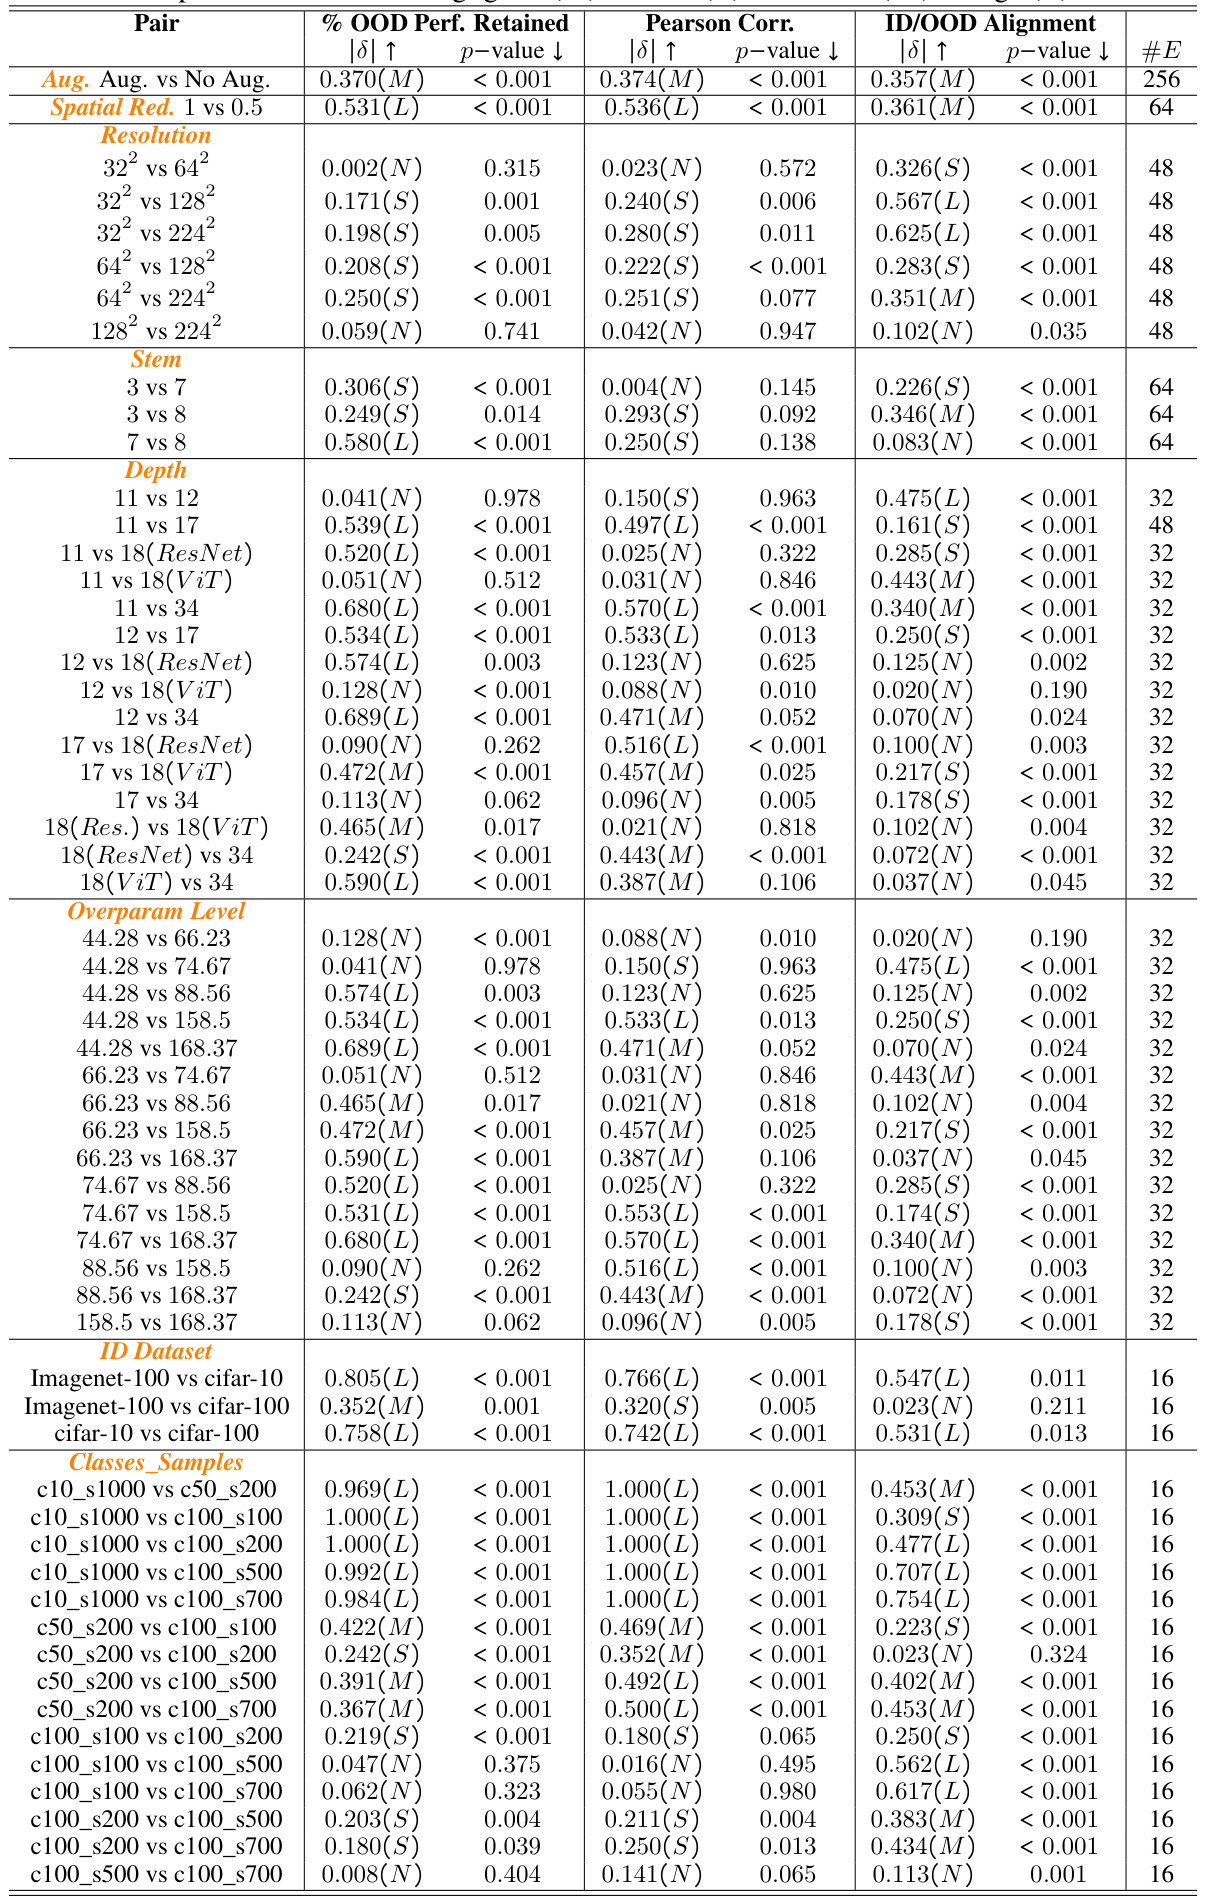
This table presents the results of pairwise statistical analyses comparing the effects of different image resolutions (32x32 vs 64x64, 32x32 vs 128x128, and 32x32 vs 224x24) on three key metrics related to the tunnel effect: % OOD Performance Retained, Pearson Correlation, and ID/OOD Alignment. For each comparison, the table shows the effect size (using Cliff’s Delta) and the p-value from a Wilcoxon signed-rank test, indicating the statistical significance of the observed differences in performance between the lower resolution (32x32) and the higher resolution models. The effect sizes are categorized as negligible (N), small (S), medium (M), or large (L), providing a concise summary of the impact of image resolution on the tunnel effect.
In-depth insights#
Tunnel Effect Limits#
The hypothetical ‘Tunnel Effect Limits’ in deep neural networks (DNNs) proposes that deeper layers, while improving in-distribution accuracy, hinder out-of-distribution (OOD) generalization by compressing representations. This compression, akin to a bottleneck or ’tunnel,’ restricts the model’s ability to adapt to unseen data. Research into these limits would explore factors influencing tunnel formation and strength, such as network architecture (depth, width, type), training data characteristics (resolution, diversity, size), and the use of augmentation techniques. Understanding these limits is vital for advancing DNNs’ robustness and reliability, as it directly impacts the models’ transferability and performance in real-world applications where OOD scenarios are common. Investigating mitigation strategies would be a key focus, potentially involving architectural changes or novel training methods to alleviate representation compression and encourage broader feature learning.
High-Res Improves#
The hypothesis that higher-resolution images improve out-of-distribution (OOD) generalization by mitigating the “tunnel effect” is explored. The tunnel effect, a phenomenon observed in deep neural networks, describes how deeper layers compress representations, hindering OOD generalization. Higher resolution images appear to create more hierarchical representations, thus reducing representation compression and improving transferability. This finding challenges previous work, which focused on lower-resolution datasets, showing that results may not generalize universally. The research strongly suggests that generalizing results from toy datasets is potentially misleading, and that focusing on larger, high-resolution datasets is necessary for robust conclusions and developing reliable algorithms for OOD generalization.
Data Diversity Key#
The concept of “Data Diversity Key” in the context of out-of-distribution (OOD) generalization in pretrained models emphasizes the critical role of diverse training data in improving a model’s ability to generalize to unseen data. Sufficient data diversity combats the “tunnel effect,” a phenomenon where deeper layers of a neural network excessively compress representations, hindering OOD performance. High-resolution images and a large number of classes within the training data promote hierarchical feature learning and reduce representation compression. This is because diverse data forces the model to learn more robust and transferable features rather than overfitting to specific characteristics of the training set. Therefore, a dataset with rich variability in terms of classes, resolutions and augmentations is key for building robust and generalizable AI models. The research highlights that relying on limited, simplistic datasets can lead to misleading conclusions, underscoring the importance of using comprehensive, real-world data when developing and evaluating pretrained models for broader applications.
Revised Hypothesis#
The revised hypothesis offers a crucial refinement to the original tunnel effect theory. It posits that the tunnel’s strength is not universally determined by architecture alone, but is heavily influenced by the diversity of the training data. The original hypothesis implied a more deterministic relationship, suggesting the tunnel’s presence was solely a function of network architecture and parameterization. The revision acknowledges that richer, higher-resolution datasets with numerous classes mitigate representation compression in deeper layers, thus reducing the tunnel’s negative impact on out-of-distribution generalization. This is a key insight, demonstrating that the original findings, obtained using smaller, simpler datasets, might not broadly generalize. The revised hypothesis highlights the importance of considering dataset characteristics when evaluating or applying deep learning models in various domains and transfer learning settings.
Future Research#
Future research should prioritize developing theoretical frameworks to explain the tunnel effect, moving beyond empirical observations. Investigating the tunnel effect in non-vision datasets and multi-modal settings is crucial, particularly given the lack of research in these areas. Careful study of biased datasets is also needed. While pre-trained self-supervised learning (SSL) models were studied, a more comprehensive analysis using a greater variety of SSL architectures and a rigorous paired experimental design is required. Further research is essential to determine if augmentations and high-resolution images are effective universally, or if these findings are limited to certain architectural choices or dataset characteristics. Finally, exploring novel techniques or regularizers to mitigate the tunnel effect, especially within continual learning, promises significant advancements in this field.
More visual insights#
More on figures

This figure displays the SHAP (SHapley Additive exPlanations) values for various factors influencing out-of-distribution (OOD) generalization. SHAP analysis is used to show the relative importance of each variable. The left chart shows the impact of each variable on the percentage of OOD performance retained. The right chart shows the impact of the variables on the ID/OOD alignment (a metric reflecting how well the model’s performance on in-distribution and out-of-distribution data align). Positive SHAP values for a variable suggest it improves OOD generalization or ID/OOD alignment, while negative values indicate it harms it. The magnitude of the SHAP value indicates the strength of the effect.

This figure shows how data augmentation affects the tunnel effect. Two plots are presented, one for a ResNet-34 model trained on 32x32 images, and another for a ViT-T+ model trained on 224x224 images. In both cases, the plots show normalized accuracy curves for in-distribution (ID) and out-of-distribution (OOD) data. The plots demonstrate that augmentation reduces the length of the ’tunnel’ (the region where OOD accuracy decreases rapidly) in both ResNet and ViT architectures. The shaded areas represent the 95% confidence intervals for the OOD curves. The star symbol indicates where the tunnel effect starts.

This figure shows t-SNE visualizations comparing the representations learned by a VGGm-11 model trained on low-resolution (32x32) and high-resolution (224x224) images from the ImageNet-100 dataset. The low-resolution model shows clear representation compression (clusters) in layers 8-10 (the ’tunnel’), consistent with the tunnel effect hypothesis and leading to impaired out-of-distribution (OOD) generalization. In contrast, the high-resolution model lacks this compression, suggesting that higher resolution training data mitigates the tunnel effect.

This figure shows the impact of data augmentation on the tunnel effect. Two examples are shown: one using a ResNet-34 model with 32x32 images and another using a ViT-T+ model with 224x224 images. Both models are trained on an in-distribution (ID) dataset, and the results show the normalized accuracy of linear probes on ID and out-of-distribution (OOD) datasets for each layer. The results clearly indicate that data augmentation significantly reduces the length of the tunnel and improves out-of-distribution generalization.

This figure shows the impact of data augmentation on the tunnel effect. Two examples are given: a ResNet-34 model trained on 32x32 images and a ViT-T+ model trained on 224x224 images. In both cases, the addition of augmentations significantly reduces the length of the tunnel, improving out-of-distribution (OOD) generalization. The plots show the normalized accuracy of linear probes trained on in-distribution (ID) and OOD datasets for each layer of the models, with and without augmentations.

This figure displays the SHAP (SHapley Additive exPlanations) values, showing the impact of each variable on two different target metrics: percentage of OOD (out-of-distribution) performance retained and ID/OOD alignment. Positive SHAP values mean that a variable increases OOD generalization or ID/OOD alignment, while negative values indicate the opposite. The magnitude of the SHAP value shows the importance of the variable. This helps determine which variables most influence a model’s ability to generalize to unseen data.

This figure presents the SHAP (SHapley Additive exPlanations) analysis results, illustrating the individual contributions of different variables to the overall OOD (out-of-distribution) generalization performance. Two target metrics were analyzed: % OOD performance retained (left) and ID/OOD alignment (right). Each bar represents a variable (e.g., ID class count, augmentations, resolution, etc.), and the bar’s length indicates the magnitude of the variable’s impact on each target metric. Positive SHAP values suggest that increasing the variable’s value improves OOD generalization, while negative values indicate the opposite. The analysis disentangles the relative importance of different factors such as the dataset’s size and diversity, augmentation strategies, and the model’s architecture in improving out-of-distribution generalisation.

This figure shows the impact of data augmentation on the tunnel effect. Two different model architectures, ResNet-34 and ViT-T+, are trained on the same dataset with and without data augmentation. The results show that data augmentation significantly reduces the tunnel effect, shifting the point at which OOD accuracy begins to decrease to a later layer in the network. This improvement is observed in both model architectures, suggesting that data augmentation is a generalizable technique for mitigating the tunnel effect and improving OOD generalization.

This figure shows how data augmentation impacts the tunnel effect. Two models (ResNet-34 and ViT-T+) are trained with and without augmentations on the ImageNet-100 dataset. Linear probes trained on ID and OOD datasets are used to measure accuracy at each layer. The shaded areas show the 95% confidence intervals around the mean OOD accuracies. The figures demonstrate that with augmentation, the drop in OOD accuracy (indicating the tunnel effect) is delayed to a later layer or block, showcasing the effectiveness of augmentation in mitigating the tunnel effect and improving out-of-distribution generalization.
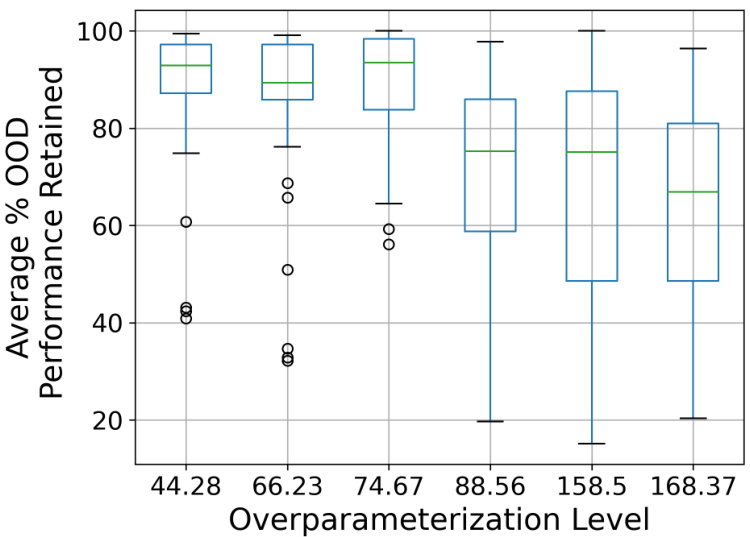
This boxplot shows the relationship between the overparameterization level of the model and the average percentage of out-of-distribution (OOD) performance retained across various OOD datasets. The results suggest that as overparameterization increases, the percentage of OOD performance retained decreases, indicating a stronger tunnel effect. The data comes from models trained on ImageNet-100 at both 32x32 and 224x224 resolutions.

This figure shows the impact of the stem size on OOD generalization performance. It compares three different stem sizes (3, 7, and 8) across two image resolutions (32x32 and 224x224) and shows that increasing the stem size negatively affects both the percentage of OOD performance retained and the ID/OOD alignment.

This figure shows the impact of stem size on the tunnel effect. The box plots present the average percentage of OOD performance retained and ID/OOD alignment across different stem sizes (3x3, 7x7, and 8x8) for models trained on ImageNet-100 with both 32x32 and 224x224 resolutions. Increasing the stem size negatively affects both metrics, indicating a stronger tunnel effect and less alignment between in-distribution and out-of-distribution performance.
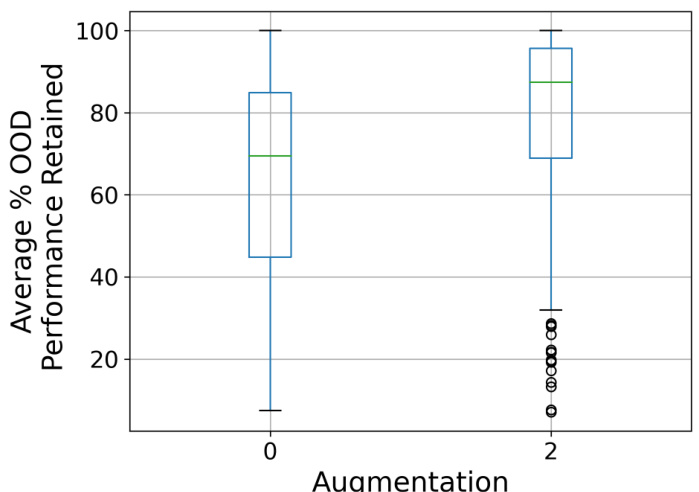
This figure shows how data augmentation affects the tunnel effect by comparing the linear probe accuracy curves for models trained with and without augmentations. The left panel shows the results for a ResNet-34 model trained on 32x32 images, while the right panel shows the results for a ViT-T+ model trained on 224x224 images. In both cases, the addition of augmentations significantly reduces the length of the ’tunnel’ region where out-of-distribution (OOD) accuracy begins to decrease sharply. This indicates that data augmentation mitigates the negative effect of the tunnel on the model’s ability to generalize to OOD data.

This figure shows the effect of image resolution on the tunnel effect. Two VGG17 models are trained with the same ImageNet-100 dataset, but one with 32x32 resolution images and the other with 224x224 resolution images. Linear probes are trained and evaluated on both in-distribution (ID) and out-of-distribution (OOD) datasets for each layer of the models. The plot demonstrates that the model trained on lower resolution images exhibits a longer tunnel, where OOD accuracy drops significantly after a certain layer, while the model trained on higher resolution images has a shorter tunnel and better OOD generalization.

This figure shows the impact of the number of classes and the number of training samples per class on the average out-of-distribution (OOD) accuracy. It demonstrates that increasing the number of classes significantly improves OOD accuracy, while increasing the number of samples per class has a less pronounced effect.

This figure shows the tunnel effect in two VGGm-17 models trained with different image resolutions (32x32 and 224x224). It demonstrates how the accuracy of linear probes trained on out-of-distribution (OOD) datasets decreases sharply after a certain layer (the ’tunnel’), especially for the low-resolution model. The high-resolution model has a shorter and less pronounced tunnel. The graph highlights that higher-resolution images mitigate the tunnel effect, improving out-of-distribution generalization.

This figure shows the effect of using data augmentation on the tunnel effect. Two examples are shown; (a) shows the results for ResNet-34 trained on 32x32 images, and (b) shows the results for ViT-T+ trained on 224x224 images. The plots show the normalized accuracy of linear probes trained on in-distribution (ID) and out-of-distribution (OOD) datasets for embeddings from each layer of the model. The shaded region represents the 95% confidence interval of the OOD accuracy. Data augmentation pushes back the onset of the tunnel effect. The start of the tunnel is marked by a star symbol.

This figure compares the percentage of out-of-distribution (OOD) performance retained for self-supervised learning (SSL) and supervised learning (SL) methods across different model architectures. The left plot shows a direct comparison between SSL and SL, while the right plot shows a breakdown of performance for different architectures within each learning paradigm. The key observation is that SSL models generally retain a higher percentage of OOD performance than their SL counterparts.

This figure shows how data augmentation affects the tunnel effect. Two examples are shown: a ResNet-34 model trained on 32x32 images (a) and a ViT-T+ model trained on 224x224 images (b). In both cases, the addition of augmentation significantly reduces the length of the tunnel, that is the range of layers where the out-of-distribution (OOD) accuracy decreases. The plots show the ID and OOD accuracy of linear probes trained on embeddings from different layers. The shaded region represents the 95% confidence interval for the OOD curves.
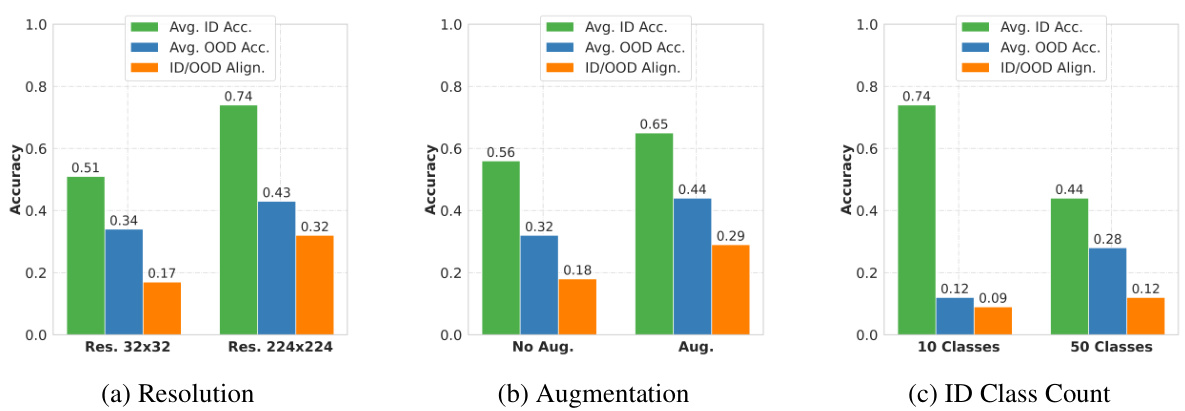
This figure shows how data augmentation impacts the tunnel effect. Two models, ResNet-34 and ViT-T+, are trained with and without augmentations on ImageNet-100. The tunnel effect, which is characterized by a decrease in out-of-distribution (OOD) accuracy while in-distribution (ID) accuracy continues to improve, is observed in both models trained without augmentation. However, when augmentation is used, the tunnel effect is reduced, and OOD accuracy drops less sharply after the extractor.
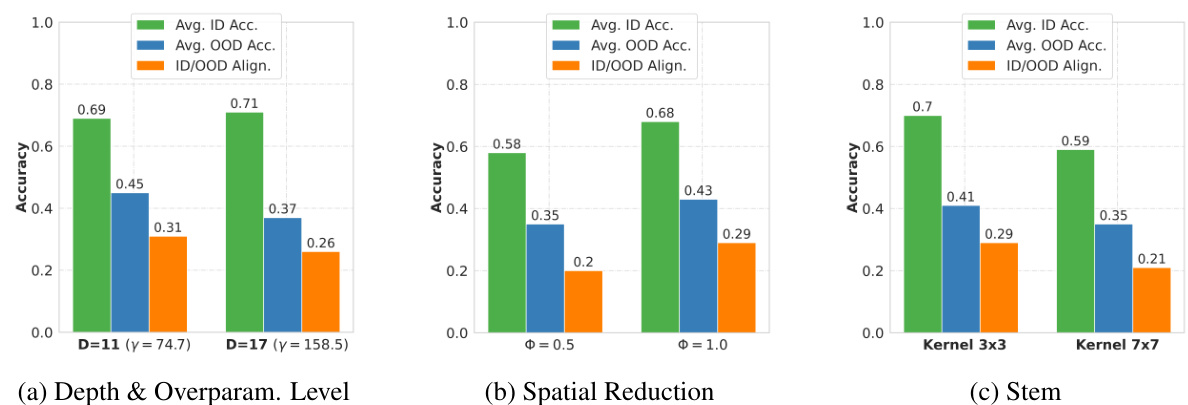
This figure shows the effect of augmentation on the tunnel effect for two different architectures: ResNet-34 and ViT-T+. It demonstrates that data augmentation significantly reduces the length of the tunnel, thereby improving out-of-distribution (OOD) generalization. The plots display the ID and OOD accuracy of linear probes applied to different layers of the networks, trained with and without augmentation. The starting point of the tunnel is marked with a star. The shaded region represents the 95% confidence interval.
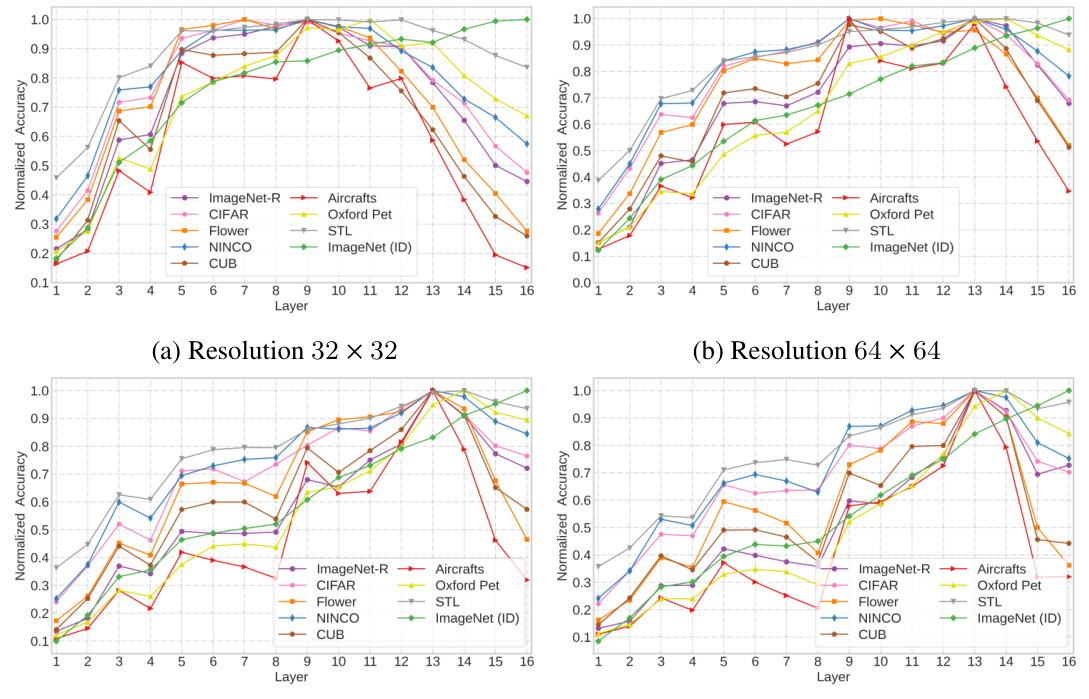
This figure shows the impact of image resolution on the tunnel effect. Two VGGm-17 models were trained on the same dataset, with the only difference being the image resolution (32x32 and 224x224). Linear probes were trained and evaluated on both in-distribution (ID) and out-of-distribution (OOD) datasets for each layer of the models. The results demonstrate that increasing the image resolution leads to a shorter tunnel, reducing the negative impact on OOD generalization.

This figure shows how the ’tunnel effect’ impacts out-of-distribution (OOD) generalization. Two VGGm-17 models are trained identically, except one uses low-resolution (32x32) images and the other uses high-resolution (224x224) images. Linear probes are used to evaluate the accuracy of embeddings from each layer on both in-distribution (ID) and OOD datasets. The plot demonstrates that ID accuracy increases monotonically with layer depth, whereas OOD accuracy decreases sharply after a certain layer (the beginning of the ’tunnel’). The high-resolution model shows a much shorter ’tunnel’ and better OOD generalization than the low-resolution model, illustrating that higher resolution mitigates the tunnel effect. The shaded area shows the standard deviation across multiple OOD datasets.

This figure shows the impact of data augmentation on the tunnel effect in two different model architectures, ResNet-34 and ViT-T+. In both cases, adding augmentation significantly reduces the length of the tunnel (the section of the network where out-of-distribution accuracy decreases). The plots show the accuracy of linear probes trained on in-distribution (ID) and out-of-distribution (OOD) data at each layer of the network. The shaded region represents the 95% confidence interval of the OOD accuracy.
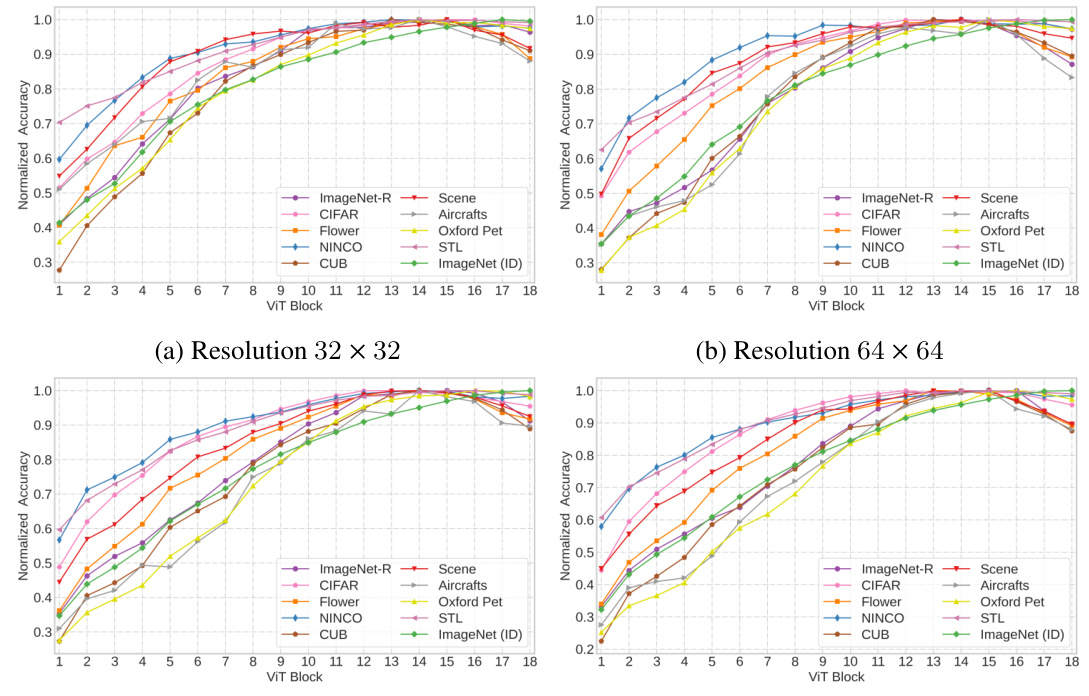
This figure shows how data augmentation affects the tunnel effect. Two example models (ResNet-34 and ViT-T+) are shown, trained with and without augmentation. The plots show the accuracy of linear probes trained on both in-distribution (ID) and out-of-distribution (OOD) data at each layer of the network. In both models, augmentation reduces the length of the tunnel, meaning that the detrimental effect of deeper layers on out-of-distribution generalization is less significant when augmentation is used during training.
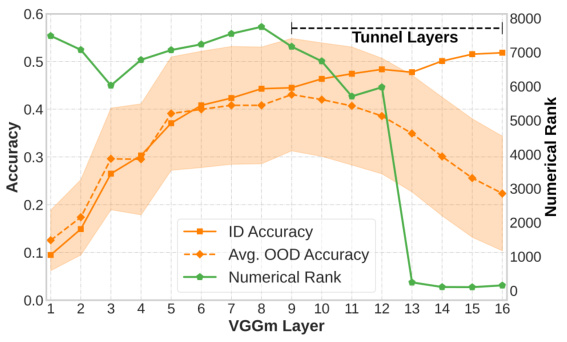
This figure demonstrates the tunnel effect, where the out-of-distribution (OOD) accuracy of a model decreases after a certain layer, while in-distribution (ID) accuracy increases monotonically. Two identical VGGm-17 networks are trained on the same dataset, but with different resolutions (32x32 and 224x224). The higher-resolution model shows a shorter tunnel (layers where OOD accuracy drops), indicating that higher resolution data mitigates the tunnel effect.
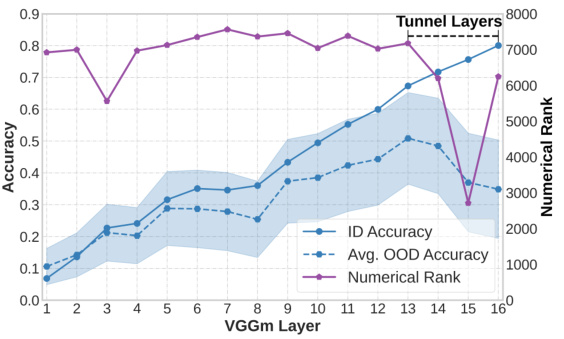
This figure shows the impact of image resolution on the tunnel effect. Two identical VGGm-17 models are trained on the same in-distribution (ID) dataset, one with 32x32 resolution images and the other with 224x224 resolution images. Linear probes are used to evaluate the accuracy of embeddings from each layer on both ID and out-of-distribution (OOD) datasets. The results show that the model trained with low-resolution images (32x32) exhibits a longer tunnel effect (layers 9-16) than the model trained with high-resolution images (224x224) (layers 13-16). The tunnel effect impedes the OOD generalization.
More on tables

This table presents the results of continual learning experiments. It shows the impact of swapping the ’tunnel’ (a set of layers in a neural network) and the ’extractor’ (another set of layers) trained on two sequential tasks. The table demonstrates how the tunnel’s presence or absence affects the ability of the model to retain knowledge from the first task when learning the second and whether fine-tuning just the extractor or the whole model (extractor + tunnel) is more effective at mitigating catastrophic forgetting. The results are shown for both 32x32 and 224x224 image resolutions.

This table presents the out-of-distribution (OOD) accuracy results for various deep neural network (DNN) models trained on different image datasets (ImageNet-100, CIFAR-10, CIFAR-100) with varied image resolutions (32x32, 224x224) and augmentation techniques. The table shows the average OOD accuracy across eight different OOD datasets (NINCO, ImageNet-R, CUB, Aircrafts, Flowers, Pets, CIFAR-10, STL-10). The results are separated into models trained with and without augmentations. It allows for comparison of OOD accuracy based on various model architectures, resolutions, and augmentation methods.

This table lists eight different large pre-trained models and the augmentations used for training each model. The augmentations are described in detail, providing a comprehensive overview of the data augmentation strategies employed.

This table shows the out-of-distribution (OOD) accuracy of different models trained on ImageNet-100, CIFAR-10, and CIFAR-100 datasets. The models were tested with different image resolutions and augmentations. The table compares the OOD accuracy across nine different OOD datasets, highlighting the impact of model architecture, training data, image resolution, and augmentations on OOD performance.

This table presents the percentage of out-of-distribution (OOD) performance retained across various models and experimental settings. The metrics are calculated for 8 different OOD datasets and are compared for various image resolutions (32x32 and 224x224), with and without augmentations. A higher percentage indicates a weaker tunnel effect and better OOD generalization. The over-parameterization level (γ) is also included as it’s a factor that might impact OOD generalization.

This table presents the Pearson correlation values for various models trained on the ImageNet-100 dataset with different resolutions and augmentation strategies. Higher Pearson correlation indicates a weaker tunnel effect and better out-of-distribution generalization. The table includes results with and without augmentation, allowing comparison of their impact on the tunnel effect.

This table presents the ID/OOD alignment scores for various DNN models trained with different settings (augmentation and resolution). Higher scores indicate a weaker tunnel effect and better out-of-distribution generalization. The table includes results for models with and without augmentations and compares performance across various datasets.

This table shows the out-of-distribution (OOD) accuracy of several large pre-trained models on various datasets. The models were pre-trained using either self-supervised learning (SSL) or supervised learning (SL). The table shows the average OOD accuracy across nine different datasets, along with 95% confidence intervals. The overparameterization level (γ) is also included. This table helps to compare the generalization capabilities of models trained with different methods and architectures.

This table shows the percentage of out-of-distribution (OOD) performance retained for eight widely used ImageNet-1K pre-trained CNN and ViT backbones trained with either supervised learning (SL) or self-supervised learning (SSL). The results are broken down by model and OOD dataset, providing a comparison of performance across different models and datasets. A higher percentage indicates a lesser tunnel effect and better OOD generalization. The over-parameterization level (γ) is also included.

This table shows the out-of-distribution (OOD) accuracy of various large pre-trained models on 8 different OOD datasets. The models include those trained with self-supervised learning (SSL) and supervised learning (SL). The results are presented as average accuracy with 95% confidence intervals. The over-parameterization level (γ) is also indicated.
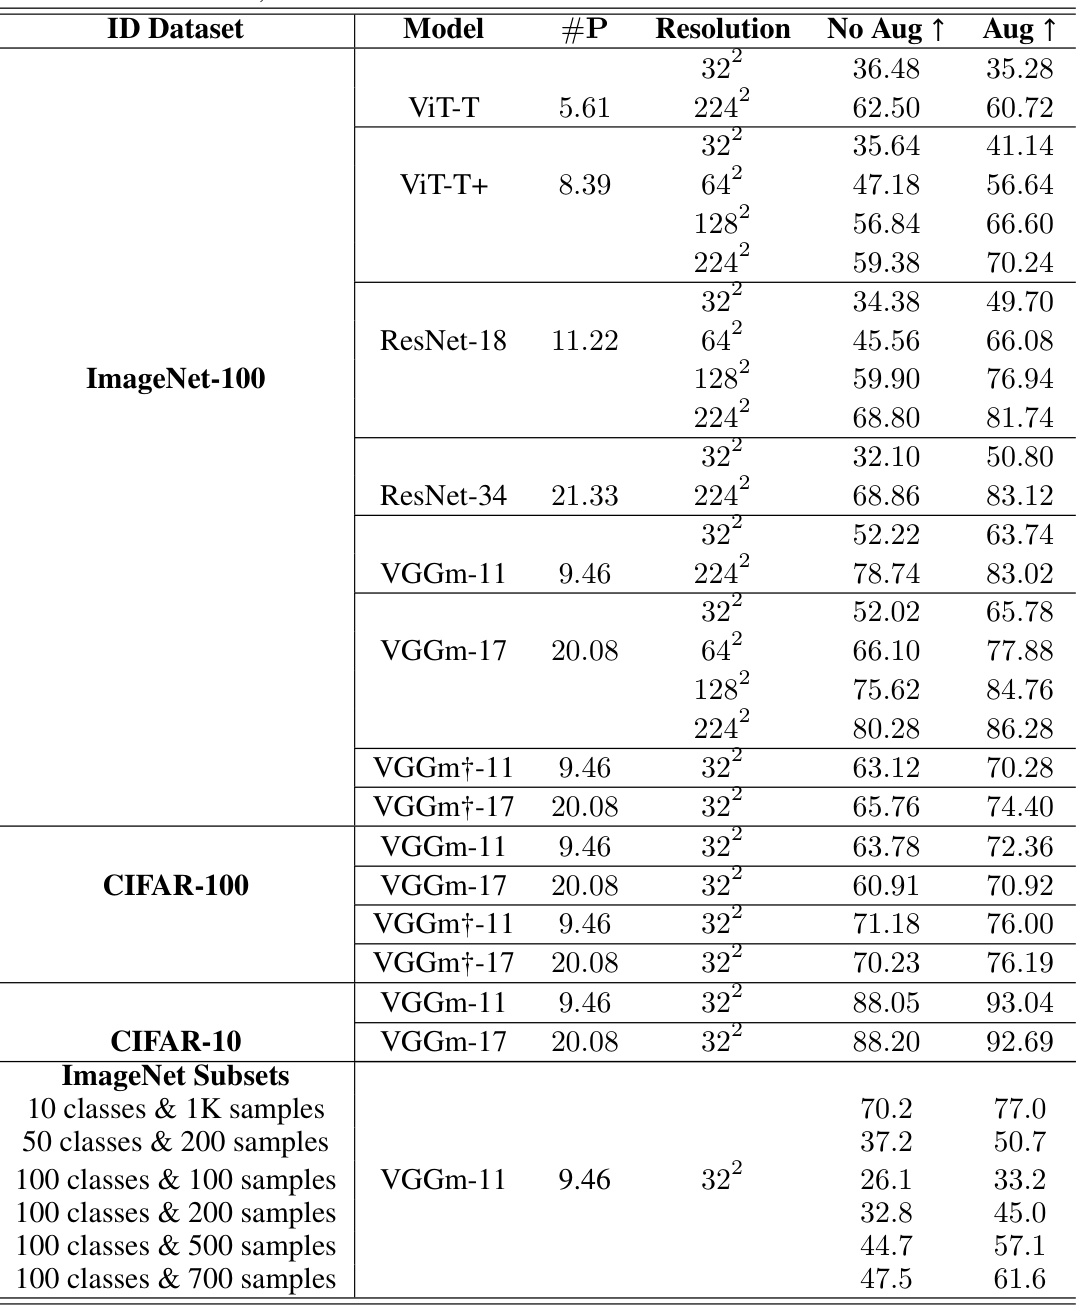
This table presents the in-distribution (ID) accuracy for 64 different deep neural networks (DNNs) trained on four different datasets: CIFAR-10, CIFAR-100, ImageNet-100, and subsets of ImageNet. The table shows the top-1 accuracy achieved by each DNN on its respective training dataset. The results are broken down by DNN architecture (ViT, ResNet, VGGm), resolution of input images (32x32, 64x64, 128x128, 224x224), and whether or not data augmentation was used during training. The number of parameters (#P) for each DNN model is also included. The table is structured to facilitate comparisons between DNN architectures and the effect of varying image resolution and augmentation.
This table presents the out-of-distribution (OOD) accuracy results for various deep neural networks (DNNs) trained on different image datasets. The results are categorized by model architecture, image resolution (32x32 vs. 224x224), and whether data augmentation was used during training. The table shows the average OOD accuracy across nine different OOD datasets for each DNN configuration, along with 95% confidence intervals to indicate the variability of the results.
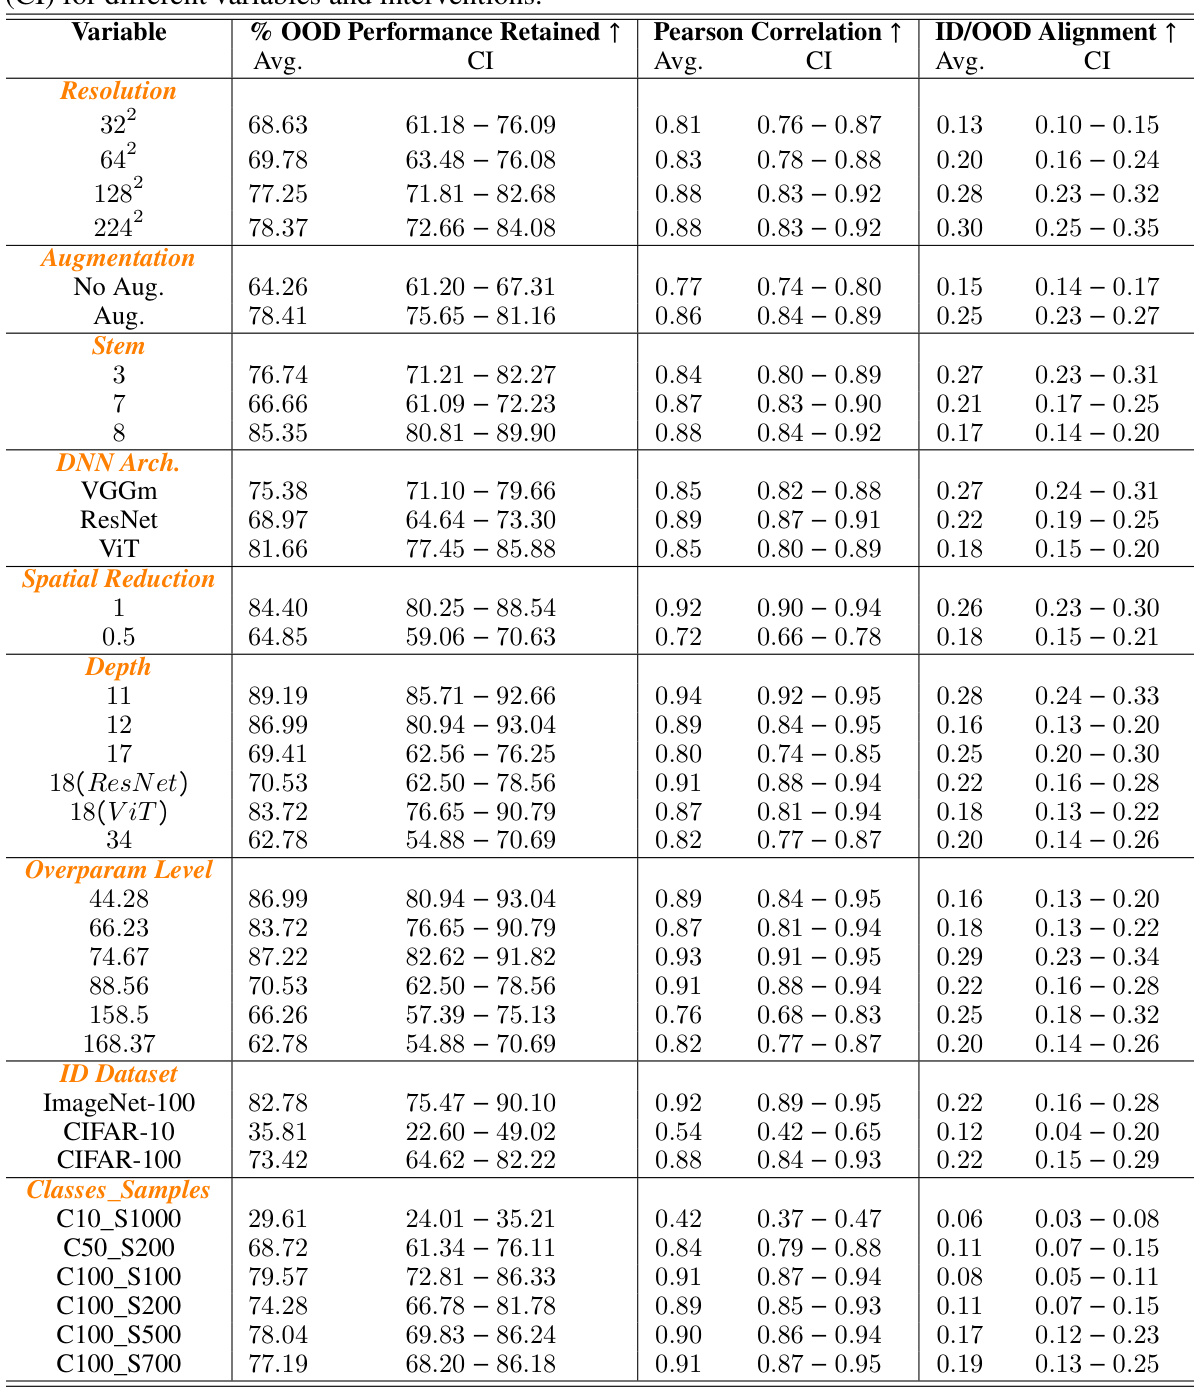
This table summarizes the average results for three metrics (% OOD Performance Retained, Pearson Correlation, and ID/OOD Alignment) across different experimental settings. These settings include variations in image resolution, the use of augmentations, different DNN architectures (VGGm, ResNet, ViT), levels of spatial reduction, the depth of the network, the overparameterization level, the number of classes in the training data (ID Class Count), and different training datasets (CIFAR-10, CIFAR-100, ImageNet-100). The table provides average values and 95% confidence intervals for each metric under each experimental condition.
Full paper#


