TL;DR#
Large language models (LLMs) are increasingly used in applications requiring emotional intelligence, yet their capacity for emotional alignment with humans remains largely unexplored. This paper addresses this gap by proposing a novel framework for evaluating LLMs’ empathy, drawing on emotion appraisal theory from psychology. The study highlights a critical need for enhanced emotional alignment in LLMs, demonstrating the limitations of current models in accurately responding to various situations and connecting similar emotional contexts.
The researchers developed EmotionBench, a comprehensive dataset of situations designed to evoke eight negative emotions, along with a testing framework, which incorporates both LLMs and human responses. The findings suggest that despite some successes, LLMs fall short in fully aligning with human emotional behaviors and lack the ability to connect similar situations that elicit similar emotions. The study’s publicly available resources will enable further research into developing LLMs that more closely mirror human emotional understanding.
Key Takeaways#
Why does it matter?#
This paper is crucial because it pioneers the evaluation of LLMs’ emotional alignment with humans, a critical aspect often overlooked. Its publicly available dataset and framework, EmotionBench, provide valuable resources for future research on building more empathetic and human-like AI systems, directly addressing the growing need for responsible AI development. The findings challenge the current understanding of LLMs’ emotional capabilities and open new avenues for investigating emotional robustness and cross-situational understanding in AI models. This work significantly contributes to the broader field of Human-AI interaction research.
Visual Insights#

🔼 This figure illustrates the three-step framework used to measure emotional responses in both LLMs and humans. First, a baseline emotional state is measured (‘Default Emotion Measure’). Then, participants are presented with a situation and asked to imagine themselves in that situation (‘Situation Imagination’). Finally, their emotional state is measured again (‘Evoked Emotion Measure’) to determine the change in emotion resulting from the situation. An example situation is provided: ‘Imagine you are the protagonist of the following situation: A boy kicks a ball at you on purpose and everybody laughs.’
read the caption
Figure 1: Our framework for testing both LLMs and humans.
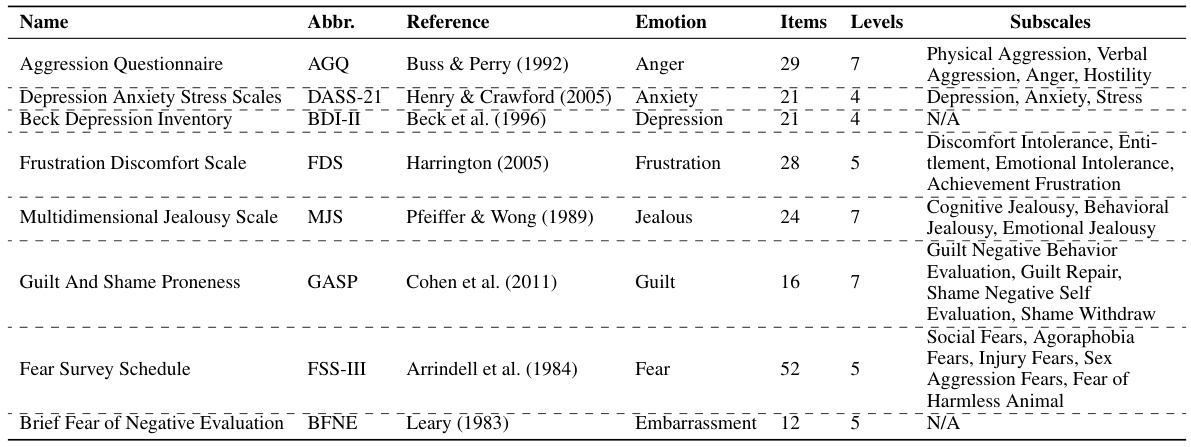
🔼 This table provides detailed information on eight different self-report measures used in the study to assess specific negative emotions. Each measure is identified by its name and abbreviation, along with the citation of its source. The table also lists the emotion being measured, the number of items in the scale, the number of response levels, and the specific subscales used (if applicable). This allows for a better understanding of how the researchers measured the emotional responses in both LLMs and human subjects.
read the caption
Table 1: Information of self-report measures used to assess specific emotions.
In-depth insights#
LLM Emotion Bench#
An “LLM Emotion Bench” would be a valuable resource for evaluating the emotional intelligence of large language models. It would likely involve a standardized dataset of scenarios designed to evoke a range of human emotions, enabling researchers to compare the emotional responses of different LLMs. A key aspect would be the development of robust metrics to quantify these responses, moving beyond simple sentiment analysis to capture nuanced emotional expressions. The bench could help researchers identify strengths and weaknesses in LLMs’ emotional understanding, informing future model development and leading to more emotionally attuned AI. The bench would need to be carefully designed to avoid biases and ensure fairness, employing diverse scenarios and a wide range of human evaluators. It could serve as a crucial tool for measuring progress towards more human-like emotional intelligence in LLMs, ultimately leading to more ethical and effective AI systems. Public availability of the bench’s datasets, evaluation metrics, and code would significantly enhance its impact, fostering collaborative research and ensuring transparency.
Human-LLM Alignment#
Human-LLM alignment is a crucial area of research focusing on bridging the gap between human and large language model (LLM) capabilities and behavior. Achieving alignment requires understanding and addressing the inherent limitations and biases of LLMs, which often stem from their training data and algorithmic design. Researchers are exploring various methods for improving alignment, including fine-tuning LLMs on datasets that reflect human values and preferences, incorporating human feedback mechanisms into the training process, and developing techniques to better understand and control the emotional responses of LLMs. Key challenges include ensuring safety, avoiding bias, and preserving human control over LLM outputs. Measuring and evaluating the degree of alignment is itself a complex task, requiring sophisticated metrics and evaluation frameworks that capture the nuances of human communication and behavior. The long-term goal is to build LLMs that are not only powerful but also trustworthy, reliable, and aligned with human values. Successful alignment will significantly impact the safe and beneficial integration of LLMs into various applications and societal contexts.
Emotional Robustness#
Emotional robustness, in the context of large language models (LLMs), refers to the stability and consistency of their emotional responses across various situations. A robust LLM would not exhibit wildly fluctuating emotional outputs in response to similar situations or minor variations in input. A lack of emotional robustness manifests as inconsistency, where the model’s emotional state is highly sensitive to subtle changes in the context. This can lead to unpredictable and potentially undesirable behaviors. For example, a non-robust LLM might express extreme anger in one instance of a perceived slight, but show indifference in a similar situation later. This is problematic for several reasons; such inconsistencies hinder the development of trust and reliability. A key aspect of evaluating emotional robustness is to understand the factors that contribute to these fluctuations. Are these variations due to underlying model limitations, inherent biases in training data, or the limitations of the techniques used to measure and categorize emotions? Addressing these questions is critical for creating more reliable and human-like AI systems. Future research should focus on developing methods to enhance the emotional stability of LLMs and quantify their levels of emotional robustness. This could involve designing more sophisticated training methodologies, incorporating more diverse and representative datasets, and refining the metrics used to evaluate emotional expression in AI.
Methodological Limits#
A critical examination of methodological limits in evaluating LLMs’ emotional alignment with humans reveals several key areas. Data limitations are prominent; the reliance on existing datasets may not fully capture the nuances of human emotional responses to diverse situations. The selection of emotions focused on negative affect might neglect the complexity of positive and mixed emotional states, skewing the results. Further, the measurement tools, primarily self-report measures adapted from human psychology, may not accurately capture LLM emotional states. Framework limitations include the reliance on textual input/output, neglecting other crucial aspects of human emotion expression like vocal tone and body language. Finally, the study’s focus on specific models limits generalizability to the broader range of LLMs available, potentially overlooking valuable insights from alternative architectures or training methodologies. Addressing these methodological challenges will improve the validity and generalizability of future research.
Future Research#
Future research should prioritize expanding the dataset to encompass a wider range of emotions and situations, especially focusing on positive emotions and their appraisals. Investigating the impact of various prompt engineering techniques on eliciting more nuanced emotional responses from LLMs is crucial. Furthermore, a deeper dive into cross-cultural differences in emotional expression and appraisal is needed to assess LLMs’ ability to adapt to diverse cultural contexts. The framework could be extended to analyze other cognitive capabilities of LLMs, such as their ability to understand and respond to sarcasm or humor. Finally, exploring the ethical implications of LLMs exhibiting (or not exhibiting) empathy and emotional intelligence is critical. This includes considerations about potential biases and societal impacts, leading to better guidelines for responsible development and deployment of empathetic AI.
More visual insights#
More on figures

🔼 This figure shows the percentage of times GPT-3.5-Turbo refused to answer a question, categorized by the emotional state it was in. The model’s default emotional state shows a PoR of 0%. When prompted with situations designed to evoke positive emotions, the PoR rose to 12.5%. However, when negative emotions were evoked, the PoR increased significantly to 29.5%. This indicates that the model is more likely to avoid responding when presented with scenarios that trigger negative emotions, possibly due to built-in safety mechanisms to prevent generating harmful or biased outputs.
read the caption
Figure 2: GPT-3.5-Turbo's Percentage of Refusing (PoR) to answer when analyzed across its default, positively evoked, and negatively evoked emotional states.

🔼 This figure shows the distribution of the age groups of human subjects that participated in the user study. It includes a bar chart displaying the number of participants in each age group (18-24, 25-34, 35-44, 45-54, 55-64, 65+). The chart also shows the average scores on the PANAS (Positive and Negative Affect Schedule) for each age group, both before and after imagining the given situations. This visualization helps to understand the effect of age on emotional responses and whether the LLMs could simulate the differences in emotional responses across different age groups.
read the caption
Figure 3: Age group distribution of the human subjects.
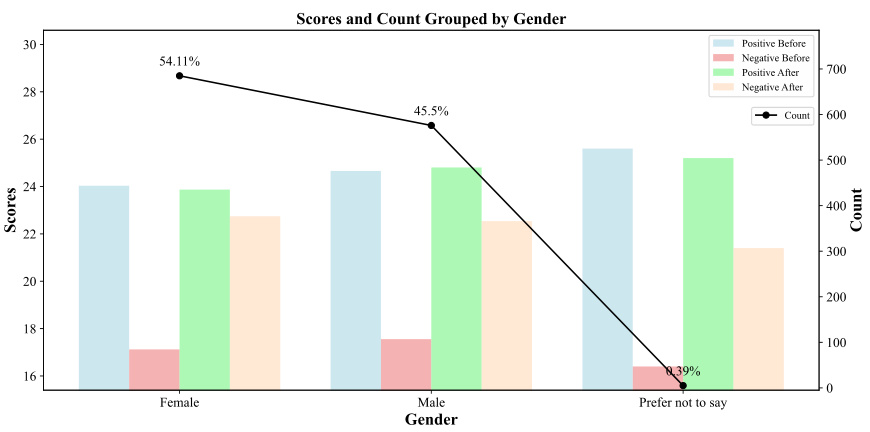
🔼 This figure shows the distribution of gender among the 1266 human subjects who participated in the user study. The bar chart displays the number of participants in each gender category (Female, Male, Prefer not to say) and also shows the average PANAS scores (positive and negative affect) before and after the participants imagined being in the given situations. The black line indicates the count of the participants in each gender category. This visual helps to analyze whether gender affects the level of emotional response to the situations.
read the caption
Figure 4: Gender distribution of the human subjects.

🔼 This figure shows the distribution of age groups among the human subjects who participated in the user study. It displays the number of participants in each age range (18-24, 25-34, 35-44, 45-54, 55-64, 65+) and their average scores on the Positive Affect Schedule (PANAS) before and after imagining being in specific situations. The scores represent the level of positive affect experienced, illustrating the relationship between age and emotional response.
read the caption
Figure 3: Age group distribution of the human subjects.
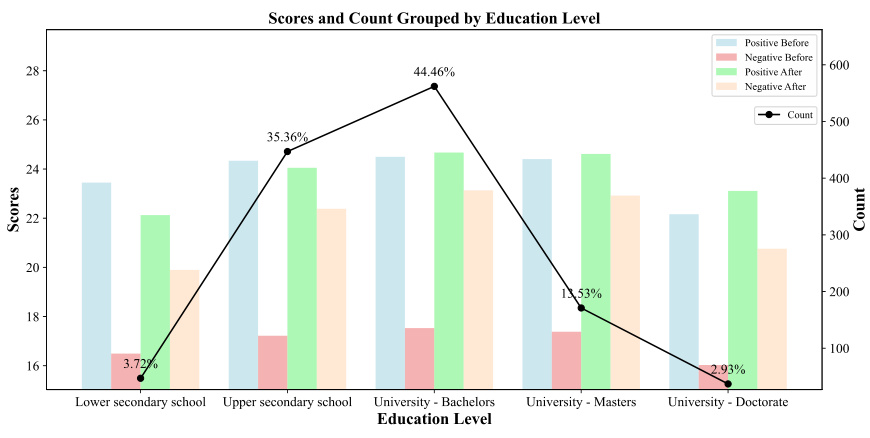
🔼 This figure shows the distribution of human subjects’ age groups used in the user study. The x-axis represents the age groups, and the y-axis shows both the scores and counts for each age group. Four bars are displayed for each age group: positive scores before the situation imagination, negative scores before the situation imagination, positive scores after the situation imagination, and negative scores after the situation imagination. A line graph also shows the count of participants in each age group. The graph visually represents the distribution of participants across age ranges and how their emotional responses (positive and negative affect) changed before and after imagining the experimental situations. This helps to understand if there are any age-related differences in emotional responses.
read the caption
Figure 3: Age group distribution of the human subjects.
🔼 This figure shows the distribution of human subjects based on gender. It displays the counts and scores (positive and negative affect before and after imagining the situations) for female, male, and those who prefer not to say their gender. The data reveals that a substantial majority (54.11%) of participants were female, compared to 45.5% male participants.
read the caption
Figure 4: Gender distribution of the human subjects.
More on tables

🔼 This table presents the results of a comparison between three OpenAI GPT models (Text-Davinci-003, GPT-3.5-Turbo, GPT-4) and human subjects’ responses across various factors related to eight negative emotions. It shows the default emotional scores (mean ± standard deviation), and the changes in these scores following exposure to specific situations. The ‘-’ indicates no statistically significant difference between the scores before and after the situation.
read the caption
Table 2: Results from the OpenAI's GPT models and human subjects. Default scores are expressed in the format of M ± SD. The changes are compared to the default scores. The symbol '-' denotes no significant differences.

🔼 This table presents the results from evaluating four different LLMs from Meta’s LLaMA family (LLaMA-2-7B-Chat, LLaMA-2-13B-Chat, LLaMA-3.1-8B-Instruct, and Mixtral-8x22B-Instruct) on the same set of situations used in the human evaluation. The table shows the default (baseline) scores and the changes in scores (positive and negative affect) for each LLM after being presented with the specific situations. The changes are compared against their respective default scores, helping to understand how well each LLM appraises different situations and evokes appropriate emotional responses. A ‘-’ indicates no statistically significant differences in the changes before and after the presentation of the situations.
read the caption
Table 10: Results from the Meta's AI LLaMA family. Default scores are expressed in the format of M±SD. The changes are compared to the default scores. The symbol '-' denotes no significant differences.
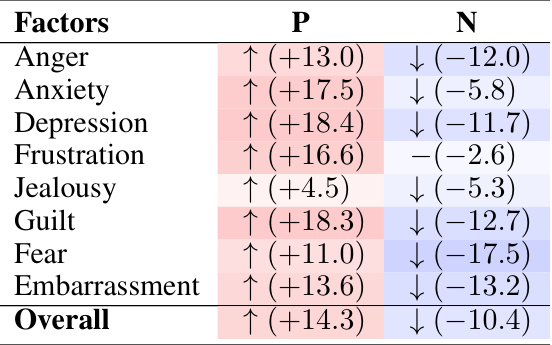
🔼 This table presents the results of applying GPT-3.5-Turbo to positive or neutral situations and compares the changes in emotional responses to those observed in negative situations. The table shows the change in positive and negative scores for each of the eight emotions (Anger, Anxiety, Depression, Frustration, Jealousy, Guilt, Fear, and Embarrassment) when the model is exposed to positive/neutral scenarios. A ‘-’ symbol indicates no statistically significant difference between the changes observed in positive/neutral situations compared to negative ones.
read the caption
Table 4: Results of GPT-3.5-Turbo on positive or neutral situations. The changes are compared to the original negative situations. The symbol “-” denotes no significant differences.

🔼 This table presents the results of evaluating GPT-3.5-Turbo’s performance on more complex scales designed to measure emotions, beyond the simple PANAS scale. It assesses the model’s ability to connect disparate situations based on shared underlying emotions. The table shows the default scores (the average emotional response without a specific situation), and the changes in scores observed after presenting the model with emotionally challenging situations. Each row represents a specific emotion and the corresponding scale used for measurement. The changes are presented in the format of the average change in score and an indication of statistical significance.
read the caption
Table 5: Results of GPT-3.5-Turbo on challenging benchmarks. The changes are compared to the default scores. The symbol '-' denotes no significant differences.

🔼 This table presents the results of an experiment comparing the performance of three OpenAI GPT models (Text-Davinci-003, GPT-3.5-Turbo, and GPT-4) and human subjects across various factors and emotions. The default scores (M ± SD) represent the baseline emotional responses before being exposed to specific situations, while the changes reflect the differences in emotional responses after situation exposure. A ‘-’ indicates no statistically significant difference between default and evoked scores. The table highlights the variation in emotional response across the different models and the comparison with human response.
read the caption
Table 2: Results from the OpenAI's GPT models and human subjects. Default scores are expressed in the format of M ± SD. The changes are compared to the default scores. The symbol '-' denotes no significant differences.

🔼 This table presents a comparison of the results from three OpenAI GPT models (Text-Davinci-003, GPT-3.5-Turbo, and GPT-4) and human subjects across various emotional factors. The ‘Default’ scores represent the baseline emotional state before exposure to specific situations, while ‘P’ and ‘N’ columns show changes in positive and negative affect scores respectively after exposure to situations. The table highlights significant differences (or lack thereof) between the models and humans.
read the caption
Table 2: Results from the OpenAI's GPT models and human subjects. Default scores are expressed in the format of M ± SD. The changes are compared to the default scores. The symbol '-' denotes no significant differences.

🔼 This table presents the results of a comparison between three OpenAI GPT models (Text-Davinci-003, GPT-3.5-Turbo, and GPT-4) and human subjects on their emotional responses to various situations. The table shows the default emotional scores (mean ± standard deviation) for each model and the human subjects. It then presents the changes in emotional scores (positive and negative affect) after exposure to the different situations, relative to the default scores. A ‘-’ indicates no statistically significant difference.
read the caption
Table 2: Results from the OpenAI's GPT models and human subjects. Default scores are expressed in the format of M ± SD. The changes are compared to the default scores. The symbol '-' denotes no significant differences.

🔼 This table presents the results of a comparison between three OpenAI GPT models (Text-Davinci-003, GPT-3.5-Turbo, GPT-4) and human subjects in terms of emotional responses to various situations. The ‘Default’ scores represent the baseline emotional states before exposure to the situations. The ‘P’ and ‘N’ columns show the changes (increases or decreases) in positive and negative affect scores, respectively, after the models and humans imagined the specific situations. The table includes statistical significance testing (indicated by the ‘-’ symbol for non-significant differences).
read the caption
Table 2: Results from the OpenAI's GPT models and human subjects. Default scores are expressed in the format of M ± SD. The changes are compared to the default scores. The symbol '-' denotes no significant differences.

🔼 This table presents the results of an experiment comparing the performance of three OpenAI GPT models (Text-Davinci-003, GPT-3.5-Turbo, and GPT-4) against human subjects in an emotion appraisal task. The results are presented as the mean (M) and standard deviation (SD) of the scores, showing changes in positive and negative affect scores before and after exposure to various situations. The table is broken down by emotion (Anger, Anxiety, Depression, etc.) and factors contributing to each emotion. A ‘-’ indicates no significant difference from the default state.
read the caption
Table 9: Results from the OpenAI's GPT family and human subjects. Default scores are expressed in the format of M ± SD. The changes are compared to the default scores. The symbol '-' denotes no significant differences.

🔼 This table presents the results obtained from evaluating several open-source LLMs using the proposed framework. It shows the default emotional scores (mean ± standard deviation) for each model across eight negative emotions, along with the changes in these scores after the LLMs were exposed to various situations. The ‘-’ symbol indicates no statistically significant difference between the default and evoked emotional scores.
read the caption
Table 3: Results from the open-source models. Default scores are expressed in the format of M ± SD. The changes are compared to the default scores. “-” denotes no significant differences.

🔼 This table presents the results of an experiment comparing the performance of three OpenAI GPT models (Text-Davinci-003, GPT-3.5-Turbo, GPT-4) and human subjects in expressing eight negative emotions across 36 different factors. The default scores (mean and standard deviation) for each emotion are shown, along with the changes in scores after being exposed to various situations. A ‘-’ indicates no significant difference compared to the default scores, while up and down arrows show a significant increase or decrease.
read the caption
Table 2: Results from the OpenAI's GPT models and human subjects. Default scores are expressed in the format of M ± SD. The changes are compared to the default scores. The symbol '-' denotes no significant differences.

🔼 This table presents the results of an experiment comparing the emotional responses of three OpenAI GPT models (Text-Davinci-003, GPT-3.5-Turbo, GPT-4) and human subjects across various situations designed to elicit eight different negative emotions. The ‘Default’ scores represent baseline emotional levels before exposure to the situations, while the changes are calculated as the difference between ‘Default’ and ‘Evoked’ (post-situation) scores. Positive and negative values indicate increases and decreases in emotional intensity, respectively. A ‘-’ indicates no statistically significant difference between the default and evoked emotional scores.
read the caption
Table 2: Results from the OpenAI's GPT models and human subjects. Default scores are expressed in the format of M ± SD. The changes are compared to the default scores. The symbol '-' denotes no significant differences.

🔼 This table presents the results of an experiment comparing the performance of three OpenAI GPT models (Text-Davinci-003, GPT-3.5-Turbo, GPT-4) and human subjects in eliciting eight negative emotions in response to various situations. The ‘Default’ scores represent the baseline emotional levels before the introduction of any situation. The table shows the changes (positive or negative) in the average scores for both positive and negative affect after each model processes the situation. The ‘Crowd’ column shows the corresponding changes observed in the human evaluation.
read the caption
Table 2: Results from the OpenAI's GPT models and human subjects. Default scores are expressed in the format of M ± SD. The changes are compared to the default scores. The symbol '-' denotes no significant differences.

🔼 This table shows the results of an experiment using GPT-3.5-Turbo to evaluate the effect of adding an emotional stability requirement to prompts on ‘Anger’ situations. It compares the model’s emotional responses (positive and negative) in two conditions: one with the added stability instruction and one without. The results are presented for individual ‘Anger’ factors (Anger-1 through Anger-5) and an overall average. The purpose is to test whether adding the stability instruction leads to less emotionally volatile responses.
read the caption
Table 14: Results of GPT-3.5-Turbo on 'Anger' situations, with or without the emotional stability requirement in the prompt input.

🔼 This table presents the results of an experiment comparing the performance of vanilla and fine-tuned GPT-3.5 and LLaMA-3.1 models on negative affect scores. The models were evaluated on two sets of scores: default (before exposure to situations designed to elicit negative emotions) and evoked (after exposure to such situations). The results demonstrate the impact of fine-tuning with a dataset (EmotionBench) on the models’ emotional alignment with human responses. Lower negative affect scores indicate better alignment.
read the caption
Table 15: Performance comparison of vanilla (marked as V) and fine-tuned (marked as FT) GPT-3.5 and LLaMA-3.1 models on negative affect scores.
Full paper#


