TL;DR#
3D integrated circuits (ICs) present new challenges for floorplanning, a crucial step in IC design. Existing methods struggle with the flexible constraints of 3D ICs and often rely on heuristics, limiting their effectiveness and solution space. Furthermore, accurately aligning cross-die modules is vital but difficult to achieve with current techniques, leading to potential data transfer issues.
FlexPlanner tackles these problems by employing deep reinforcement learning. It uses a novel hybrid action space and multi-modality representation (vision, graph, and sequence) to directly optimize the position, aspect ratio, and alignment of blocks simultaneously. The results on public benchmarks show that FlexPlanner significantly improves alignment scores and reduces wirelength compared to state-of-the-art methods. Importantly, it also exhibits zero-shot transferability, effectively handling unseen circuit designs without retraining. This flexibility and performance improvement demonstrate a significant advancement in 3D floorplanning.
Key Takeaways#
Why does it matter?#
This paper is important because it presents a novel approach to 3D floorplanning, a critical task in integrated circuit (IC) design. The proposed method, FlexPlanner, significantly improves upon existing techniques by discarding heuristic-based searches and leveraging deep reinforcement learning in a hybrid action space with multi-modality representation. This advancement addresses limitations of existing methods in handling complex 3D constraints and opens new avenues for research in AI-driven EDA.
Visual Insights#

🔼 This figure illustrates the architecture of FlexPlanner, a deep reinforcement learning model for 3D floorplanning. The model uses a multi-modal input (vision, graph, and sequence) which is processed by a shared encoder. The resulting embedding is fed into three separate decision modules (position, layer, and aspect ratio). These modules output probabilities, which are then masked to ensure that the actions satisfy constraints (such as alignment and no-overlap). The masked probabilities are then used by the Actor-Critic framework to optimize the floorplan.
read the caption
Figure 1: Pipeline of FlexPlanner. Under the Actor-Critic framework, taking the multi-modality representation as input, the policy network consists of three sub-modules, responsible for determining the position, layer, and aspect ratio of blocks. Alignment mask and position mask are incorporated to filter out invalid positions where constraints (alignment, non-overlap, etc.) are not satisfied.
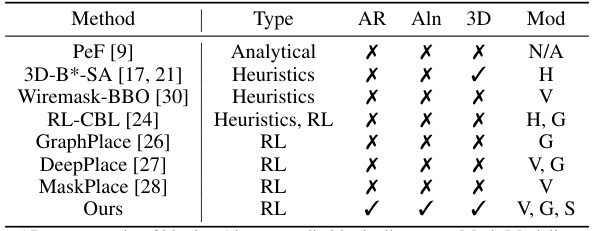
🔼 This table compares different floorplanning methods, highlighting their type (analytical, heuristics-based, or learning-based), whether they handle aspect ratio (AR) and cross-die alignment (Aln) of blocks, whether they are designed for 3D floorplanning, and the modalities (vision, graph, sequence) they use in their representation.
read the caption
Table 1: Characteristics of typical methods.
In-depth insights#
3D FP’s Challenges#
Three-dimensional floorplanning (3D FP) presents significant challenges compared to its 2D counterpart. Managing the increased complexity of interconnect routing across multiple layers is a major hurdle, demanding sophisticated algorithms to minimize wirelength and optimize signal integrity. Aligning components across different dies, especially when considering vertical interconnects, introduces additional constraints that traditional heuristics often struggle to satisfy. Heuristic-based approaches often lack the flexibility to navigate this expanded design space, while analytic methods may suffer from non-differentiable alignment calculations in the 3D context. Learning-based methods offer promise, but the non-trivial nature of 3D FP necessitates robust learning frameworks capable of handling the multi-modal nature of design data such as visual, graphical, and sequential representations to find effective solutions. Zero-shot transferability remains a key aspiration in 3D FP to reduce the need for extensive retraining when dealing with variations in circuit configurations. Addressing these multifaceted challenges necessitates innovative approaches that seamlessly integrate efficient search strategies with robust representation schemes to deliver effective 3D floorplans.
Hybrid Action Space#
The concept of a ‘Hybrid Action Space’ in reinforcement learning, particularly within the context of 3D floorplanning, represents a significant advancement. It elegantly addresses the limitations of purely discrete or continuous action spaces by combining the strengths of both. A discrete space might represent choices like placing a block on a specific layer, while a continuous space could handle adjustments to its position or aspect ratio. This hybrid approach allows for fine-grained control in optimizing placement and alignment, overcoming the limitations of simpler approaches. This flexibility is crucial in complex tasks like 3D floorplanning, where numerous constraints and considerations must be addressed simultaneously. The ability to finely tune block parameters continuously while also making discrete decisions about layout significantly improves the search efficiency and solution quality compared to using either type of action space alone. A well-designed hybrid action space is instrumental in achieving near-optimal solutions in complex, constrained environments.
Multi-modality Modeling#
Multi-modality modeling in this context likely refers to the integration of diverse data representations for enhanced 3D floorplanning. The approach likely leverages the strengths of visual data (images of layouts), graph structures (representing block connectivity), and sequential information (block placement order). By combining these modalities, the model can capture both spatial relationships and global design constraints more effectively than methods relying on a single representation. This holistic approach is particularly valuable in 3D floorplanning due to the complex interplay between layers and cross-die connections, aspects that are better handled by a system capable of synthesizing information from multiple sources. The fusion of these modalities should ideally lead to a more robust and accurate floorplan, improving aspects like wirelength and alignment, which are critically impacted by how well block relationships are captured.
Asynchronous Decisions#
In asynchronous decision-making systems, unlike their synchronous counterparts, events and actions are not processed in a strictly sequential order. This approach is particularly valuable in dynamic environments where rigid scheduling is impractical. The key advantage lies in its responsiveness and efficiency: components can act immediately upon receiving relevant information, without waiting for a global synchronization signal. This results in improved throughput and reduced latency, particularly important for real-time applications. However, asynchronous systems introduce complexities in coordination and error handling. Careful design is required to ensure data consistency, prevent race conditions, and manage concurrent access to shared resources. Effective strategies such as locks, semaphores, and message queues are often employed to mitigate these challenges. Careful consideration must also be given to the trade-off between responsiveness and consistency. In some cases, a small delay for synchronization may be preferable to the risk of data corruption or inconsistencies.
Zero-Shot Transfer#
Zero-shot transferability is a crucial aspect of machine learning, particularly in resource-constrained domains like 3D floorplanning. The capacity of FlexPlanner to demonstrate zero-shot transferability on unseen circuits highlights its robustness and efficiency. This eliminates the need for extensive retraining on new datasets, drastically reducing computational costs and development time. The success of zero-shot transfer in FlexPlanner likely stems from the model’s multi-modality representation which captures richer information about the floorplanning problem. The inclusion of vision, graph, and sequence data facilitates learning generalizable features that are less sensitive to the specifics of individual circuit designs. Therefore, FlexPlanner’s successful zero-shot transfer performance is a testament to the model’s ability to learn underlying principles rather than memorizing specific circuit layouts. This capability is a significant advancement for efficient and scalable 3D IC design automation.
More visual insights#
More on figures

🔼 This figure demonstrates the concept of alignment in the 3D floorplanning task. It shows how the alignment mask is generated. The green area in (a) represents the area of the block to be placed, while the yellow area shows the area already occupied by its alignment partner. Subfigures (b), (c), and (d) illustrate X-axis, Y-axis and full alignment scores, respectively. Finally, (e) shows a binary mask indicating valid positions where the alignment constraint is met, which is used to filter out invalid positions.
read the caption
Figure 2: Demonstration of alignment. In (a), the green region will be occupied by the block to place, and the yellow region is occupied by its alignment partner block which has already been placed. X-, Y-dimensional and full alignment are shown in (b)(c)(d). Only (x, y) satisfying alnalny ≥ alnm are valid positions shown in (e), and this binary mask can be incorporated to filter out invalid positions.

🔼 This figure shows two examples of 3D floorplans generated by the proposed FlexPlanner method. Each block is assigned a unique index and color. Blocks with the same index and color across different dies represent an alignment pair, indicating that they are aligned vertically and share a common projected 2D area. Gray blocks indicate modules without any alignment partners. This visualization demonstrates the algorithm’s capability to handle alignment constraints effectively in 3D floorplanning.
read the caption
Figure 3: Our 3D floorplan result. Two blocks with the same index and the same color on different dies form an alignment pair, which roughly locate on the same positions and share a 2D common projected area. Gray blocks mean they do not have alignment partners.

🔼 This figure compares the cross-die alignment performance of the proposed FlexPlanner method against three baselines (GraphPlace, DeepPlace, and Wiremask-BBO) on circuit n50. It visually represents the alignment results using color-coded blocks: green for aligned blocks (alignment score ≥ 0.5), red for non-aligned blocks (alignment score < 0.5), and gray for blocks without alignment partners. The figure clearly shows that FlexPlanner achieves significantly higher alignment scores compared to the baselines.
read the caption
Figure 4: Visualization of cross-die block alignment on circuit n50. Two blocks with the same index forms an alignment pair. For a pair with block i, j, we calculate individual alignment score aln(i, j) according to Eq. 1. Green means these two blocks are aligned (aln(i, j) ≥ 0.5) while red means not aligned (aln(i, j) < 0.5). Total alignment score is calculated according to Alg. 3 in Appendix G.1. It demonstrates that our method achieves much better alignment score than other baselines.
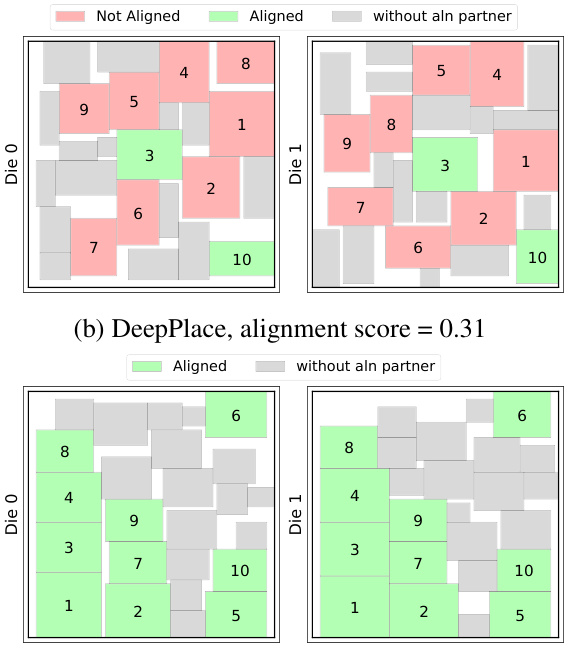
🔼 This figure compares the alignment performance of the proposed FlexPlanner method against several baselines (GraphPlace, DeepPlace, and Wiremask-BBO) on circuit n50. The visualization uses color-coding to represent alignment success (green) or failure (red) for pairs of blocks across different dies. The overall alignment score for each method is also displayed, highlighting FlexPlanner’s superior performance.
read the caption
Figure 4: Visualization of cross-die block alignment on circuit n50. Two blocks with the same index forms an alignment pair. For a pair with block i, j, we calculate individual alignment score aln(i, j) according to Eq. 1. Green means these two blocks are aligned (aln(i, j) ≥ 0.5) while red means not aligned (aln(i, j) < 0.5). Total alignment score is calculated according to Alg. 3 in Appendix G.1. It demonstrates that our method achieves much better alignment score than other baselines.

🔼 This figure shows the training curves of the FlexPlanner model on circuits n200 and n300, comparing two training strategies: fine-tuning from a pre-trained model on circuit n100 and training from scratch. The plots display the alignment score and HPWL (half-perimeter wire length) over training epochs for both strategies. The shaded areas represent the standard deviation across multiple training runs. The results demonstrate the effectiveness of fine-tuning, showcasing faster convergence and potentially better performance compared to training from scratch.
read the caption
Figure 5: Training curve between fine-tune (based on circuit n100) and training from scratch.

🔼 This figure demonstrates the impact of the alignment mask and reward function on the training process. The left subplot shows that using the alignment mask as both input and constraint leads to better alignment results compared to using it as only input or constraint, or not using it at all. The right subplot illustrates how the reward function influences layer decision-making, showing that the proposed reward function prevents the model from converging to a suboptimal solution.
read the caption
Figure 6: (a) Influence of the alignment mask. As the input feature, it plays a critical role in capturing the alignment information. As a constraint, it reduces the action space and accelerates the training process. (b) Influence of rewards on layer decision, shown in circuit n100 with episode length L = 100 and |D| = 2 dies. zt is the determined layer index at step t, and Z = Σt=1L/2zt is the layer index sum of the first half of the placing sequence. Z → 0 or Z → L/2 means degeneration to die-by-die synchronous layer decision (almost all die 0 or 1 in the first half episode).

🔼 This figure demonstrates the impact of the alignment mask and reward function in the proposed 3D floorplanning method. The left subplot shows how using the alignment mask as both input and constraint significantly improves alignment. The right subplot illustrates the effect of different reward functions on layer decision-making, showcasing the effectiveness of the proposed reward design in preventing premature convergence to suboptimal solutions.
read the caption
Figure 6: (a) Influence of the alignment mask. As the input feature, it plays a critical role in capturing the alignment information. As a constraint, it reduces the action space and accelerates the training process. (b) Influence of rewards on layer decision, shown in circuit n100 with episode length L = 100 and |D| = 2 dies. zt is the determined layer index at step t, and Z = Σt=1L/2zt is the layer index sum of the first half of the placing sequence. Z → 0 or Z → L/2 means degeneration to die-by-die synchronous layer decision (almost all die 0 or 1 in the first half episode).

🔼 This figure shows the 3D floorplanning results obtained by FlexPlanner for two example circuits (n50 and n100). Blocks with the same index and color across multiple dies represent alignment pairs. These blocks aim to occupy similar positions in their respective dies. Gray blocks indicate no alignment partners.
read the caption
Figure 3: Our 3D floorplan result. Two blocks with the same index and the same color on different dies form an alignment pair, which roughly locate on the same positions and share a 2D common projected area. Gray blocks mean they do not have alignment partners.
More on tables

🔼 This table compares the alignment scores achieved by FlexPlanner against several baseline methods across different benchmark circuits. The alignment score is a metric reflecting the quality of cross-die module alignment in 3D floorplanning. Higher scores indicate better alignment. The table shows that FlexPlanner significantly outperforms all baseline methods, achieving much higher alignment scores.
read the caption
Table 2: Alignment score comparison among baselines and our method. The higher the alignment score, the better, and the optimal results are shown in bold. C/M means Circuit/Method.

🔼 This table compares the alignment scores achieved by FlexPlanner and other existing methods (3D-B*-SA, RL-CBL, Wiremask-BBO, GraphPlace, DeepPlace, MaskPlace) on several benchmark circuits (ami33, ami49, n10, n30, n50, n100, n200, n300). Higher alignment scores indicate better performance. The results show that FlexPlanner significantly outperforms all baselines, achieving substantially higher alignment scores across all circuits.
read the caption
Table 2: Alignment score comparison among baselines and our method. The higher the alignment score, the better, and the optimal results are shown in bold. C/M means Circuit/Method.

🔼 This table compares the alignment scores achieved by FlexPlanner against several baseline methods across different benchmark circuits. Higher alignment scores indicate better performance in aligning blocks across multiple dies in 3D floorplanning. The ‘C/M’ column represents the Circuit/Method combination.
read the caption
Table 2: Alignment score comparison among baselines and our method. The higher the alignment score, the better, and the optimal results are shown in bold. C/M means Circuit/Method.

🔼 This table compares the alignment scores achieved by FlexPlanner against several baseline methods across different benchmark circuits. Higher alignment scores indicate better performance. The table highlights that FlexPlanner significantly outperforms the baselines in terms of achieving higher alignment scores, indicating improved accuracy in aligning blocks across multiple dies in 3D floorplanning.
read the caption
Table 2: Alignment score comparison among baselines and our method. The higher the alignment score, the better, and the optimal results are shown in bold. C/M means Circuit/Method.

🔼 This table compares the alignment scores achieved by FlexPlanner against several baseline methods across different benchmark circuits. The alignment score is a metric indicating the quality of cross-die module alignment in 3D floorplanning; higher scores represent better alignment. The table shows that FlexPlanner significantly outperforms the baselines, achieving much higher alignment scores in most cases. C/M indicates the abbreviation for Circuit/Method.
read the caption
Table 2: Alignment score comparison among baselines and our method. The higher the alignment score, the better, and the optimal results are shown in bold. C/M means Circuit/Method.

🔼 This table presents the ablation study results on the n100 benchmark circuit. It shows the impact of different components on the model’s performance, including the asynchronous layer decision mechanism, the multi-modality representation (vision, graph, sequence), and reward functions. Each row shows the results for different model variations by removing or changing a specific component. The results are measured by alignment score and HPWL (Half Perimeter Wire Length).
read the caption
Table 5: Ablation study on n100. sync: synchronous die-by-die placing. w/o aln: remove alignment mask in vision modality. w/o seq: remove sequence modality. w/o graph: remove graph modality. sparse rew: the same reward as GraphPlace [26]. diff rew: the same reward as MaskPlace [28].
🔼 This table compares the alignment scores achieved by FlexPlanner against several baseline methods across various benchmark circuits. A higher alignment score indicates better performance, with the best result for each circuit shown in bold. The table allows for a direct comparison of FlexPlanner’s alignment capabilities against existing approaches.
read the caption
Table 2: Alignment score comparison among baselines and our method. The higher the alignment score, the better, and the optimal results are shown in bold. C/M means Circuit/Method.
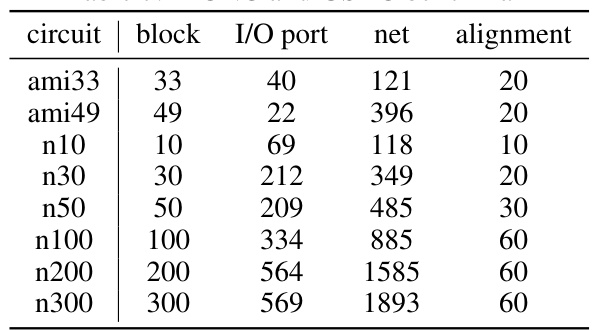
🔼 This table presents the characteristics of the MCNC and GSRC benchmark circuits used in the experiments. For each circuit, it lists the number of blocks, I/O ports, nets, and the number of alignment pairs (blocks that need to be aligned across dies in 3D floorplanning). This information helps understand the complexity and size of the test instances.
read the caption
Table 7: MCNC and GSRC benchmark

🔼 This table compares the alignment scores achieved by FlexPlanner against several baseline methods across various benchmark circuits. Higher alignment scores indicate better performance. The table highlights FlexPlanner’s superior performance, showcasing significant improvements in alignment compared to the baselines.
read the caption
Table 2: Alignment score comparison among baselines and our method. The higher the alignment score, the better, and the optimal results are shown in bold. C/M means Circuit/Method.

🔼 This table compares the alignment scores achieved by different floorplanning methods (including baselines and the proposed FlexPlanner) on various benchmark circuits. A higher alignment score indicates better alignment of blocks across multiple dies, which is crucial for 3D chip design. The results highlight the superior performance of FlexPlanner in achieving high alignment scores compared to existing methods.
read the caption
Table 2: Alignment score comparison among baselines and our method. The higher the alignment score, the better, and the optimal results are shown in bold. C/M means Circuit/Method.
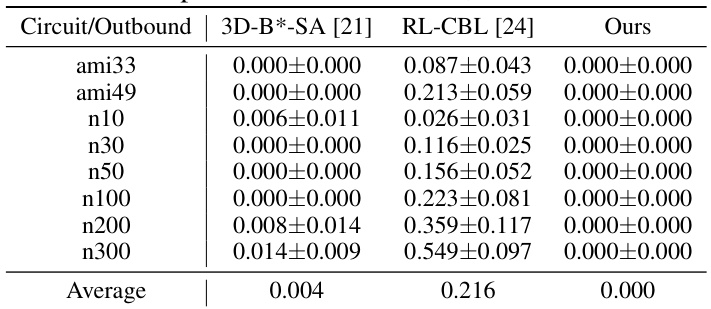
🔼 This table compares the alignment scores achieved by different floorplanning methods (including the proposed FlexPlanner and several baselines) on various benchmark circuits. A higher alignment score indicates better performance in aligning blocks across different layers or dies in a 3D integrated circuit (3D IC). The table highlights the superior alignment performance of FlexPlanner compared to the other methods.
read the caption
Table 2: Alignment score comparison among baselines and our method. The higher the alignment score, the better, and the optimal results are shown in bold. C/M means Circuit/Method.

🔼 This table compares the alignment scores achieved by FlexPlanner and several baseline methods across different benchmark circuits. The alignment score is a metric indicating the quality of alignment between blocks that need to be aligned across multiple dies in a 3D chip design. Higher scores indicate better alignment. The table shows that FlexPlanner significantly outperforms all baseline methods, achieving much higher alignment scores.
read the caption
Table 2: Alignment score comparison among baselines and our method. The higher the alignment score, the better, and the optimal results are shown in bold. C/M means Circuit/Method.

🔼 This table presents the results of an ablation study conducted on circuit n100 to evaluate the impact of different grid sizes on the model’s performance. The metrics considered include alignment score, half-perimeter wire length (HPWL), overlap, runtime, and area error. The results show that while higher grid sizes tend to produce more accurate results, they also significantly increase runtime. Therefore, the choice of grid size involves a trade-off between accuracy and efficiency.
read the caption
Table 12: The influence of different grid size on circuit n100.

🔼 This table compares the alignment scores achieved by FlexPlanner and several baseline methods across different benchmark circuits. The alignment score is a metric reflecting how well cross-die modules are aligned, with higher scores indicating better alignment. The table shows that FlexPlanner significantly outperforms the baselines in terms of alignment score.
read the caption
Table 2: Alignment score comparison among baselines and our method. The higher the alignment score, the better, and the optimal results are shown in bold. C/M means Circuit/Method.
Full paper#


