↗ OpenReview ↗ NeurIPS Homepage ↗ Chat
TL;DR#
Out-of-distribution (OOD) detection is crucial for machine learning systems, particularly in safety-critical applications. Existing OOD detection methods using vision-language models (VLMs) often suffer from limitations like relying on fixed, limited semantic pools for OOD label selection. This can lead to poor performance because the selected OOD labels may not adequately capture the diversity of OOD samples.
This paper proposes a novel approach called Conjugated Semantic Pool (CSP) to address this. CSP expands the semantic pool by adding modified superclass names, which serve as cluster centers for samples with similar properties across different categories. This approach addresses the issues of synonym redundancy and insufficient coverage of OOD label space. By mathematically modeling the performance of the existing pipeline and the enhanced pipeline with CSP, this paper demonstrates the superior efficacy of the proposed method, which achieves considerable performance gains, notably a 7.89% improvement in FPR95 compared to the state-of-the-art method.
Key Takeaways#
Why does it matter?#
This paper is crucial for researchers in OOD detection because it provides a novel theoretical framework and a practical method to improve the performance of zero-shot OOD detection using pre-trained vision-language models. The conjugated semantic pool (CSP) method offers a significant improvement over existing methods, opening avenues for future research. This work is particularly relevant given the growing use of VLMs in OOD detection and the ongoing quest to handle the challenges of real-world OOD data.
Visual Insights#

This figure shows the FPR50 and FPR95 performance of the proposed method (CSP) and the baseline method (NegLabel) on the ImageNet-1k OOD detection benchmark. The x-axis represents the ratio of selected OOD labels (r), indicating the proportion of OOD labels selected from the total semantic pool. The y-axis shows the FPR50 and FPR95 values. Lower values on the y-axis are better, representing improved OOD detection performance. The results demonstrate a U-shaped curve, initially decreasing as the ratio increases, reaching a minimum at a certain ratio, then increasing afterward. This trend aligns with the theoretical analysis presented in the paper, indicating that an optimal ratio of selected OOD labels exists for maximizing the OOD detection performance.

This table presents a comparison of the Area Under the Receiver Operating Characteristic curve (AUROC) and False Positive Rate at 95% True Positive Rate (FPR95) for various OOD detection methods. The methods are categorized into traditional visual OOD detection methods and methods leveraging pre-trained vision-language models (VLMs). The table shows the performance of each method across four different OOD datasets (iNaturalist, SUN, Places, and Textures) and an average performance across all four datasets. The results highlight the improvement achieved by the proposed method (Ours) compared to existing state-of-the-art methods, especially in terms of FPR95.
In-depth insights#
Semantic Pool Boost#
A ‘Semantic Pool Boost’ in a research paper likely refers to methods enhancing the performance of semantic pools used in tasks like zero-shot out-of-distribution (OOD) detection. This likely involves expanding the pool beyond a simple lexicon, perhaps by incorporating synonyms or related terms which increases the diversity of features considered. A crucial aspect would be managing the trade-off between increased pool size and potential redundancy. Sophisticated methods might introduce techniques to address the problem of highly correlated or overlapping semantic representations within the boosted pool, maintaining independence among features. The impact assessment would focus on metrics such as FPR95 and AUROC, demonstrating a tangible improvement in the ability to identify out-of-distribution data. A successful semantic pool boost would likely be supported by a robust theoretical framework justifying the chosen expansion strategy and quantifying its effect on the overall detection accuracy.
CSP: OOD Clusters#
The heading ‘CSP: OOD Clusters’ suggests an analysis of how a Conjugated Semantic Pool (CSP) facilitates out-of-distribution (OOD) detection by forming clusters of OOD samples. The core idea is that the CSP, unlike traditional methods, doesn’t rely on selecting OOD labels from existing lexicons. Instead, it leverages modified superclass names that act as cluster centers for samples sharing similar properties across different categories. This approach addresses limitations of expanding the semantic pool simply by using a larger lexicon, which often introduces numerous synonyms and uncommon words without improving OOD detection accuracy. By creating these OOD clusters, the CSP increases the probability of activating relevant OOD labels while maintaining low mutual dependence among them, aligning with the theoretical framework established in the paper. The effectiveness of this approach is likely demonstrated through improved performance metrics like FPR95 (False Positive Rate at 95% True Positive Rate), showcasing the CSP’s ability to improve the accuracy of classifying data points as in-distribution or out-of-distribution.
Lexicon Limits#
The heading ‘Lexicon Limits’ suggests an exploration of the constraints and shortcomings when relying solely on existing lexicons for tasks like out-of-distribution (OOD) detection. A thoughtful analysis would delve into the inherent limitations of pre-defined word lists. Firstly, lexicons may lack sufficient coverage of the nuanced vocabulary associated with OOD samples. Secondly, synonyms and near-synonyms create ambiguity and redundancy, hindering the discriminative power of the lexicon. This redundancy violates independence assumptions crucial for some statistical models, making it difficult to accurately classify samples. Thirdly, a simple lexicon expansion by adding more words might introduce numerous uncommon words with low activation probabilities, ultimately decreasing overall performance. Therefore, exploring alternatives to using standard lexicons, like creating a conjugated semantic pool with modified superclass names, becomes essential to address these ‘Lexicon Limits’ and improve OOD detection accuracy. The section would likely present empirical evidence to support the identified issues and showcase the benefits of alternative methods that overcome the inadequacies of the lexicon-only approach. This would then lead to a more robust and effective OOD detection system.
Theoretical Model#
A theoretical model in a research paper serves as a crucial tool to formalize assumptions and predict system behavior. In the context of out-of-distribution (OOD) detection, a strong theoretical model helps quantify performance, guiding the design and analysis of new methods. A good model should capture key variables, including the size and characteristics of the semantic pool, activation probabilities, and dependence between labels. It should explain observed trends, such as the inverted-V relationship between performance and the ratio of selected OOD labels, which might be counterintuitive. This is essential for designing effective methods, as it helps identify the critical factors to manipulate for better performance. The model also helps highlight limitations and potential areas for future research by providing a framework for testing the impact of different variables and identifying sources of error. A robust theoretical model acts as a foundation that strengthens the overall credibility and impact of the research.
Future: CSP Enhance#
Enhancing the Conjugated Semantic Pool (CSP) for improved out-of-distribution (OOD) detection involves several key considerations. Expanding the superclass names within the CSP could improve coverage of diverse OOD samples, but careful selection is crucial to avoid redundancy and maintain independence between activations. Developing more sophisticated similarity metrics beyond simple text-image alignment could better capture nuanced relationships, leading to more accurate OOD classification. Incorporating feature space analysis to understand the distribution of CSP labels compared to in-distribution ones can guide further refinements and address potential overlaps. Furthermore, investigating different VLM architectures and their inherent biases, and exploring techniques to mitigate the effects of those biases, may significantly improve overall performance. Finally, incorporating uncertainty estimation into the CSP approach could provide more nuanced and reliable OOD detection, allowing for a more cautious approach in uncertain cases.
More visual insights#
More on figures

This figure shows the impact of lexicon size on the performance of the OOD detection model, measured by FPR95. The results indicate that simply increasing the size of the lexicon used to construct the semantic pool does not guarantee improved performance. There is an optimal lexicon size; going beyond it leads to performance degradation. Table 9 provides detailed numerical results supporting these findings.

This figure illustrates how the Conjugated Semantic Pool (CSP) is constructed. It shows that general category names (like ‘Cat’) in the original semantic pool represent cluster centers for similar images. The CSP expands on this by using modified superclass names (e.g., ‘White Creature’) as cluster centers, encompassing samples with similar properties across different categories. This broader approach aims to improve the representation of out-of-distribution (OOD) samples.

This figure shows the performance of the proposed method (CSP) and the baseline method (NegLabel) on the ImageNet-1k OOD detection benchmark. The performance is measured using FPR50 and FPR95 metrics. The x-axis represents the ratio (r) of selected OOD labels, showing how the performance changes as more OOD labels are selected. The results show that both methods initially improve in performance as more labels are included, reaching an optimal point before decreasing. The CSP method consistently outperforms NegLabel.

This figure shows the performance of the proposed method (CSP) and the baseline method (NegLabel) across different ratios of selected OOD labels (r). The x-axis represents the ratio r, and the y-axis represents the FPR50 and FPR95 values. A lower value indicates better performance. The results show that both methods exhibit an inverted-V shaped curve, initially improving and then worsening as r increases, demonstrating the existence of an optimal ratio for OOD label selection. The CSP consistently outperforms NegLabel, showcasing its effectiveness.

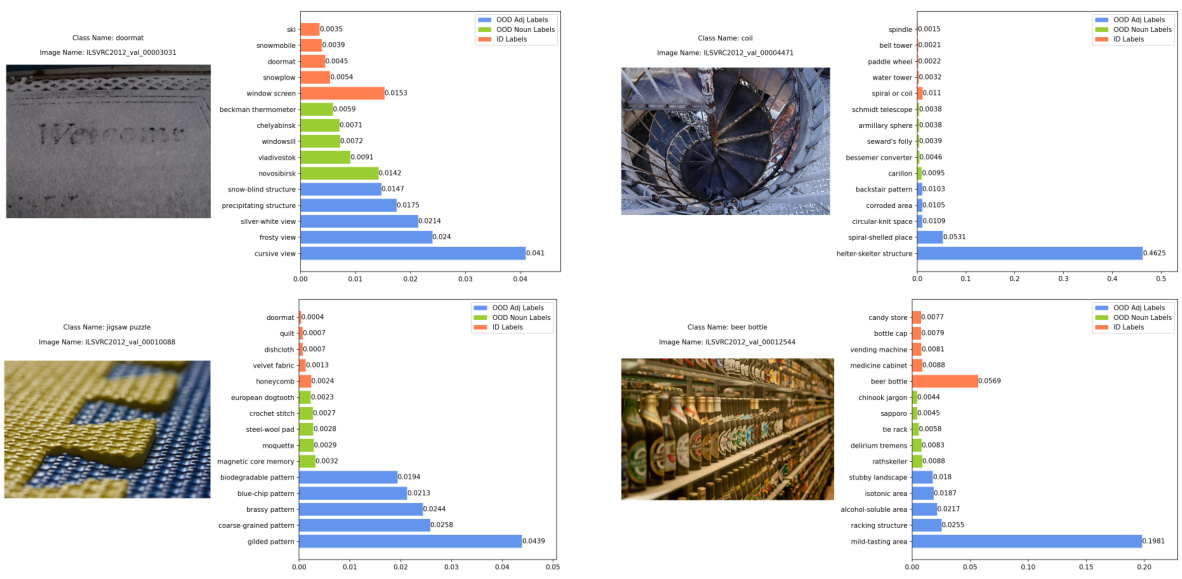
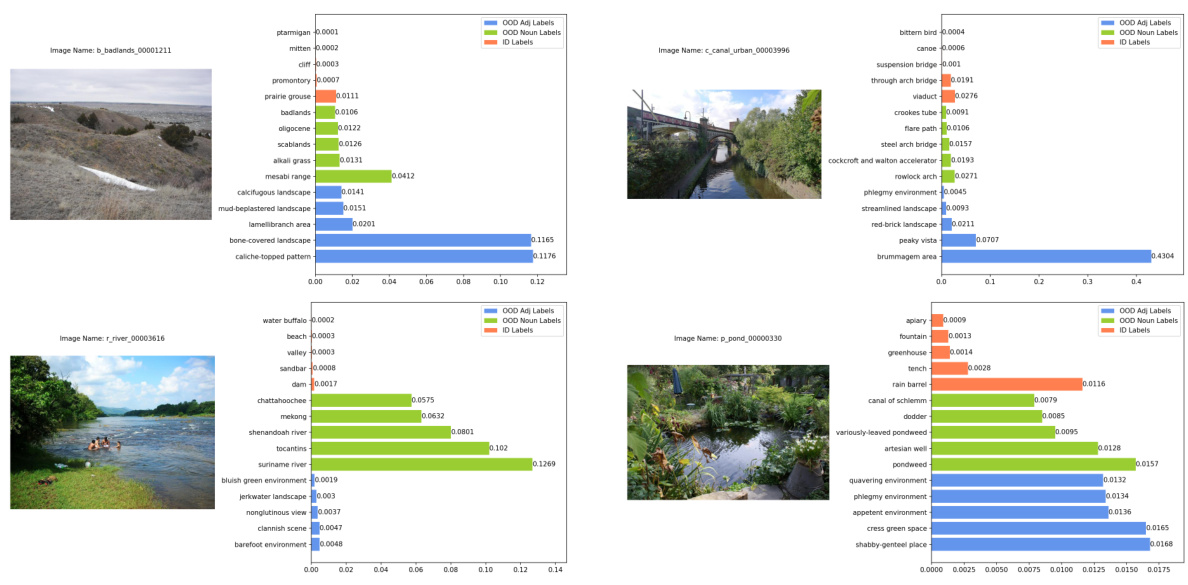
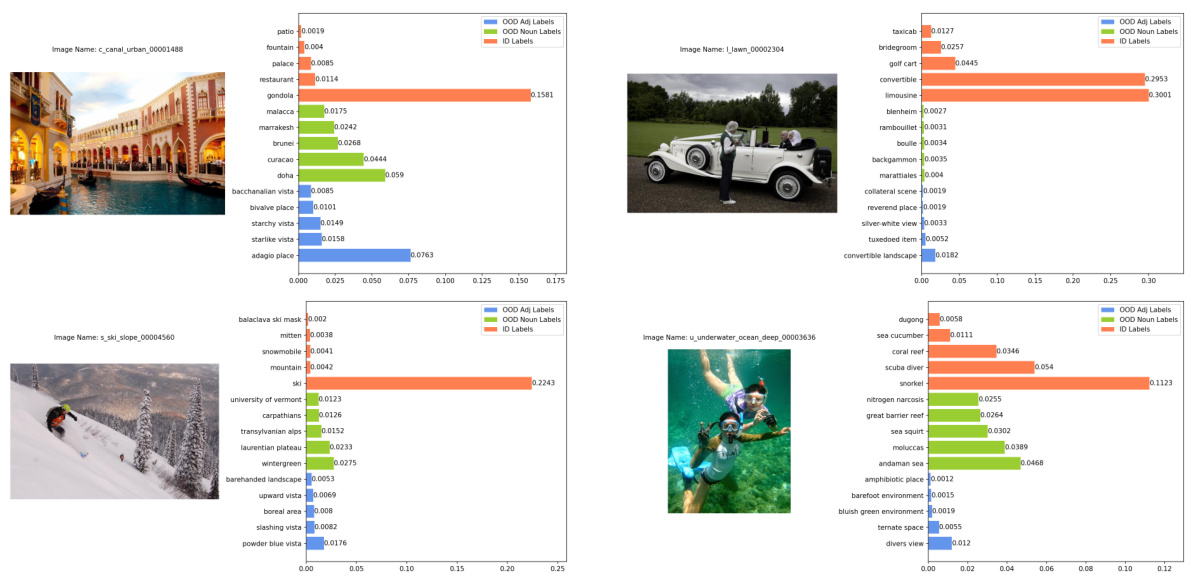
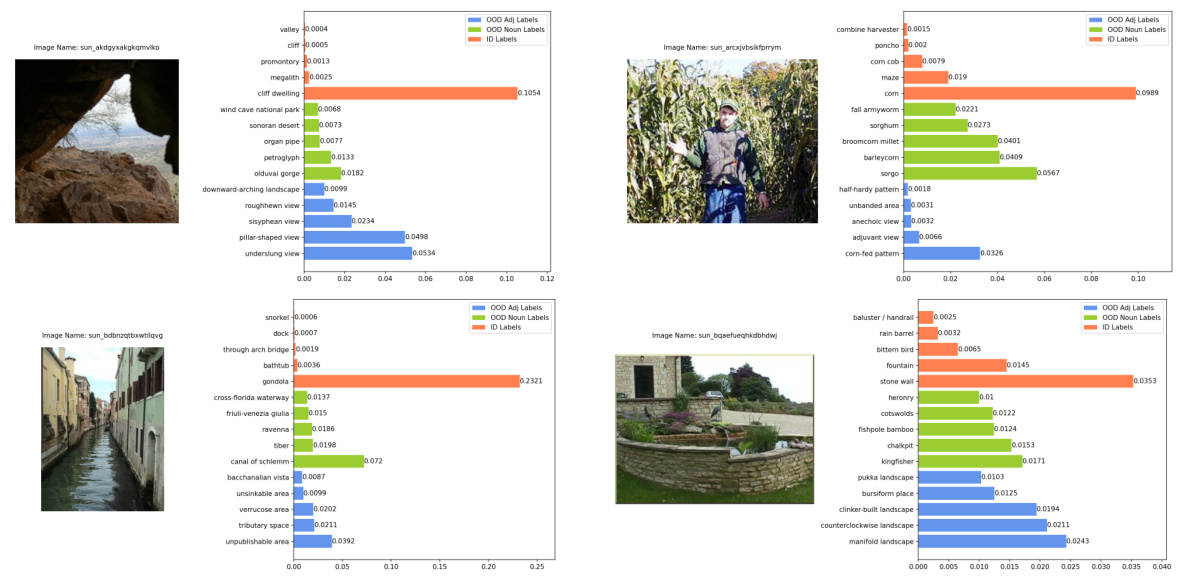
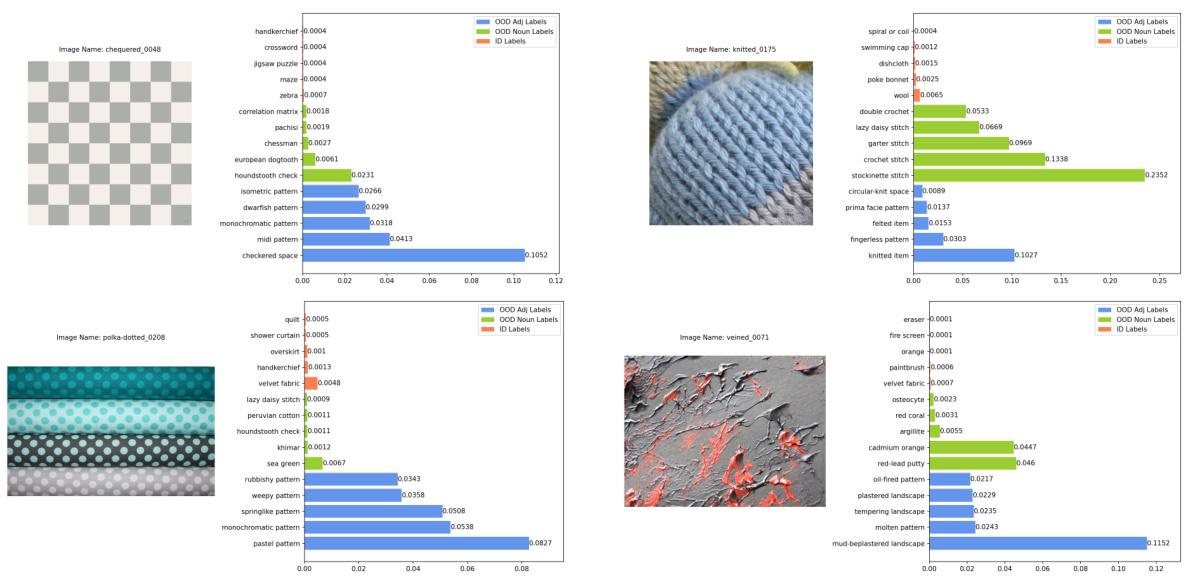
This figure shows four examples of in-distribution (ID) images that were correctly classified as ID with high confidence. Each example includes the image itself, the ground truth label, the image name, and a bar chart showing the top 5 softmax scores from the vision language model. The bars are color coded to indicate if the predicted label came from the ID labels, the original OOD semantic pool, or the conjugated semantic pool.

This figure shows the performance of the proposed method (CSP) and the baseline method (NegLabel) on the ImageNet-1k OOD detection benchmark. The performance is measured using FPR50 and FPR95, where lower values indicate better performance. The x-axis represents the ratio (r) of selected OOD labels in the semantic pool. The figure demonstrates an inverted-V shaped curve, where the performance initially decreases and then increases as r increases, which aligns with the theoretical analysis presented in the paper. The results suggest that the proposed method outperforms NegLabel across various ratios of selected OOD labels.
This figure shows the performance of the proposed method (CSP) and the baseline method (NegLabel) on the ImageNet-1k OOD detection benchmark, evaluated using FPR50 and FPR95 metrics. The x-axis represents the ratio (r) of selected OOD labels, and the y-axis represents the performance (lower is better). The figure illustrates that both methods exhibit an inverted-V shaped performance curve as the ratio of selected OOD labels increases. The CSP method consistently outperforms the NegLabel method across different ratios.

This figure shows the performance comparison between the proposed method and NegLabel using two metrics, FPR50 and FPR95, on the ImageNet-1k OOD detection benchmark. The x-axis represents the ratio of selected OOD labels (r), and the y-axis represents the FPR values. The results indicate that both methods initially show performance improvement followed by performance degradation as r increases. The proposed method consistently outperforms NegLabel across various ratios of r. The figure highlights the relationship between the performance and the proportion of selected OOD labels in the semantic pool, which is a key aspect of the paper’s theoretical analysis.

The figure shows the performance of the proposed method (CSP) and the baseline method (NegLabel) in terms of FPR50 and FPR95 across different ratios (r) of selected OOD labels. The x-axis represents the ratio of selected OOD labels, and the y-axis represents the performance metric (FPR50 and FPR95). A lower value indicates better performance. The figure demonstrates that both methods show an inverted-U shaped curve, initially improving with increasing r and then degrading as r continues to increase. The CSP method consistently outperforms NegLabel across all r values.
This figure shows the performance of the proposed method (CSP) and the baseline method (NegLabel) in terms of FPR50 and FPR95 on the ImageNet-1k benchmark. The x-axis represents the ratio (r) of selected OOD labels, illustrating how the model performance changes as more OOD labels are included. The results show that both methods initially improve in performance with increasing r, reaching a peak, before performance decreases. CSP consistently outperforms NegLabel across various ratios.
This figure shows the performance of the proposed method (CSP) and the baseline method (NegLabel) on the ImageNet-1k OOD detection benchmark, evaluated using FPR50 and FPR95. The x-axis represents the ratio (r) of selected OOD labels in the semantic pool. The y-axis represents the performance metric (FPR50 or FPR95; lower values indicate better performance). The figure demonstrates that both methods initially show improved performance as r increases, but after reaching a peak, the performance starts to decrease.

This figure shows the performance of the proposed method (CSP) and the baseline method (NegLabel) on the ImageNet-1k OOD detection benchmark. The performance is measured using FPR50 and FPR95 metrics, where lower values indicate better performance. The x-axis represents the ratio of selected OOD labels (r) in the semantic pool. The figure demonstrates that both methods initially improve performance as r increases, but then performance degrades. This aligns with the theoretical findings presented in the paper.
The figure shows the performance comparison between the proposed method and NegLabel based on FPR50 and FPR95 metrics. The performance is plotted against the ratio of selected OOD labels (r). The results demonstrate an initial decrease in error rates followed by a subsequent increase as the ratio increases. This inverted-V shaped trend supports the theoretical analysis in the paper, indicating an optimal ratio for best performance.
This figure shows the performance of the proposed method (CSP) and the baseline method (NegLabel) across different ratios (r) of selected OOD labels. The x-axis represents the ratio of selected OOD labels and the y-axis represents the FPR50 and FPR95. The results show that both methods exhibit a trend of initially decreasing performance, reaching a minimum point, and then increasing. The CSP method consistently outperforms NegLabel across all ratios.

The figure shows the performance of the proposed method (CSP) and the baseline method (NegLabel) on the ImageNet-1k OOD detection benchmark, evaluated using FPR50 and FPR95. The x-axis represents the ratio (r) of selected OOD labels, and the y-axis represents the performance metric (lower is better). The results show that both methods exhibit an inverted-U shaped curve, indicating that performance initially improves as the ratio increases, reaching a peak, and then decreases as more OOD labels are included. The CSP method consistently outperforms NegLabel across various ratios.
More on tables

This table presents the results of OOD detection experiments conducted on challenging datasets. The ‘hard’ aspect refers to the difficulty in distinguishing out-of-distribution (OOD) samples from in-distribution (ID) samples. The table compares three methods: MCM, NegLabel, and the proposed method (Ours). For each method, the AUROC (Area Under the Receiver Operating Characteristic curve) and FPR95 (False Positive Rate at 95% True Positive Rate) metrics are reported across various ID/OOD dataset pairings, where the ID dataset is drawn from ImageNet-10, ImageNet-20, ImageNet-100 or ImageNet-1k and the OOD dataset is drawn from ImageNet-20, ImageNet-10, ImageNet-100, ImageNet-O or Placesbg.

This table presents the ablation study, evaluating the impact of different components of the semantic pool on the overall performance. The rows represent different configurations of the semantic pool, including the original semantic pool, a simple addition of adjective labels, and the conjugated semantic pool (CSP). The columns show the AUROC and FPR95 metrics for four OOD datasets (iNaturalist, SUN, Places, and Textures), as well as an average across these datasets. This ablation study helps illustrate the contribution of the CSP to improving OOD detection performance.

This table compares the performance of various OOD detection methods on the ImageNet-1k benchmark. It shows the AUROC and FPR95 scores for different methods using the CLIP ViT-B/16 architecture, comparing traditional methods (MSP to VOS) with methods leveraging pre-trained VLMs (ZOC to NegLabel), and finally showing the proposed method. The comparison uses different OOD datasets (iNaturalist, SUN, Places, and Textures) to provide a comprehensive evaluation. The results illustrate the performance improvement of the proposed CSP method.

This table compares the expected softmax scores of a single OOD label from both the original and conjugated semantic pools. The scores are averaged across four OOD datasets (iNaturalist, SUN, Places, Textures) to approximate q2, representing the expected probability of OOD labels being activated by OOD samples. Higher scores indicate a greater likelihood of OOD label activation, illustrating the effectiveness of the conjugated semantic pool in improving OOD detection.

This table presents the mean and standard deviation of OOD detection performance across various random seeds. The experiment uses CLIP-B/16 on ImageNet-1k as the ID data. The results are broken down by OOD dataset (iNaturalist, SUN, Places, Textures) and performance metrics (AUROC and FPR95). This shows the stability and reproducibility of the proposed method across different runs.
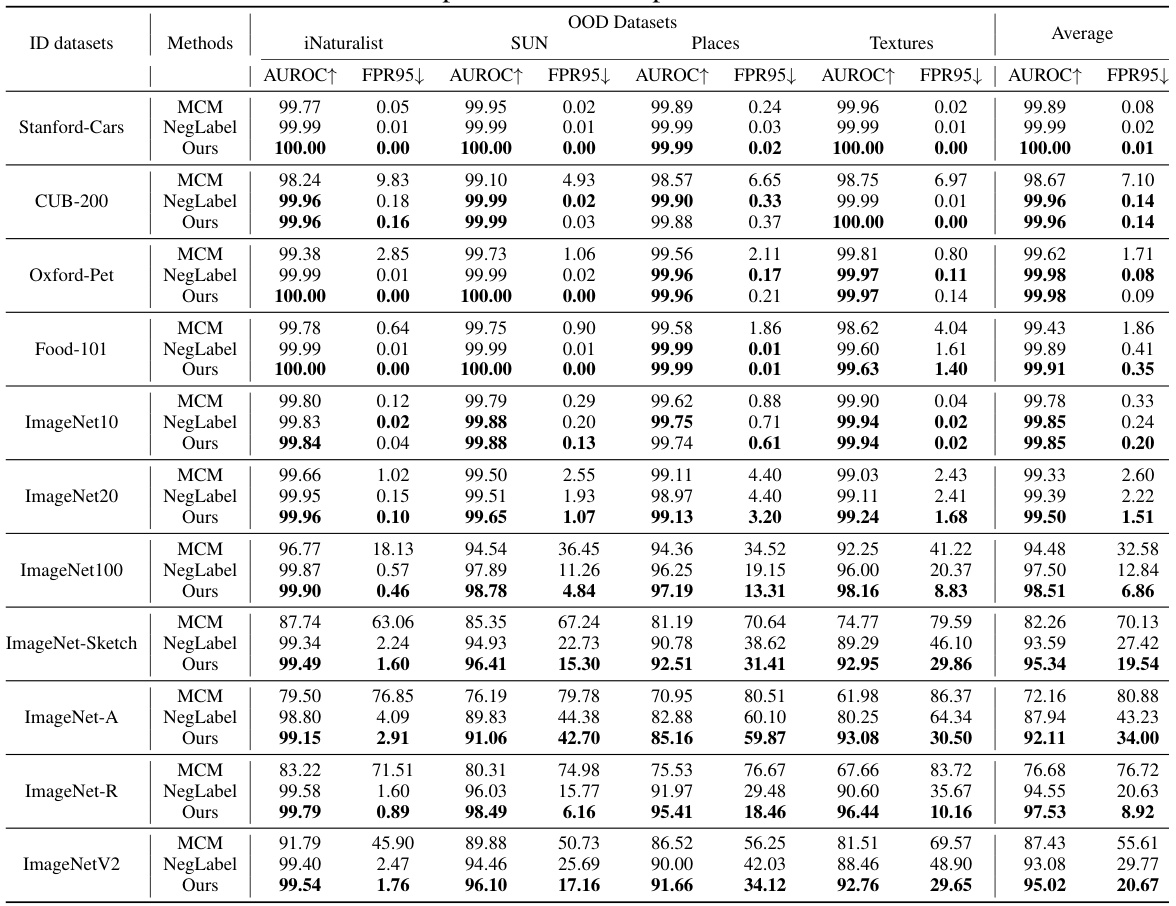
This table compares the performance of various OOD detection methods on the ImageNet-1k benchmark. It contrasts traditional methods (MSP, ODIN, Energy, GradNorm, ViM, KNN, VOS) with methods that leverage pre-trained Vision-Language Models (VLMs) like CLIP (ZOC, MCM, NPOS, CoOp, CoCoOp, CLIPN, LSN, NegLabel). The table presents the Area Under the Receiver Operating Characteristic curve (AUROC) and the False Positive Rate at 95% True Positive Rate (FPR95) for each method across four different OOD datasets: iNaturalist, SUN, Places, and Textures. Higher AUROC and lower FPR95 values indicate better performance.

This table presents the FPR95 performance of both the proposed method and the NegLabel baseline across different ratios (r) of selected OOD labels. The ratio r represents the proportion of OOD labels selected from the semantic pool. The table shows how the performance of both methods varies with this ratio, illustrating an initial improvement followed by a decline, which aligns with the theoretical analysis in the paper.

This table compares the performance of different OOD detection methods on the ImageNet-1k benchmark. It specifically focuses on methods using the CLIP ViT-B/16 architecture with ImageNet-1k as the in-distribution (ID) dataset. The table shows AUROC and FPR95 scores for various out-of-distribution (OOD) datasets (iNaturalist, SUN, Places, Textures), providing a comprehensive comparison of different approaches. Higher AUROC and lower FPR95 values indicate better performance. The methods are categorized into traditional visual OOD detection methods and methods leveraging pre-trained VLMs, highlighting the improvement achieved by incorporating textual information.

This table shows the mean and standard deviation of the Area Under the Receiver Operating Characteristic curve (AUROC) and the False Positive Rate at 95% true positive rate (FPR95) across 10 different random seeds. The results are presented for four different OOD datasets (iNaturalist, SUN, Places, Textures) and the average performance across these datasets. The table demonstrates the robustness and stability of the proposed method by showing the small standard deviation across the runs.
Full paper#


