↗ OpenReview ↗ NeurIPS Homepage ↗ Chat
TL;DR#
Large Language Models (LLMs) are expensive to run, so researchers are always looking for ways to compress them to make them smaller and faster. Traditionally, researchers have relied on accuracy metrics such as how well a compressed model performs on a benchmark, to measure how well the compression works. This paper shows that relying only on accuracy is not sufficient. Even when accuracy changes are small, the compressed model may change its answers surprisingly often, even when the overall accuracy on a benchmark does not change much. This unexpected behavior is called “flips”. The authors propose to use two other metrics to evaluate model compression: percent flips and KL-divergence. They show that these metrics correlate highly with each other and with how well the compressed model performs on a multi-turn dialogue task, which demonstrates a more realistic use case for LLMs.
The paper’s main contribution is showing that accuracy alone is not enough to evaluate LLM compression. It introduces new metrics, % flips and KL-divergence, and demonstrates their usefulness in evaluating the quality of compression techniques. The authors argue that % flips is especially valuable because it is an intuitive measure of how different a compressed model is from the original model and it is as easy to compute as accuracy. This is important because it helps to ensure that the compressed models are truly comparable to the original models, something that is not always clear when just looking at accuracy.
Key Takeaways#
Why does it matter?#
This paper is crucial because it challenges the common practice of solely relying on accuracy metrics to evaluate compressed LLMs. It highlights the limitations of accuracy in revealing significant behavioral changes in compressed models, a problem previously overlooked. The proposed alternative metrics, % flips and KL-Divergence, provide more comprehensive insights for researchers, ultimately improving the reliability and effectiveness of model compression techniques. This work also opens up new avenues for research in evaluating free-form text generation models and model compression in general, areas of growing importance in the field.
Visual Insights#

This figure displays the results of six different quantization schemes applied to large language models (LLMs). The x-axis represents the change in accuracy compared to a baseline 16-bit model across several benchmark tasks. The y-axis shows the percentage of ‘flips,’ which are instances where the model changes its answer from correct to incorrect or vice-versa. The key finding is that while the accuracy remains largely unchanged by the quantization, the number of flips increases significantly for all quantization schemes except GPTQ W8A16. This illustrates that seemingly small accuracy differences can mask substantial changes in model behavior as perceived by the user.

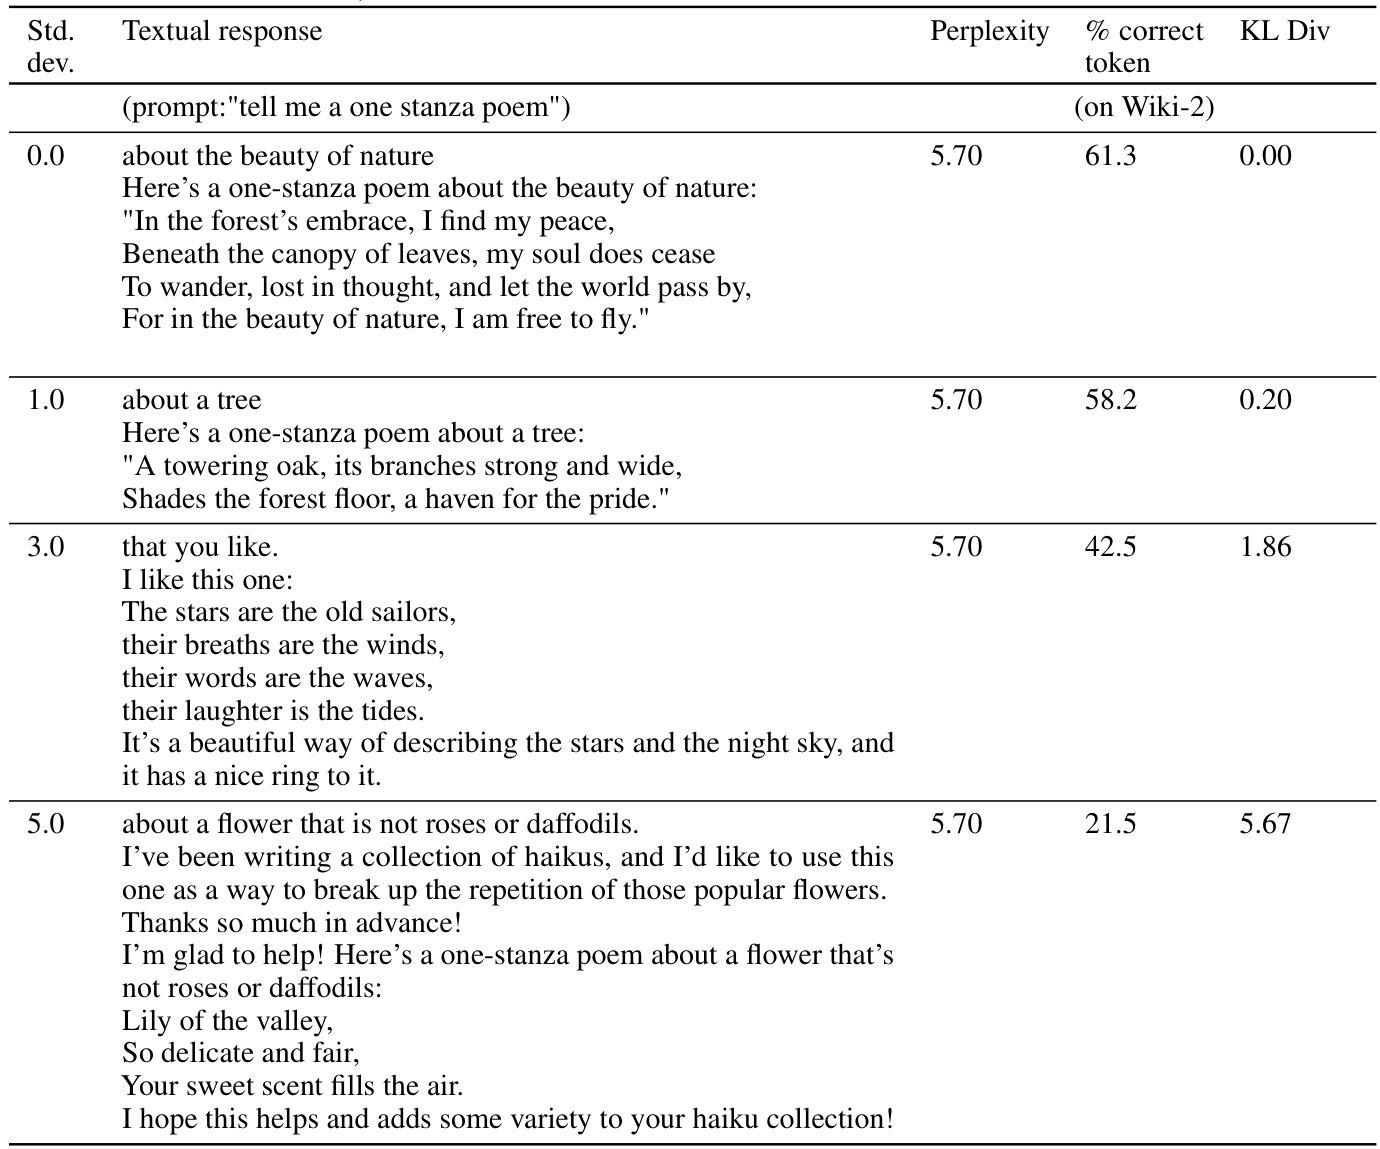
This table demonstrates that adding Gaussian noise to the model weights leads to a similar number of transitions from correct to incorrect answers and from incorrect to correct answers, while maintaining the overall model accuracy relatively unchanged. This finding highlights how adding noise to a model’s weights can mimic the behavior of model compression techniques.
In-depth insights#
LLM Compression Gaps#
The concept of “LLM Compression Gaps” highlights the discrepancies between a model’s performance metrics (like accuracy) and its actual behavior after compression. While compression techniques might maintain high accuracy on standard benchmarks, they often introduce subtle changes that significantly alter the model’s output. These gaps aren’t captured by traditional metrics and reveal the limitations of solely relying on accuracy for evaluating compressed LLMs. The key insight is that seemingly small accuracy differences can mask substantial qualitative shifts in the model’s responses. This necessitates the exploration of more comprehensive evaluation metrics beyond accuracy alone, emphasizing the need to assess the semantic similarity and overall quality of the outputs, especially for free-form generation tasks where nuanced and correct answers are critical. Ultimately, understanding and addressing these “LLM Compression Gaps” is crucial for creating reliable and efficient compressed models suitable for real-world applications.
Beyond Accuracy#
The concept of “Beyond Accuracy” in evaluating large language models (LLMs) highlights the limitations of using accuracy alone as a comprehensive metric. Accuracy, while important, fails to capture the nuanced user experience and potential downstream impact of model changes. The paper argues that metrics like KL-Divergence and the percentage of answer ‘flips’ (where correct answers become incorrect and vice-versa) offer more insightful evaluations, especially concerning compressed models. These alternative metrics reveal significant model divergence from the baseline even when accuracy remains similar, indicating potential performance issues in free-form text generation tasks. Therefore, a more holistic assessment considers user experience and downstream task performance alongside traditional accuracy metrics for a complete picture of LLM quality.
Flip Phenomenon#
The “Flip Phenomenon”, observed in compressed Large Language Models (LLMs), is a crucial finding that challenges the over-reliance on accuracy metrics. It describes how, even when overall accuracy remains similar between a baseline and a compressed model, a significant proportion of individual answers unexpectedly change from correct to incorrect, or vice versa. This discrepancy highlights a critical limitation of solely using aggregate accuracy as an evaluation metric for compressed models. The phenomenon suggests that underlying model behavior can significantly change despite superficially similar accuracy scores. This calls for a more nuanced evaluation strategy. The research emphasizes the importance of incorporating distance metrics, such as KL-Divergence and the percentage of flips, to better capture the qualitative differences in model behavior. These metrics offer a more comprehensive assessment of compressed models, improving our understanding of model compression’s true impact.
Distance Metrics#
The concept of ‘Distance Metrics’ in evaluating compressed Large Language Models (LLMs) is crucial because accuracy alone is insufficient. Traditional metrics like accuracy and perplexity fail to capture the nuanced changes in model behavior caused by compression techniques. Distance metrics, such as KL-divergence and the percentage of “flips” (correct answers changing to incorrect, and vice-versa), offer a more comprehensive evaluation. They directly address the underlying shifts in the model’s probability distributions, revealing significant divergences even when accuracy remains relatively stable. This is particularly important for downstream applications where subtle changes can have a major impact. The introduction of such metrics is vital for a more thorough and user-centric assessment of LLM compression, shifting the focus from aggregate performance to a detailed understanding of how the model behaves.
Future Directions#
Future research could explore more sophisticated distance metrics beyond KL-divergence and % flips to better capture subtle differences in model behavior. Investigating the impact of compression on specific downstream tasks is crucial, moving beyond generic benchmarks to assess real-world performance. Developing standardized evaluation frameworks would greatly benefit the field, promoting more robust and comparable results across various compression techniques. Furthermore, research should delve into the connection between model architecture and compression effectiveness, tailoring methods to specific model designs. Finally, exploring the trade-offs between compression ratio, performance, and the qualitative aspects of model outputs is needed for a holistic understanding. Addressing the inherent limitations of current benchmarks is crucial, aiming to create more comprehensive and robust evaluations of compressed LLMs. In essence, a multi-faceted approach is necessary to fully understand the effects of compression on LLMs.
More visual insights#
More on figures

This figure displays the correlation between the percentage of flips and KL-Divergence across various model-quantization combinations. It shows that as the percentage of flips increases, KL-Divergence also increases, indicating a strong positive correlation between the two metrics. This is true across three different tasks (ARC-Easy, ARC-Challenge, and MMLU 5-shot). The high correlation suggests that the flips metric can be used as a proxy for the KL-Divergence metric, which is more computationally expensive to calculate. Each point on the graph represents a different model and quantization technique, as detailed in Table 4 of the paper.

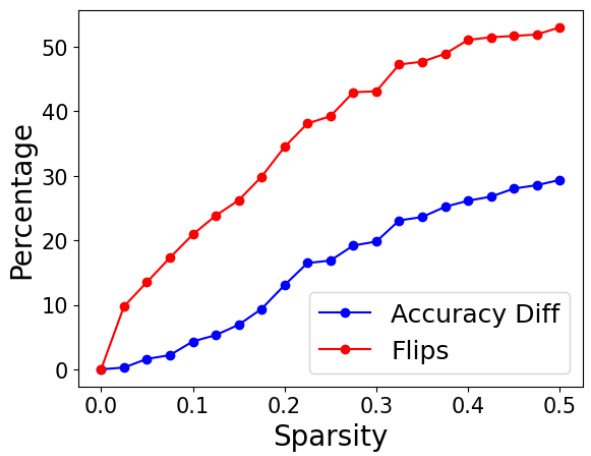
This figure shows the accuracy difference and percentage of flips for two different LLMs compression techniques, namely, layer dropping and WANDA pruning, on the MMLU 5-shot task. The x-axis represents the fraction of layers dropped or sparsity, while the y-axis shows the percentage change in accuracy and the percentage of flips. The plot demonstrates that even when there is negligible change in accuracy (as measured by the difference from the baseline), there is a steady increase in the number of flips as the number of layers dropped or sparsity increases. This finding highlights that accuracy alone might not be sufficient to evaluate the quality of compressed models.

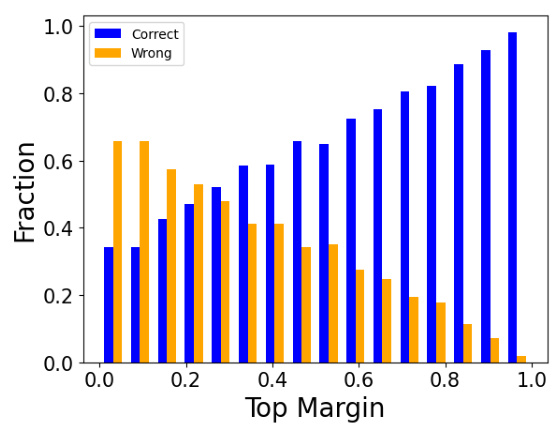
This figure shows the relationship between the probability of an answer changing (i.e., flipping from correct to incorrect or vice versa) and the top margin of the model’s prediction for a given question. The top margin is defined as the difference in probability between the most probable answer and the second most probable answer. The figure demonstrates that when the top margin is low (indicating low confidence in the model’s prediction), there is a greater chance that the answer will change after quantization. The result is consistent across several LLMs and benchmarks.
This figure shows the relationship between the change in prediction probability and the baseline top margin for the MMLU 5-shot benchmark. The x-axis represents the baseline top margin, while the y-axis shows the absolute difference in prediction probability between the quantized and baseline models for each answer choice. The BnB W4A4 quantization scheme was used. The results demonstrate that the change in prediction probability is more significant when the baseline top margin is low. This observation remains consistent across different quantization schemes, indicating a correlation between prediction confidence and the likelihood of answer changes during quantization.

This figure compares the correlation between the percentage of flips (a metric indicating changes in answers from correct to incorrect or vice versa) and the difference in MT-Bench scores (a multi-turn dialogue task evaluating free-form text generation capabilities). The left subplot shows a strong negative correlation between flips and MT-Bench scores for Llama2-70b and Yi-34b chat models. The right subplot indicates a weaker positive correlation between accuracy difference and MT-Bench scores. This suggests that flips are a more reliable indicator of downstream task performance compared to just accuracy differences.

This figure shows the results of six different quantization schemes applied to four different large language models (LLMs) across seven benchmark tasks. The key finding is that while the change in accuracy between the baseline (16-bit) models and the quantized models is minimal (almost negligible), there is a significant number of ‘flips.’ Flips refer to instances where a correct answer from the baseline model becomes incorrect in the quantized model, and vice versa. The only exception to this trend is the GPTQ W8A16 scheme. This highlights a critical limitation of using accuracy alone as a metric for evaluating LLM compression techniques, as it masks the significant divergence in model behavior revealed by the high number of flips. The figure visually represents this divergence, suggesting that using only accuracy as an evaluation metric can be misleading.

This figure shows the relationship between the change in prediction probability and the baseline top margin for the MMLU 5-shot benchmark. The x-axis represents the baseline top margin, which is the difference between the highest and second-highest probabilities assigned to answer choices. The y-axis represents the absolute difference in prediction probabilities between the quantized model and the baseline model, summed across all answer choices. The figure uses the BnB W4A4 quantization scheme, but the trend holds across other quantization schemes as well. It demonstrates that when the baseline top margin is low (indicating less model certainty), the change in prediction probabilities is higher, suggesting a greater impact from quantization.
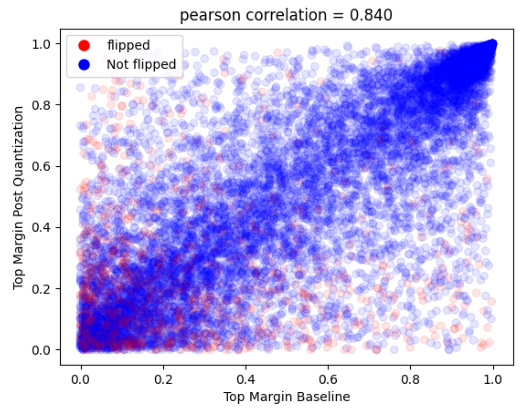
This figure shows the relationship between the change in prediction probability of multiple-choice answers and the baseline top margin in the MMLU 5-shot benchmark after applying BnB W4A4 quantization. The x-axis represents the baseline top margin, and the y-axis represents the absolute difference in prediction probabilities between the baseline and quantized models. The plot indicates a strong correlation between a low baseline top margin and a larger change in prediction probabilities after quantization. This correlation is consistent across different quantization schemes.
The figure shows the relationship between sparsity, accuracy difference, and flips for the SliceGPT model. As sparsity increases, the accuracy difference remains relatively low, indicating that the model’s overall accuracy is preserved. However, the number of flips increases significantly, implying a considerable divergence in model behavior despite similar accuracy scores.

This figure shows the accuracy difference and percentage of flips for two model compression techniques: dropping the last n layers and WANDA pruning. The Llama2-13b model was used with the MMLU 5-shot benchmark. The key takeaway is that even when the accuracy remains similar to the baseline (16-bit model), the number of flips (changes from correct to incorrect answers and vice-versa) significantly increases as more layers are dropped or more sparsity is introduced using the pruning method. This highlights that accuracy alone might not be enough to evaluate compression techniques and other metrics, such as flips, are needed to capture the underlying differences in model behavior.
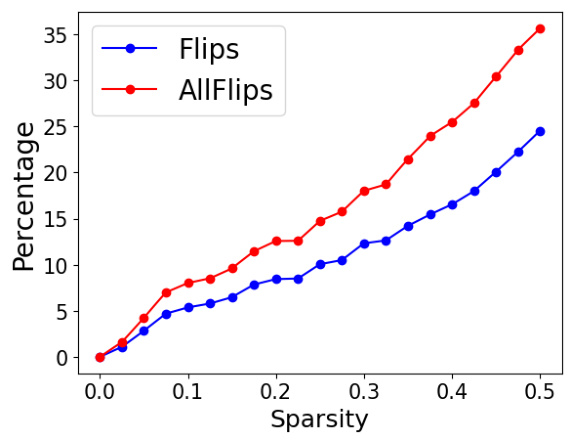
This figure shows the relationship between the sparsity of a model, resulting from the application of the SliceGPT compression technique, and two key metrics: accuracy difference and percentage of flips. The x-axis represents the sparsity level, ranging from 0 to 0.5, indicating the fraction of model parameters removed. The y-axis displays the percentage change in accuracy and the percentage of flips. The graph indicates that as sparsity increases, there is a gradual increase in the percentage of flips, even when the change in accuracy is relatively modest. This highlights the potential divergence between the original and compressed model’s behavior, even with similar accuracy scores.
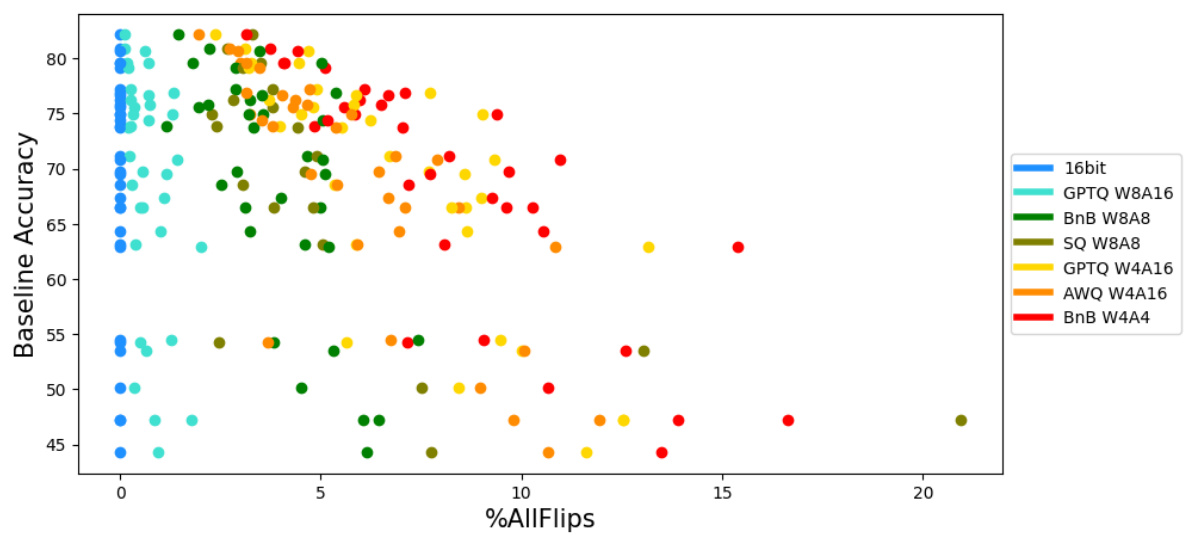
This figure displays the results of six different quantization schemes applied to four large language models (LLMs) across seven distinct tasks. The x-axis represents the percentage change in accuracy compared to a 16-bit baseline model, while the y-axis shows the baseline accuracy. Each point on the graph represents a specific model and quantization scheme combination applied to one of the tasks. The key finding is that, despite minimal changes in accuracy (most are within ±2%), there is a substantial increase in the percentage of ‘flips’ (instances where correct answers become incorrect, or vice-versa) for most of the quantization techniques, except GPTQ W8A16. This suggests that while the overall accuracy might be similar, the compressed models behave considerably differently from the original model at the granular answer level.

This figure shows the correlation between two distance metrics: the percentage of flips and the KL divergence. Each point represents a specific model and its corresponding quantization technique used in the study, as detailed in Table 4. The strong correlation observed suggests that the percentage of flips can serve as a useful proxy for KL divergence, a more computationally expensive metric. This finding supports the paper’s argument that the percentage of flips is a valuable metric for evaluating the quality of LLM compression.

This figure shows the results of six different quantization schemes applied to four large language models (LLMs) across seven different benchmark tasks. While the accuracy change compared to the baseline 16-bit models is negligible (within 2%), a significant number of ‘flips’ (changes in answers from correct to incorrect or vice versa) are observed for most quantization methods. This indicates that although overall accuracy remains similar, the underlying behavior of the compressed models significantly deviates from the baseline, highlighting the inadequacy of using accuracy alone as an evaluation metric.
More on tables

This table presents the MT-Bench average scores for various quantized models. MT-Bench evaluates the free-form text generation capabilities of large language models. The scores are averages across two turns in the benchmark, with GPT-4 acting as an automated judge. The table shows how different quantization techniques affect the overall performance of the models on the MT-Bench task, comparing them to the baseline 16-bit models. Lower scores indicate poorer performance in free-form text generation.

This table presents the average scores obtained from evaluating the performance of various quantized language models on the MT-Bench task. The evaluation was conducted using GPT-4 as an automated judge. The table shows the average scores for two turns in the MT-Bench benchmark, allowing for a comparison of model performance across different quantization techniques (BnB W8A8, GPTQ W8A16, SQ W8A8, GPTQ W4A16, AWQ W4A16, BnB W4A4) and various model sizes (Llama-2 7b chat, Llama-2 13b chat, Llama-2 70b chat, Yi-6b chat, Yi-34b chat). It demonstrates the impact of different compression techniques on the quality of free-form text generation in a multi-turn dialogue setting.

This table presents the results of evaluating the performance of different quantization schemes on the MMLU 5-shot task. It compares the accuracy and the percentage of ‘flips’ (instances where the model’s answer changes from correct to incorrect or vice versa) for various models (Llama2-7b chat, Llama2-13b chat, Llama2-70b chat, Yi-6b chat, and Yi-34b chat) using six different quantization schemes (BnB W8A8, GPTQ W8A16, SQ W8A8, GPTQ W4A16, AWQ W4A16, and BnB W4A4). A key observation is that while the accuracy change is minimal for most schemes, the flip percentage is significantly higher for most quantization techniques than the baseline, indicating that there are considerable differences in the output of these models despite similar accuracy numbers. The exception is GPTQ W8A16, which exhibits negligible flips.

This table presents the results of a zero-shot experiment on the PIQA dataset using various quantization schemes. It shows the change in accuracy and the percentage of ‘flips’ (instances where a model’s answer changes from correct to incorrect or vice versa) compared to a 16-bit baseline model for Llama-2 7b, Llama-2 13b, Llama-2 70b, Yi-6b, and Yi-34b chat models. Different quantization methods (BnB W8A8, GPTQ W8A16, SQ W8A8, GPTQ W4A16, AWQ W4A16, BnB W4A4) are evaluated.

This table presents the results of evaluating six quantization schemes on the Hellaswag benchmark task. For each quantization scheme, the table shows the change in accuracy (percentage) and the percentage of flips compared to the baseline 16-bit model. The results are broken down by model (Llama2-7b chat, Llama2-13b chat, Llama2-70b chat, Yi-6b chat, Yi-34b chat). The table highlights the negligible difference in accuracy across different compression methods while simultaneously revealing the significant number of flips (indicating large underlying changes not captured by accuracy alone), except for the GPTQ W8A16 scheme.

This table presents the results of experiments conducted on the ARC Easy dataset using a 0-shot setting. It shows the change in accuracy and the percentage of flips observed for several different quantization schemes applied to various large language models. The data illustrates the impact of these compression techniques on model behavior, highlighting the trade-off between maintaining accuracy and minimizing changes in the model’s output. A significant finding is the high number of flips, even when the overall accuracy is preserved, demonstrating that accuracy alone may not fully reflect the effect of these techniques on user experience.

This table presents the results of evaluating the impact of six different quantization techniques on the ARC Challenge dataset. The table shows the change in accuracy and the percentage of ‘flips’ (instances where a correct answer becomes incorrect, or vice versa) compared to a 16-bit baseline model. The results are broken down by model (Llama2 7b, 13b, 70b, and Yi 6b, 34b chat models) and quantization scheme (BnB W8A8, GPTQ W8A16, SQ W8A8, GPTQ W4A16, AWQ W4A16, BnB W4A4). It highlights the observation that while accuracy changes are often negligible, the percentage of flips can be substantial, indicating significant differences in the models’ behavior even with similar accuracy.

This table presents the results for the TriviaQA task, using a 5-shot setting. It shows the baseline accuracy of the 16-bit model and the change in accuracy and percentage of flips for various lower-bit quantization schemes (BnB W8A8, BnB W4A4). The table allows comparison of the performance of different quantization methods on this specific task, highlighting the trade-off between accuracy and the number of ‘flips’ (where correct answers become incorrect and vice-versa).

This table presents the results of experiments on the MMLU 5-shot task using different quantization schemes. It shows that while the change in accuracy between the baseline 16-bit model and the quantized models is small (less than 2%), there’s a significant difference in the number of ‘flips’ (changes from correct to incorrect answers and vice-versa). The table highlights the extent of this divergence for various models and quantization techniques, indicating that accuracy alone is an insufficient metric for evaluating model compression.

This table presents the results of experiments conducted on pretrained language models using the MMLU 5-shot benchmark. It shows the change in accuracy and the percentage of ‘flips’ (changes in answers from correct to incorrect, or vice versa) for various quantization schemes compared to a 16-bit baseline model. The models evaluated include Llama2-7b, Llama2-13b, Llama2-70b, Yi-6b, and Yi-34b. Quantization techniques used are BnB W8A8, GPTQ W8A16, SQ W8A8, GPTQ W4A16, AWQ W4A16, and BnB W4A4. The table quantifies the impact of different quantization methods on model accuracy and answer consistency.

This table presents the results of applying six different quantization schemes to five different large language models (LLMs) on the MMLU 5-shot task. The goal was to evaluate the impact of quantization on model accuracy and a new metric called ‘flips.’ Flips measure the proportion of answers that change from correct to incorrect or vice-versa when comparing the quantized model to the baseline 16-bit model. The table shows that while the change in accuracy is minimal (between 0% and 2%), the number of flips is substantially larger for most quantization methods (except for GPTQ W8A16). This suggests that even when accuracy remains similar, the underlying model behavior can differ significantly due to quantization, highlighting the insufficiency of using accuracy alone for evaluation.

This table presents the results of an experiment evaluating the impact of various quantization schemes on the accuracy and the number of ‘flips’ (changes in answers from correct to incorrect or vice-versa) in the MMLU (Massive Multitask Language Understanding) 5-shot benchmark. It compares six different quantization techniques across four different language models (Llama2-7b chat, Llama2-13b chat, Llama2-70b chat, Yi-6b chat, and Yi-34b chat). The results show that while the overall accuracy remains largely unchanged, the number of flips varies significantly across different quantization methods, indicating a substantial divergence in model behavior despite similar accuracy scores.

This table presents the MT-Bench scores for the first turn of the multi-turn dialogue task. The scores are presented for various models and quantization methods. The 16-bit model serves as a baseline, allowing for comparison across different compression techniques. Higher scores indicate better performance.

This table presents the MT-Bench scores for the second turn of the multi-turn dialogue task. The scores represent the average performance of various quantized models (using different quantization techniques and bit-depths) on the MT-Bench benchmark. The baseline 16-bit model is included for comparison. The table shows how the different compression methods impact the model’s performance on this specific turn of the task.

This table presents the results of a five-shot accuracy evaluation on the MMLU benchmark for various LLMs and different quantization schemes. The baseline accuracy is shown alongside the change in accuracy and the percentage of flips observed when compared to the baseline 16-bit model. The table helps to quantify the divergence between the baseline and compressed models, even when accuracy differences are negligible. The models compared are Qwen2-1.5B, Qwen2-7B, Qwen2-72B, Llama3-8B, and Llama3-70B. The quantization methods are BnB W8A8, GPTQ W8A16, GPTQ W4A16, AWQ W4A16, and BnB W4A4.

This table presents the results of the MMLU 5-shot experiments, comparing the performance of various quantized models against a 16-bit baseline. For several models (Qwen-2 and Llama-3 families), it shows the change in accuracy and the percentage of ‘flips’ (answers changing from correct to incorrect or vice versa) for different quantization schemes (BnB W8A8, GPTQ W8A16, GPTQ W4A16, AWQ W4A16, BnB W4A4). The table highlights how even when accuracy remains relatively stable across various quantization techniques, the number of flips can vary significantly, indicating divergence in model behavior despite similar overall accuracy scores.

This table presents the results of the ARC-Challenge (a question answering benchmark) zero-shot experiment. It shows the change in accuracy and the percentage of ‘flips’ (instances where a model changed an answer from correct to incorrect or vice versa) for various quantization schemes (BnB W8A8, GPTQ W8A16, SQ W8A8, GPTQ W4A16, AWQ W4A16, BnB W4A4) compared to a 16-bit baseline model. The models used are Qwen2-1.5B, Qwen2-7B, Qwen2-72B, Llama3-8B, and Llama3-70B. NA indicates that the data was not available for that specific model and quantization technique.

This table presents the results of evaluating the MATH dataset (a multiple-choice question-answering task) using various quantization methods. It shows the change in accuracy and the percentage of flips (answers changing from correct to incorrect or vice versa) compared to a 16-bit baseline model for different quantization techniques (BnB W8A8, GPTQ W8A16, GPTQ W4A16, AWQ W4A16, BnB W4A4). The results are displayed for different model sizes (Qwen2-1.5B, Qwen2-7B, Qwen2-72B, Llama3-8B, Llama3-70B), demonstrating the impact of quantization on accuracy and answer consistency.

This table presents the results of GSM8k (8-shot) experiments, evaluating the impact of various quantization schemes on model accuracy and flips. The table compares the baseline 16-bit model to several quantized versions (BnB W8A8, GPTQ W8A16, GPTQ W4A16, AWQ W4A16, BnB W4A4), showing the percentage change in accuracy and the percentage of flips observed for each quantized model. A flip is defined as an answer changing from correct to incorrect or vice versa. The table is part of an analysis demonstrating that accuracy alone is insufficient for assessing the quality of compressed LLMs; the high number of flips indicates a substantial divergence in model behavior, despite only minor accuracy differences.

This table presents the results of experiments on the MMLU benchmark with 5-shot setting. It shows the change in accuracy and the percentage of flips for various quantization schemes applied to Llama-3 and Qwen-2 families of models, in comparison to a 16-bit baseline model. The table helps demonstrate that even with negligible accuracy changes, a significant number of flips can occur due to quantization, highlighting the limitations of accuracy alone as a metric for assessing compressed models.

This table presents the results of evaluating three different large language models (LLMs) using the BFCL-greedy benchmark. The BFCL-greedy benchmark is a tweaked version of the standard BFCL benchmark that uses greedy decoding instead of top-p sampling. This allows for a more direct measurement of the impact of quantization on model performance, without the added noise introduced by sampling. The table shows the change in accuracy and the percentage of ‘flips’ (changes in answers from correct to incorrect, or vice versa) for each model when different quantization techniques are applied. The models evaluated are Gemma-2B-it, Gemma-7B-it, and Llama-3-8B-Instruct. The quantization techniques used are GPTQ W8A16, GPTQ W4A16, and AWQ W4A16. The results demonstrate that while accuracy may not change significantly, the number of flips can increase substantially with quantization, indicating a divergence in model behavior.

This table presents the results of evaluating the BFCL task using the standard BFCL evaluation method (top_p sampling). It shows the change in accuracy and the percentage of flips observed in Llama-3-8B-Instruct model with 16-bit baseline and different quantization schemes. The table highlights the significant percentage change in flips observed, even with small changes in accuracy, for two different runs of the 16-bit model and for GPTQ W8A16 and GPTQ W4A16.

This table presents the results of experiments on the MMLU benchmark (5-shot setting) using various quantization schemes. The accuracy change from the baseline 16-bit model is minimal for all schemes (within 2%). However, the percentage of ‘flips’ (changes in answers from correct to incorrect or vice versa) is significant for all but one quantization method (GPTQ W8A16), suggesting that while accuracy remains largely unchanged, the compressed models behave differently from the baseline.

This table shows the overlap coefficient between pairs of quantization schemes. The overlap coefficient measures the proportion of samples that were impacted by both quantization schemes in a set of samples that were impacted by at least one of the quantization schemes. The higher the overlap coefficient, the higher the consistency between quantization schemes. The results are calculated using Llama2-70b, MMLU, 5-shot and 15k questions.

This table shows the average top margin for correct and incorrect answers across different datasets and LLMs. The top margin is calculated as the difference between the probability assigned to the correct option and the probability assigned to the next most likely option. A higher top margin indicates greater confidence in the model’s prediction. The table demonstrates that when a model’s prediction is correct, the top margin is generally much higher than when the prediction is incorrect.

This table presents the percentage of correct and incorrect answers that changed after applying different quantization methods to the Llama2 and Yi models on the MMLU 5-shot benchmark. The results show that a greater proportion of incorrect answers changed compared to correct answers after quantization.
This table presents the results of evaluating various quantization schemes on the MMLU 5-shot task. It compares the accuracy and the percentage of ‘flips’ (instances where a model changed its answer from correct to incorrect or vice versa) for different models (Llama2-7b, Llama2-13b, Llama2-70b, Yi-6b, Yi-34b) using six different quantization schemes (BnB W8A8, GPTQ W8A16, SQ W8A8, GPTQ W4A16, AWQ W4A16, BnB W4A4). The key observation is that while the change in accuracy across different quantization schemes is small (between 0 and 2%), the number of ‘flips’ significantly increases for most schemes, indicating a notable divergence in the model’s behavior even when the overall accuracy remains similar. This emphasizes the limitations of using accuracy alone to evaluate compressed models.
This table shows the percentage of correct and incorrect answers that changed from the baseline model to the quantized model for the MMLU 5-shot task. The results are broken down by quantization method (BnB 8bit, SQ 8bit, GPTQ 4bit, AWQ 4bit, BnB 4bit) and model (Llama2-7b chat, Llama2-13b chat, Llama2-70b chat, Yi-6b chat, Yi-34b chat). A noteworthy observation is that a higher percentage of incorrect answers changed compared to correct answers.

This table shows the percentage of correct and incorrect answers that changed in the MMLU 5-shot experiment after applying different quantization methods. The data is broken down for different models (Llama2-7b chat, Llama2-13b chat, Llama2-70b chat, Yi-6b chat, and Yi-34b chat). For each model and quantization technique, the table presents two numbers: the percentage of initially correct answers that became incorrect and the percentage of initially incorrect answers that became correct. This data demonstrates the phenomenon of ‘flips’, where a significant proportion of correct answers become incorrect and vice-versa, even when overall accuracy remains relatively unchanged. The table highlights that a considerably higher percentage of incorrect answers change compared to correct answers.

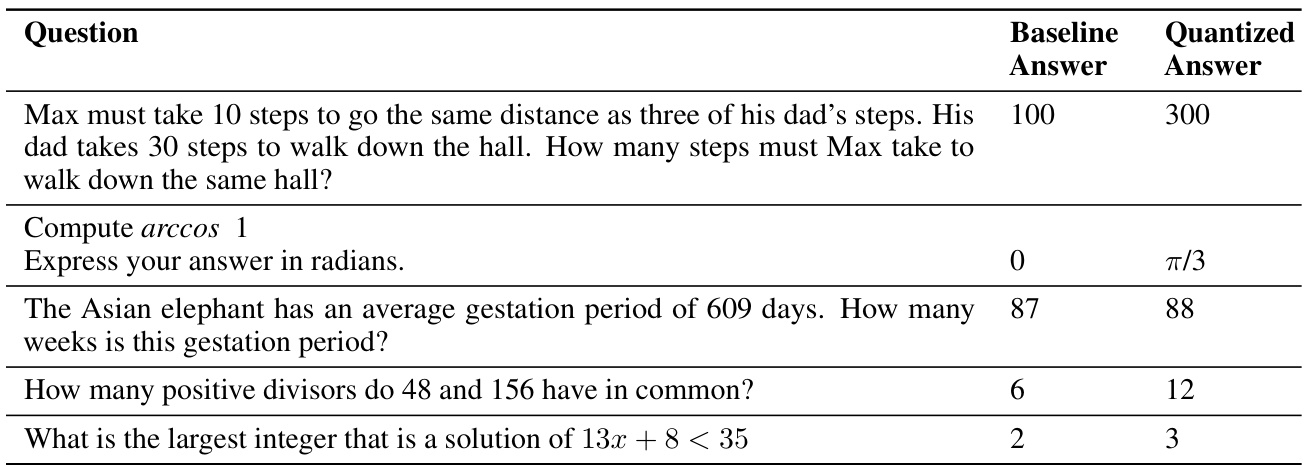
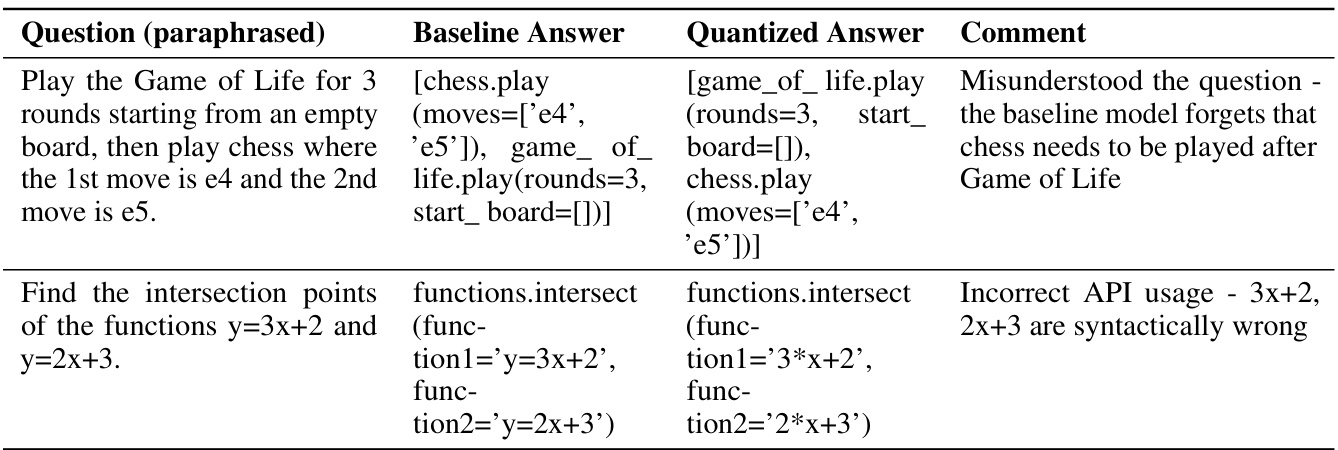
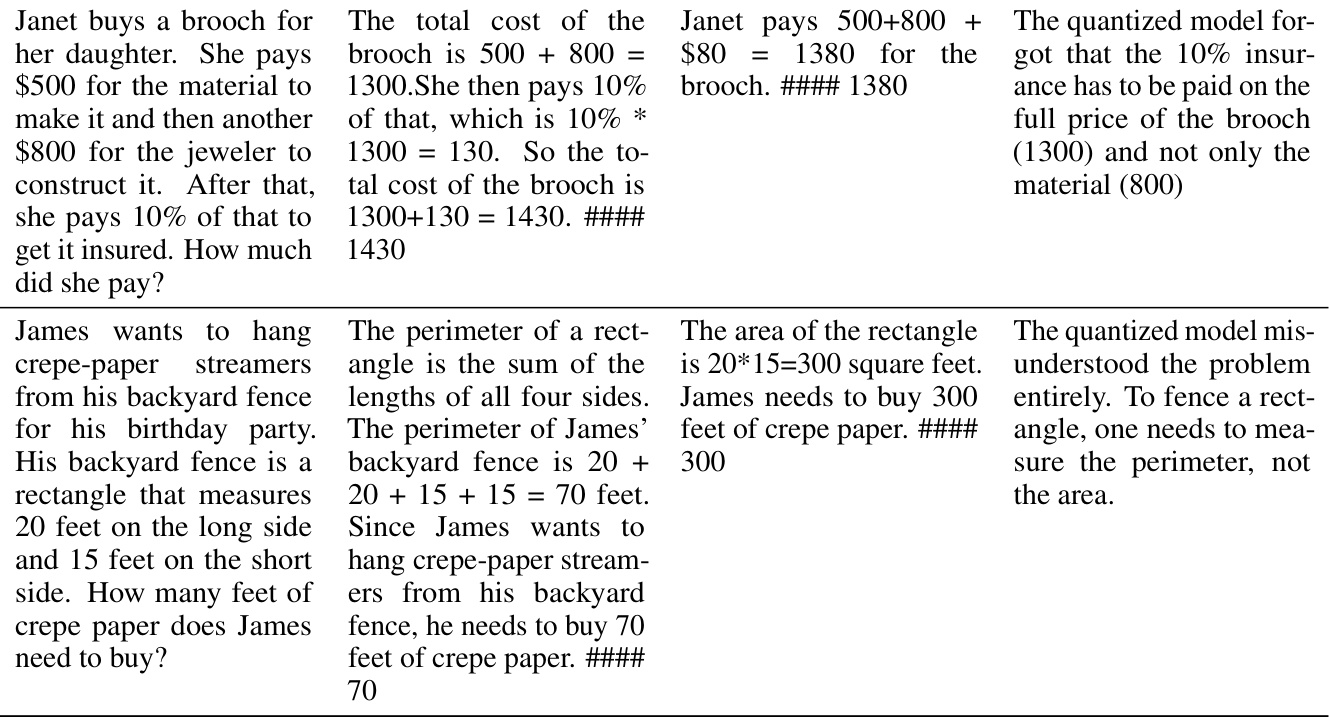
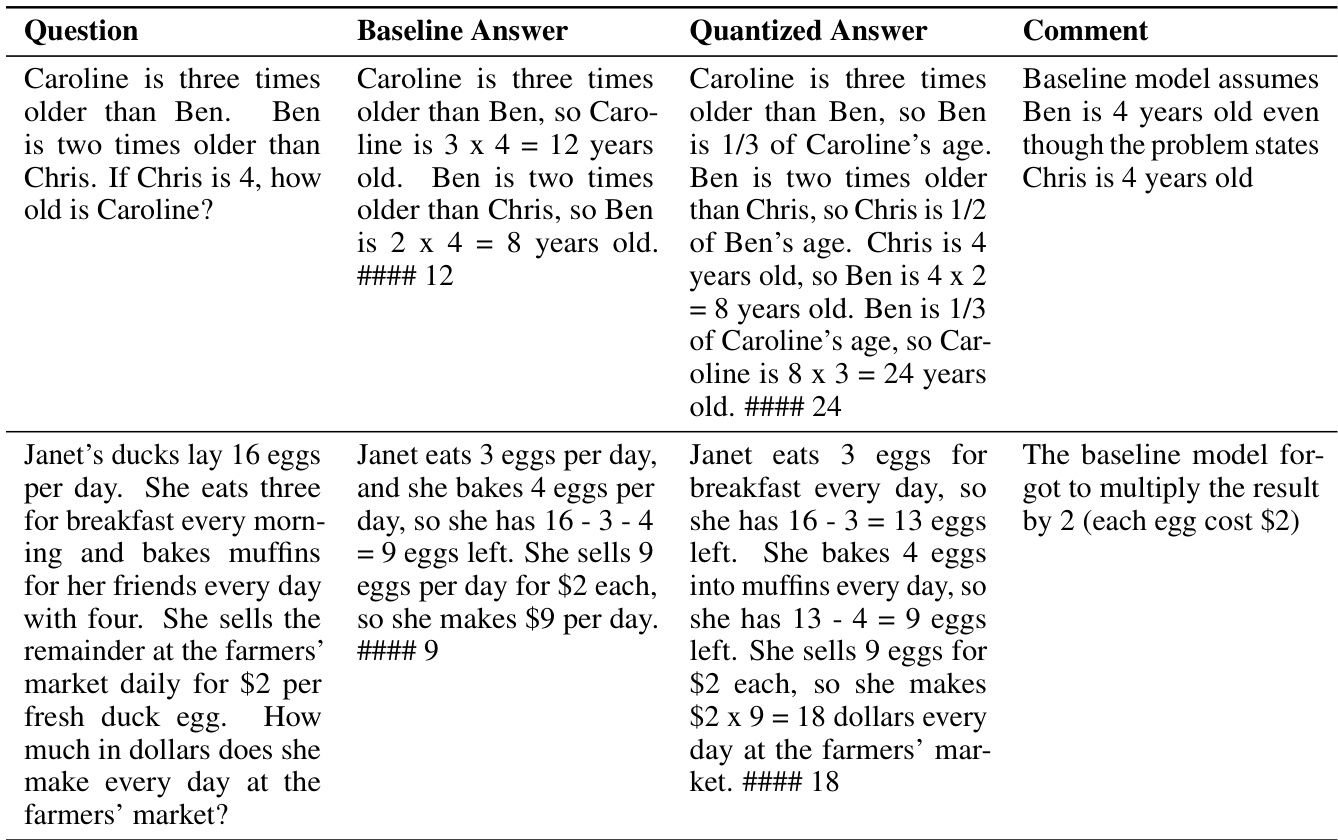
This table presents a qualitative evaluation of the Llama2-70B-chat model’s performance on ten MT-Bench prompts. The authors provide a summary of the model’s responses, categorized by 16-bit, 8-bit, and 4-bit versions, and highlighting key differences and errors. Complete responses are available in the appendix.

This table presents the results of experiments conducted on several large language models (LLMs) using various quantization schemes. The goal was to evaluate the impact of quantization on the model’s accuracy and the frequency of ‘flips’ (changes from correct to incorrect answers, or vice versa). The table shows that while the change in accuracy is minimal for most quantization schemes, the percentage of flips is substantial in many cases, suggesting that model behavior can significantly differ even when aggregate accuracy remains similar. This highlights the limitations of using accuracy alone as a metric for evaluating model compression.
This table demonstrates the effect of adding Gaussian noise to the model weights. It shows that adding noise causes a roughly equal number of correct answers to become incorrect and incorrect answers to become correct, while leaving the overall accuracy relatively unchanged. This highlights the limitations of using accuracy alone as an evaluation metric for compressed models, as large underlying changes can occur without a significant change in overall accuracy.

This table presents the average scores for the two turns in the MT-Bench benchmark, as evaluated by GPT-4. It compares the performance of different quantized models against the baseline (16-bit) model across various Llama and Yi model sizes. The scores reflect the quality of the model’s free-form text generation capabilities in a multi-turn dialogue task. Higher scores indicate better performance. The table is useful in assessing how different quantization techniques affect the performance of the model on a more complex, open-ended task.
This table presents the average scores obtained from evaluating different quantized models on the MT-Bench task. The evaluation was performed using GPT-4 as an automated judge, considering both turn 1 and turn 2 responses separately. The table allows for a comparison of the performance of various compression techniques (indicated by the model names and quantization schemes) across multiple LLMs (Llama-2 and Yi families). Lower scores indicate poorer performance in the free-form text generation task.
This table presents the average scores obtained from evaluating various quantized models using the MT-Bench benchmark, with GPT-4 acting as the automated judge. The scores reflect the models’ performance on a multi-turn dialogue task and are broken down by model (Llama-2 7B chat, Llama-2 13B chat, Llama-2 70B chat, Yi-6B chat, Yi-34B chat) and quantization technique (16bit, BnB W8A8, GPTQ W8A16, SQ W8A8, GPTQ W4A16, AWQ W4A16, BnB W4A4). Lower scores indicate poorer performance. The table highlights the impact of different quantization techniques on the models’ ability to generate coherent and relevant responses in a conversational setting.
Full paper#


