↗ arXiv ↗ Hugging Face ↗ Hugging Face ↗ Chat
TL;DR#
Existing single-modality approaches for emotion recognition often fail to capture the complexity of real-world emotional expressions which are inherently multimodal. Additionally, current Multimodal Large Language Models (MLLMs) struggle with integrating audio and recognizing subtle facial micro-expressions. This necessitates the development of new models and datasets to improve the accuracy and scope of emotion recognition.
This paper introduces Emotion-LLaMA, a new model that seamlessly integrates audio, visual, and textual inputs through emotion-specific encoders, significantly enhancing emotional recognition and reasoning capabilities. The model leverages the newly created MERR dataset, containing over 28,000 samples annotated with coarse-grained and fine-grained emotional labels across diverse categories. The comprehensive evaluation on multiple benchmark datasets demonstrates that Emotion-LLaMA outperforms other MLLMs, setting a new state-of-the-art.
Key Takeaways#
Why does it matter?#
This paper is important because it introduces Emotion-LLaMA, a novel multimodal large language model that significantly outperforms existing models in emotion recognition and reasoning. Its introduction of the MERR dataset addresses the lack of large-scale, multimodal instruction-following datasets in this field, opening up new avenues for research and development in affective computing and related areas. The multi-task learning approach and the model’s capability to reason about emotions, as evaluated on standard benchmark datasets, is a significant advancement that is relevant to various research trends. The availability of the code and dataset allows other researchers to build on this work.
Visual Insights#

🔼 This figure shows an example from the MERR dataset, illustrating how multimodal data (audio, video, text) is annotated. It highlights the various components of the annotation: the audio tone description captures vocal cues; the lexical subtitle provides the transcribed text; the visual objective description summarizes the broader scene; the visual expression description details specific facial expressions (Action Units); a classification label assigns a primary emotion; and the multimodal description integrates all modalities for a comprehensive understanding of the emotional context. This figure is crucial in illustrating the richness and complexity of the MERR dataset annotations.
read the caption
Figure 1: Example of the MERR dataset: It includes audio tone description, lexical subtitle, visual objective description, visual expression description, classification label, and multimodal description.

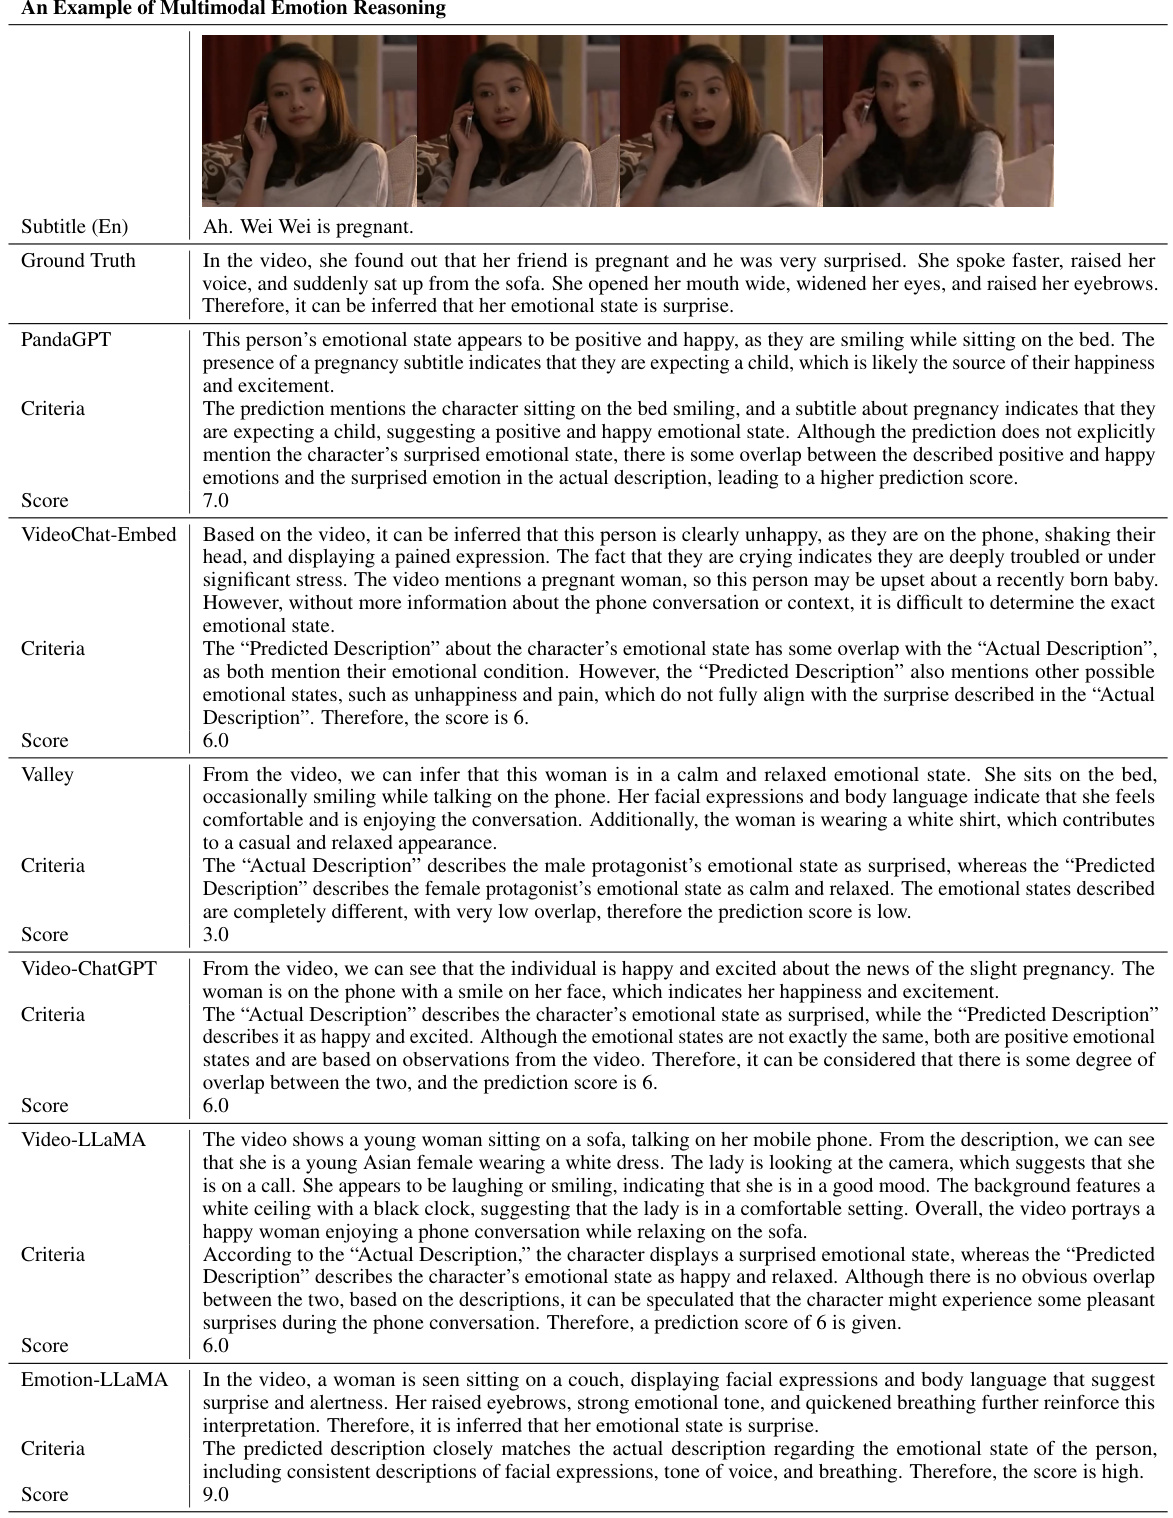
🔼 This table presents a comparison of the performance of various multimodal large language models (MLLMs) on the EMER dataset, which focuses on emotional reasoning capabilities. The comparison is based on two key metrics: Clue Overlap, measuring the overlap between emotion-related clues identified by the model and ground truth; and Label Overlap, measuring the overlap between the summarized emotional states. The table shows that Emotion-LLaMA outperforms other MLLMs, achieving the highest scores in both Clue Overlap and Label Overlap.
read the caption
Table 1: Comparison of multimodal emotion reasoning results on the EMER dataset. Clue Overlap and Label Overlap scores range from 0 to 10.
In-depth insights#
MERR Dataset#
The MERR dataset, a crucial component of the Emotion-LLaMA model, is designed for multimodal emotion recognition and reasoning. Its construction involves a rigorous annotation process that goes beyond simple labels, capturing rich contextual information including facial expressions (via AUs), vocal cues, and visual context. This multimodal approach allows for a deeper understanding of emotion, addressing limitations of previous datasets which often lack audio or detailed descriptions. The dataset’s size and diversity (28,618 coarse-grained and 4,487 fine-grained samples) are significant strengths, enabling models to learn from varied scenarios and generalize to real-world applications. The inclusion of “doubt” and “contempt,” often underrepresented emotions, further enhances the dataset’s value for comprehensive research. Overall, MERR’s focus on instruction-following data and detailed annotations marks a substantial step forward in the field of multimodal emotion analysis, enabling the development of more sophisticated and robust models like Emotion-LLaMA.
Emotion-LLaMA#
The research paper introduces Emotion-LLaMA, a novel multimodal large language model designed for enhanced emotion recognition and reasoning. A key contribution is the creation of the MERR dataset, offering diverse multimodal samples with detailed annotations for improved model training and evaluation. Emotion-LLaMA excels by integrating audio, visual, and textual inputs through emotion-specific encoders, effectively capturing the complexity of real-world emotional expression that often transcends single-modality approaches. The model leverages instruction tuning to boost both emotion recognition and reasoning, demonstrating superior performance over other MLLMs in various benchmark evaluations. The methodology highlights both the model’s architectural design and the dataset’s richness, emphasizing the importance of multimodal data in advancing this field. However, limitations regarding class imbalance and resource demands for training are acknowledged, paving the way for future improvements and research to tackle these challenges.
Multimodal Fusion#
Multimodal fusion, in the context of emotion recognition, seeks to combine information from diverse sources like text, audio, and video to achieve a more holistic and accurate understanding of emotional states. Effective fusion strategies are crucial because individual modalities often provide incomplete or ambiguous information. A key challenge is to find the optimal representation of the data from each modality, ensuring they are compatible for integration, while avoiding information loss. This typically involves feature extraction and alignment techniques, potentially using deep learning architectures. Different approaches exist, ranging from early fusion (combining raw data early in the pipeline) to late fusion (combining predictions or higher-level features), and intermediate approaches that involve multiple stages of fusion. The best approach often depends on the specific modalities and task at hand. Ultimately, successful multimodal fusion leads to enhanced emotion recognition accuracy, improved robustness to noise, and a deeper understanding of the complex interplay between different emotional cues, resulting in more effective and nuanced emotional AI systems. The selection of an optimal fusion strategy significantly influences the final system’s accuracy and robustness, demanding careful consideration and experimentation.
Ablation Study#
An ablation study systematically removes components of a model to determine their individual contributions. In the context of a multimodal emotion recognition model, an ablation study might investigate the impact of removing specific modalities (audio, visual, text), individual encoders, or particular processing steps. By observing the impact on overall performance metrics (e.g., accuracy, F1-score), researchers gain a better understanding of the importance of each component. For instance, removing the audio modality might significantly decrease performance if the model heavily relied on vocal cues for emotion recognition. Similarly, removing a specific encoder (e.g., visual encoder based on MAE) reveals its contribution in processing visual information. A thoughtful ablation study goes beyond simply removing features; it also considers interdependencies among components and explores how their combined effects surpass their individual contributions. Detailed analysis and visualizations of performance changes offer valuable insights into the model’s architecture, helping refine and improve the overall system. Finally, the study should discuss how these findings inform future model development and guide resource allocation, emphasizing what worked well and what could be improved. This structured approach helps researchers to optimize their model and provides a more complete account of the system’s capabilities.
Future Work#
Future research directions stemming from this work on multimodal emotion recognition could focus on several key areas. First, expanding the MERR dataset is crucial. Increasing its size and diversity of emotional expressions, particularly under-represented categories like contempt and doubt, would significantly improve model robustness. Second, exploring advanced multimodal fusion techniques beyond simple concatenation is needed to better capture the complex interplay between audio, visual, and textual cues, leading to more accurate emotion recognition. Third, developing more sophisticated reasoning models that can generate nuanced and detailed explanations for their emotion predictions is a key challenge. This involves addressing issues such as handling contradictory evidence and incorporating contextual factors into the reasoning process. Fourth, benchmarking Emotion-LLaMA against a broader range of existing MLLMs on diverse datasets is essential. This would provide a more comprehensive understanding of its performance and capabilities relative to current state-of-the-art systems. Finally, the development of effective applications that leverage Emotion-LLaMA’s capabilities in real-world settings is a critical next step. This might include applications in mental health care, educational assistance, or human-computer interaction.
More visual insights#
More on figures

🔼 The figure shows the architecture of the Emotion-LLaMA model, highlighting its multimodal nature. Audio, visual (from a peak frame and video sequences), and textual inputs are processed by their respective encoders (HuBERT for audio, MAE, VideoMAE, and EVA for vision). These encoders’ outputs are projected into a common embedding space using linear layers and then inputted into a modified LLaMA language model. The LLaMA model has learnable weights (LoRA) and frozen weights, integrating the information to produce the final multimodal output. Instruction tuning is used to improve both emotional recognition and reasoning.
read the caption
Figure 2: Architecture of Emotion-LLaMA, which integrates audio, visual, and text inputs for multimodal emotional recognition and reasoning.

🔼 This figure visualizes the output probability distributions of different models for multimodal emotion recognition. Each sample is shown using two bar graphs. The left graph shows the results from other models in comparison to Emotion-LLaMA, highlighting the differences in their recognition capabilities. The right graph shows the results for Emotion-LLaMA, which demonstrates its superior performance.
read the caption
Figure 3: Visualization of the output probability distribution for multimodal emotion recognition by different models. Each sample is represented by two bar graphs: the left graph displays the results from other models, and the right graph shows the results from Emotion-LLaMA.

🔼 This figure shows the distribution and analysis of Action Units (AUs) in the MERR dataset. The top part displays the frequency distribution of all AUs in the dataset. The bottom part shows the distribution of the top five most frequent AUs for each of the nine emotion categories (neutral, happy, angry, worried, sad, surprise, fear, doubt, contempt). This provides insights into the specific facial muscle movements associated with each emotion category, which helps in better understanding of the relationship between AUs and emotional expressions.
read the caption
Figure 4: Distribution and analysis of Action Units (AUs) in the MERR dataset. The top part displays the frequency of different AUs across all samples, highlighting the most prevalent facial movements. The bottom part presents a statistical breakdown of the top five most frequent AUs for each of the nine facial expression categories, providing insights into the facial patterns associated with each emotion.

🔼 This figure shows a comparison of the distribution of emotion labels across four different datasets: DFEW, MER2023, EMER, and MERR. The left panels show the individual label distributions for each dataset, illustrating the relative frequency of each emotion category within each dataset. The right panel presents a side-by-side comparison of these distributions, allowing for a visual comparison of the similarities and differences in emotional category representation across the four datasets. This visualization helps to highlight which datasets focus more on certain emotions than others and shows the diversity of emotion representations across the datasets.
read the caption
Figure 5: Comparative analysis of label distributions across the DFEW, MER2023, EMER, and MERR datasets. The left side illustrates the individual label distributions for each dataset, while the right side presents a side-by-side comparison of the label distributions, highlighting the similarities and differences in emotional category representation among the datasets.

🔼 This figure illustrates the process of annotating video data for emotional expression using Action Units (AUs). The top row shows the steps involved in identifying the face, extracting its texture features, and classifying the action units (AUs) present in each frame. The bottom row shows the identification of the emotional peak frame (the frame with the highest cumulative AU intensity), the AU intensities across multiple frames, and finally, the generation of a visual description of the emotional expression based on the AUs.
read the caption
Figure 6: Overview of the video expression annotation process using Action Units (AUs). The top section illustrates the sampling of frames from a video, extraction of aligned faces, and measurement of AU intensities in each frame. The bottom section depicts the identification of the emotional peak frame based on the highest total AU intensity. The AUs of the peak frame are then translated into corresponding facial expression descriptions, providing a detailed characterization of the emotional expression at the most salient moment in the video.

🔼 This figure compares the distribution of emotion labels across four different datasets: DFEW, MER2023, EMER, and MERR. The left panel shows individual bar charts for each dataset, illustrating the frequency of each emotion category. The right panel provides a direct comparison, making it easy to see similarities and differences in how each dataset represents different emotions. This visualization is helpful in understanding how the MERR dataset compares to others in terms of emotion category balance and diversity, a crucial factor for training robust emotion recognition models.
read the caption
Figure 5: Comparative analysis of label distributions across the DFEW, MER2023, EMER, and MERR datasets. The left side illustrates the individual label distributions for each dataset, while the right side presents a side-by-side comparison of the label distributions, highlighting the similarities and differences in emotional category representation among the datasets.

🔼 This figure shows the distribution and analysis of Action Units (AUs) in the MERR dataset. The top panel displays the overall frequency of each AU across all samples. The bottom panels show the distribution of the top five most frequent AUs for each of the nine emotion categories (neutral, happy, angry, worried, surprise, sad, fear, doubt, contempt). This breakdown helps visualize which AUs are most strongly associated with each emotion, providing insights into the characteristic facial patterns associated with different emotions.
read the caption
Figure 4: Distribution and analysis of Action Units (AUs) in the MERR dataset. The top part displays the frequency of different AUs across all samples, highlighting the most prevalent facial movements. The bottom part presents a statistical breakdown of the top five most frequent AUs for each of the nine facial expression categories, providing insights into the facial patterns associated with each emotion.
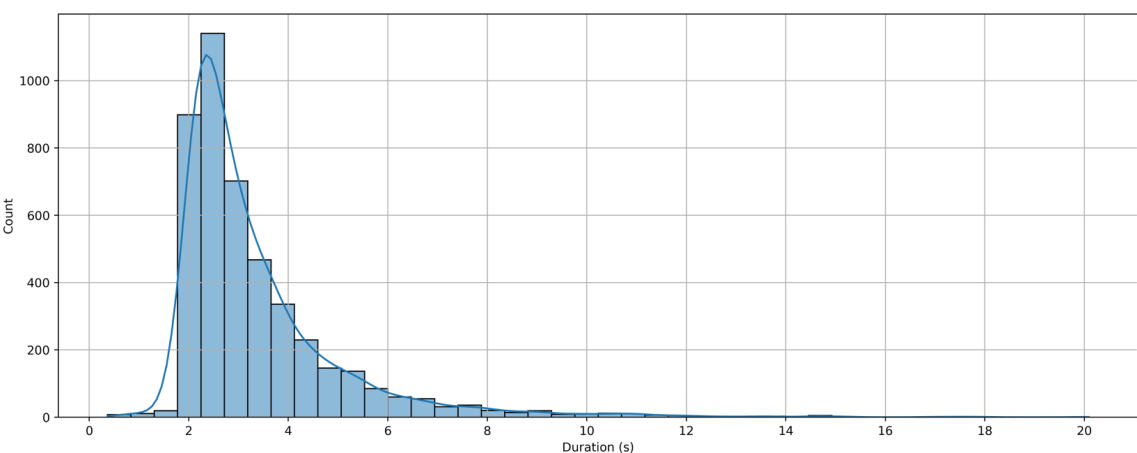
🔼 This figure shows a histogram visualizing the distribution of video durations in the MERR dataset. The x-axis represents the video duration in seconds, and the y-axis shows the count of videos with that duration. The distribution is heavily skewed towards shorter videos (2-4 seconds), indicating that most emotional expressions are captured within that timeframe. This duration balances sufficient context for emotion recognition with manageable data size for annotation. The longer videos are rare, indicating that the dataset focuses primarily on the key moments of emotional expression.
read the caption
Figure 7: Distribution of video durations in the MERR dataset. The histogram illustrates the range and frequency of video lengths, providing insights into the temporal characteristics of the emotional expressions captured in the dataset. The majority of videos fall within the 2–4 second range, striking a balance between sufficient context and manageable data size for annotation and processing.

🔼 This figure shows two confusion matrices, one each for the MER2023-SEMI and DFEW datasets. Each matrix visualizes the model’s performance in classifying different emotions. The color intensity in each cell represents the proportion of samples correctly classified for each emotion pair. Lighter colors indicate higher accuracy, while darker colors show misclassifications. The matrices highlight the model’s strengths in recognizing certain emotions while pointing to challenges in distinguishing between similar emotions, especially those with fewer samples in the training data.
read the caption
Figure 8: Confusion matrices for multimodal emotion recognition datasets. The figure presents confusion matrices that visualize the performance of the Emotion-LLaMA model on benchmark datasets such as MER2023 and DFEW. The matrices provide insights into the model's classification accuracy, highlighting the challenges and successes in distinguishing between different emotional categories. [Zoom in to view]
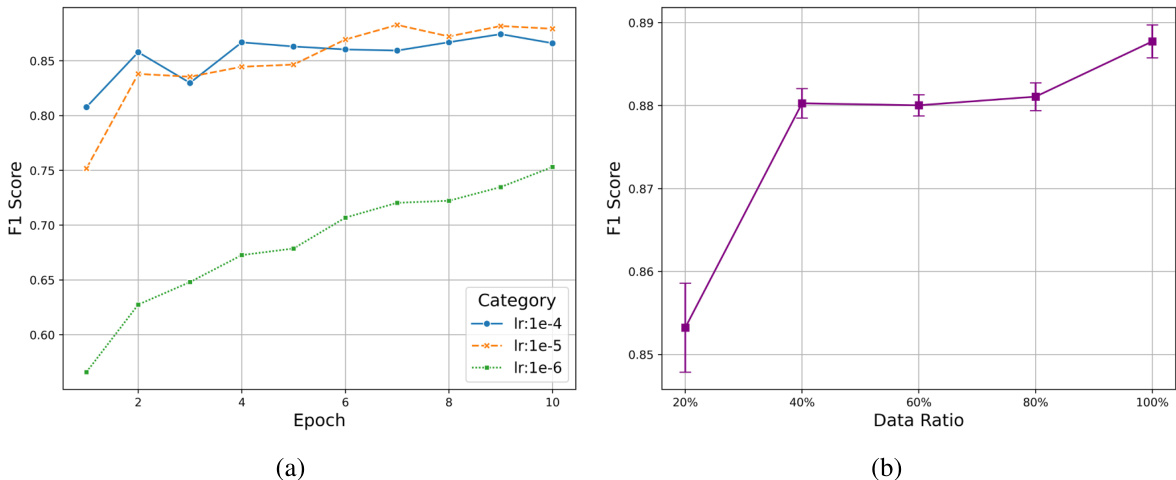
🔼 This figure shows the results of ablation studies on the Emotion-LLaMA model, investigating the impact of hyperparameters and data settings on model performance. The left graph (a) displays how different learning rates (1e-4, 1e-5, 1e-6) affect the F1 score over training epochs. The right graph (b) shows how varying the data ratio (from 20% to 100%) impacts the F1 score. Error bars are included in graph (b) to illustrate variability in the results. These experiments help determine the optimal learning rate and the minimum data needed for effective training.
read the caption
Figure 9: Ablation study results. (a) illustrates the impact of different learning rates on the model's performance, while (b) presents the effects of varying data ratios. These experiments provide valuable insights into the optimal hyperparameter settings and data requirements for training the Emotion-LLaMA model effectively. [Zoom in to view]
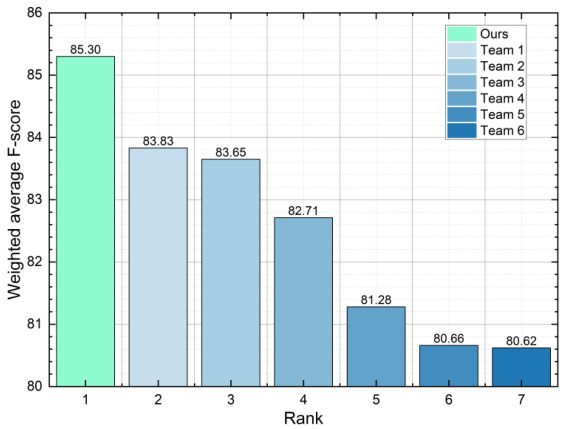
🔼 This figure shows the ranking and weighted average F-scores of different teams participating in the MER-Noise track of the MER2024 challenge. The Emotion-LLaMA model (Ours) achieved the highest score, demonstrating its robustness to noise in the data.
read the caption
Figure 10: Ranking and Scores of Teams in the MER-Noise Track of MER2024.
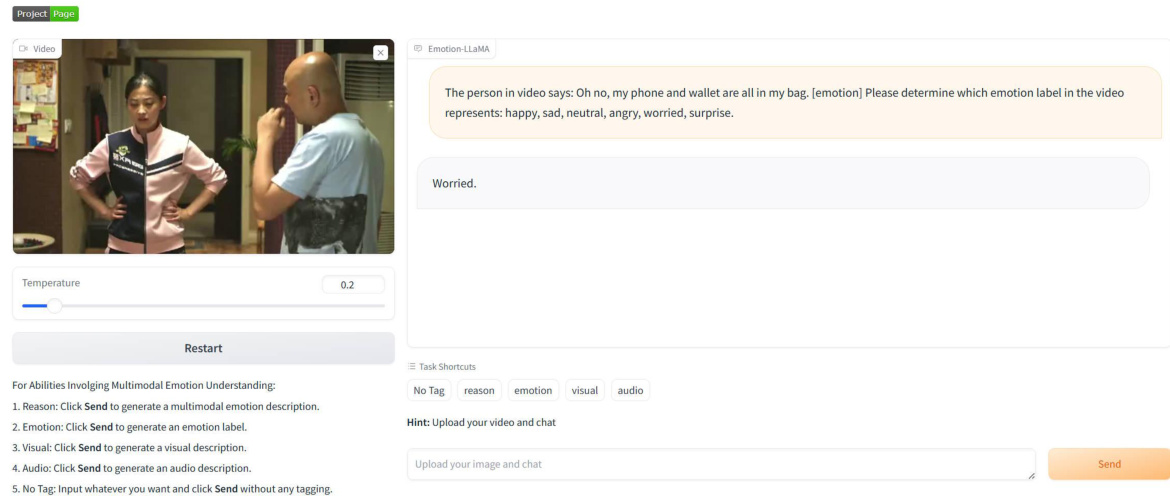
🔼 This figure shows a screenshot of the online demo for the Emotion-LLaMA model. The demo allows users to input multimodal data (video, image, text) and receive real-time emotion predictions and explanations. The interface is user-friendly and interactive, showing the model’s ability to process various data types and generate insightful analysis.
read the caption
Figure 11: Online demo interface of the Emotion-LLaMA model. The figure presents a screenshot of the interactive web-based demo, showcasing the model's capabilities in multimodal emotion recognition and reasoning. Users can input various combinations of visual, audio, and textual data and receive real-time emotion predictions and explanations, facilitating intuitive exploration and evaluation of the model's performance.
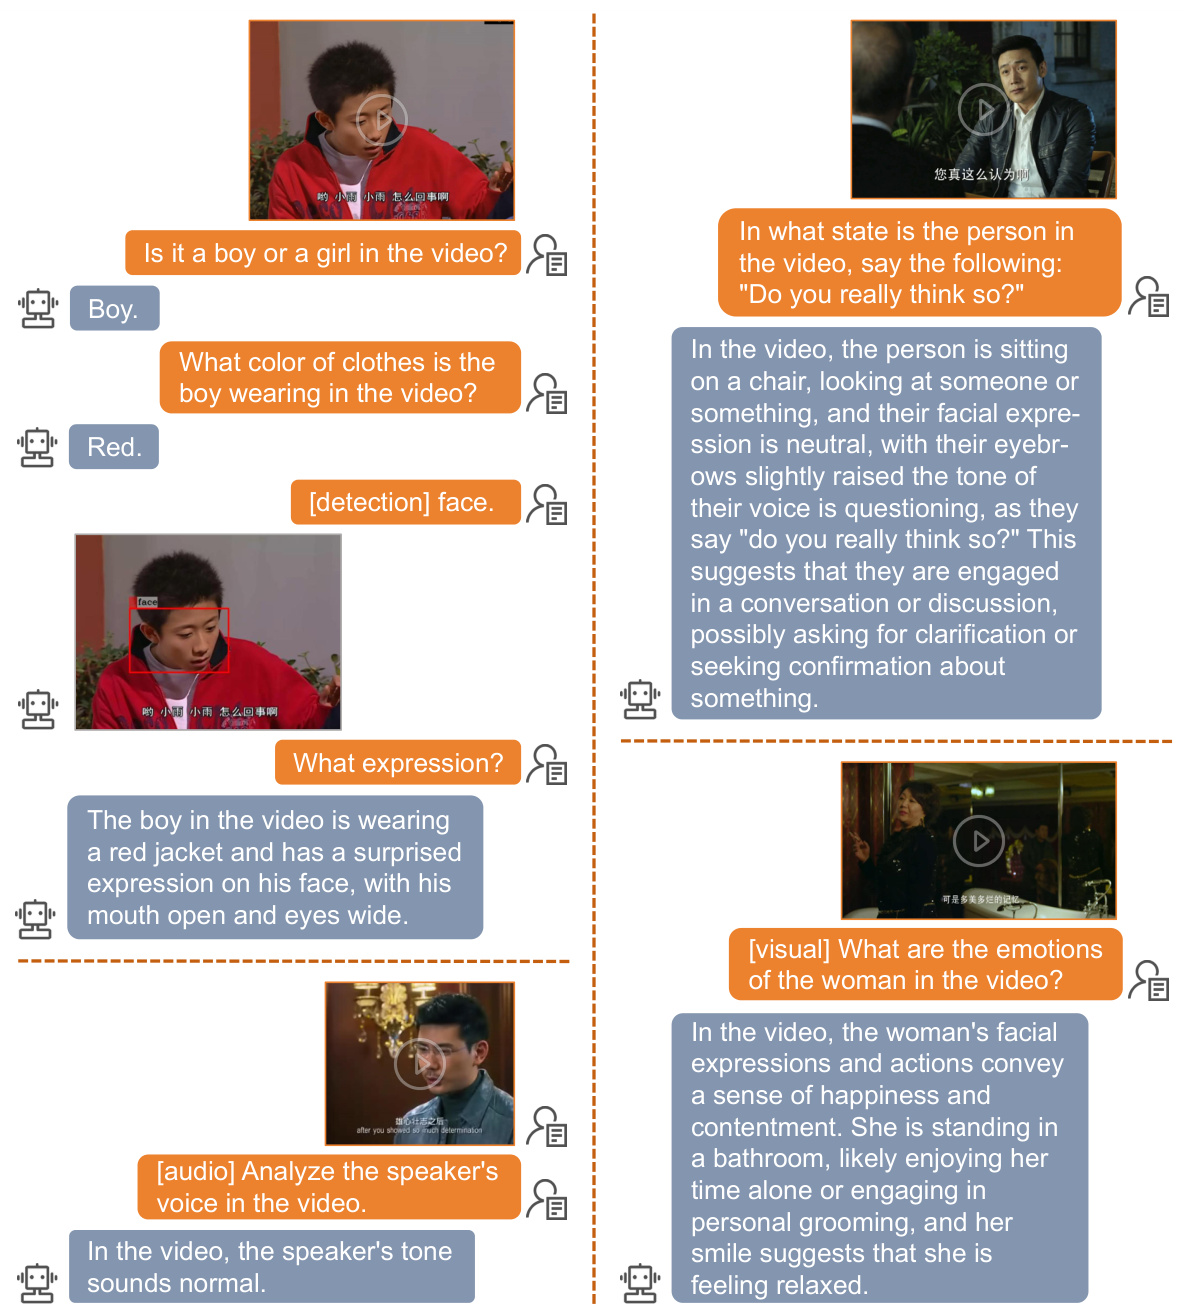
🔼 This figure showcases the Emotion-LLaMA model’s capabilities in performing tasks beyond emotion recognition. It demonstrates the model’s ability to process and understand different types of input, including images and text, and to perform tasks such as face detection and question answering. This highlights the model’s versatility and potential for a wide range of applications.
read the caption
Figure 12: Detailed examples of general tasks performed by the Emotion-LLaMA model. The figure illustrates the model's versatility and robustness in handling tasks beyond emotion recognition, such as face detection and question answering. These examples highlight the model's ability to process and understand visual and textual information, enabling its application in a wide range of scenarios.
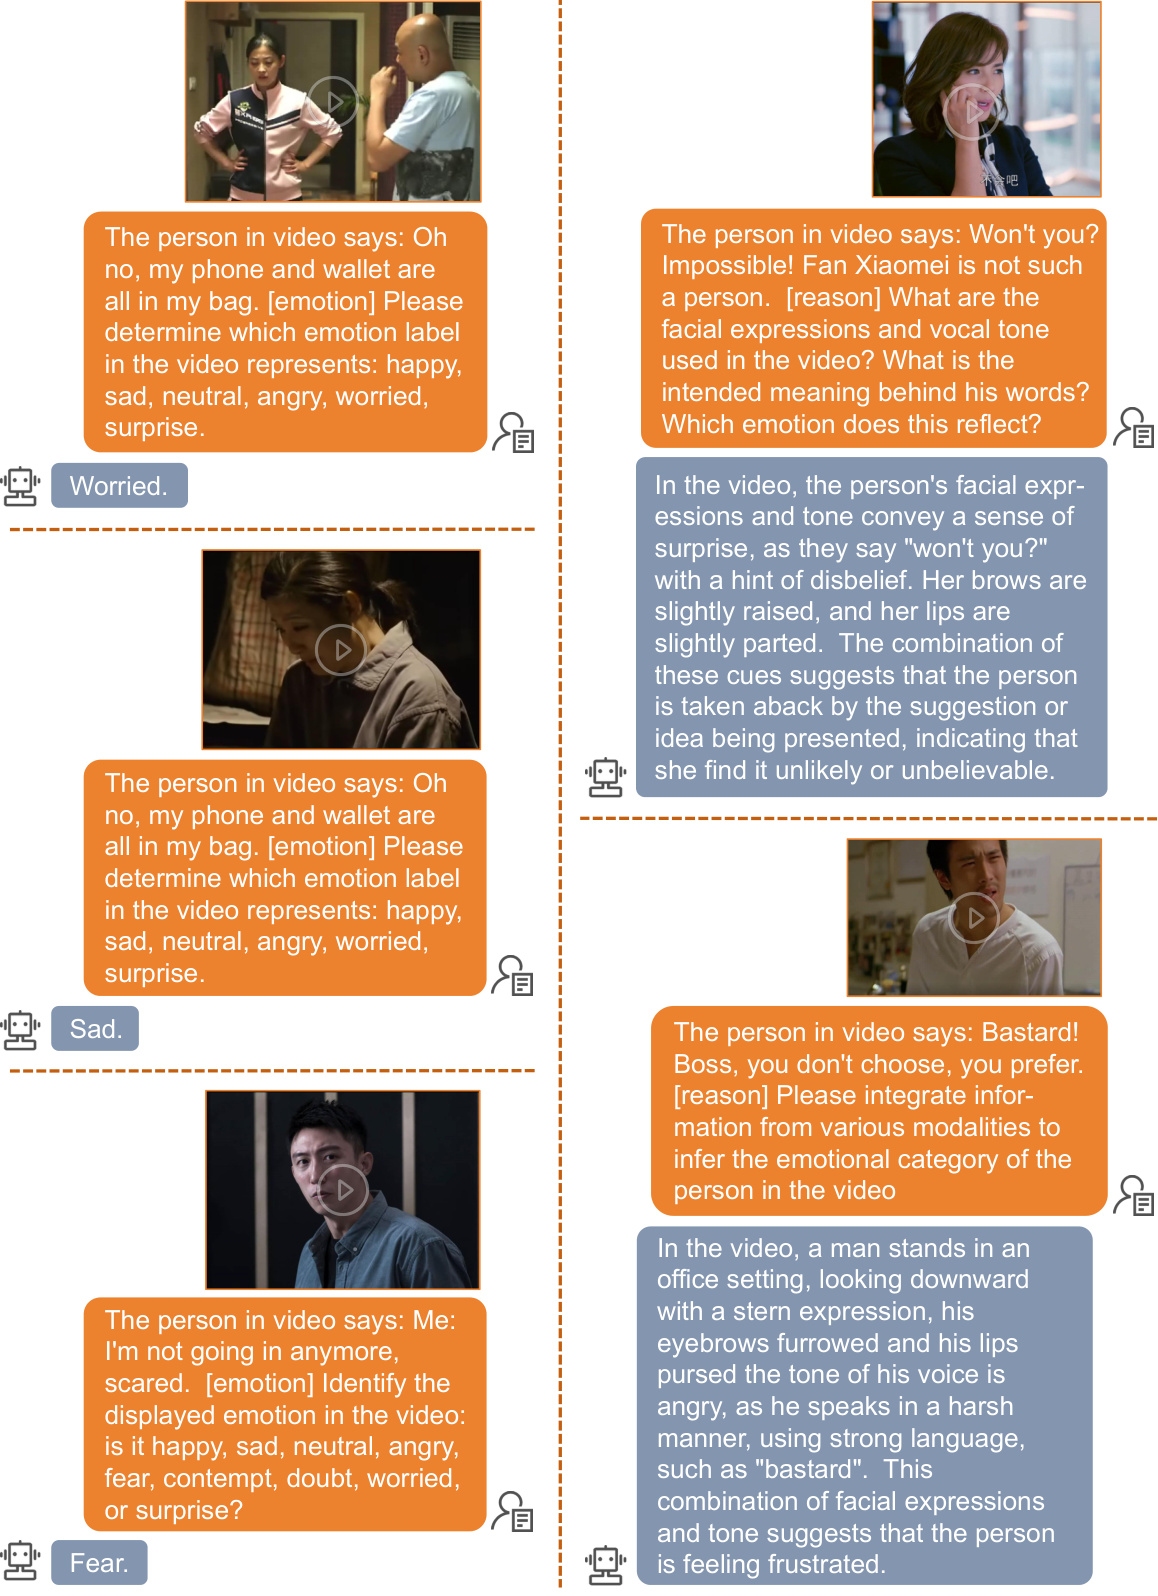
🔼 This figure compares the emotion recognition results of the Emotion-LLaMA model against other models. Each sample is presented using two bar graphs; the left graph shows results from other models, while the right shows Emotion-LLaMA’s results. The samples demonstrate Emotion-LLaMA’s ability to accurately identify subtle emotional expressions even when the visual and audio cues are less pronounced. The figure visually shows the superiority of Emotion-LLaMA in capturing and interpreting emotional nuances from different modalities.
read the caption
Figure 3: Visualization of the output probability distribution for multimodal emotion recognition by different models. Each sample is represented by two bar graphs: the left graph displays the results from other models, and the right graph shows the results from Emotion-LLaMA.
More on tables

🔼 This table compares the performance of Emotion-LLaMA with other state-of-the-art models on the DFEW dataset for both zero-shot and fine-tuned settings. It evaluates the models’ ability to recognize seven basic emotions (Happy, Sad, Neutral, Angry, Surprise, Disgust, Fear) using metrics such as Unweighted Average Recall (UAR) and Weighted Average Recall (WAR), which are particularly suitable for imbalanced datasets. The zero-shot results demonstrate Emotion-LLaMA’s generalization ability without any fine-tuning on DFEW, while fine-tuned results highlight the performance improvement achieved by fine-tuning on the target dataset.
read the caption
Table 2: Comparison of multimodal emotion recognition results on DFEW. The upper part shows zero-shot performance, while the lower part shows results after fine-tuning.

🔼 This table presents a comparison of the F1 scores achieved by different methods on the MER2023 dataset for multimodal emotion recognition. The methods vary in the modalities they utilize (audio, video, text, or a combination thereof). The table highlights the superior performance of the Emotion-LLaMA model, achieving the highest F1 score of 0.9036 when using audio, video, and text modalities.
read the caption
Table 3: Comparison of multimodal emotion recognition results on MER2023. The table shows the performance of different models across various modalities, with the highest F1 scores achieved by our proposed method.

🔼 This table compares the performance of various multimodal large language models on the MER2024 Challenge track 3, specifically focusing on the MER-OV task. MER-OV is an open-vocabulary task which means that the models are evaluated on their ability to recognize any number of emotion labels across diverse categories. The table shows the accuracy, recall, and average of accuracy and recall for each model, providing insights into their effectiveness in handling open-vocabulary multimodal emotion recognition.
read the caption
Table 4: Performance (%) of Multimodal Large Language Models on MER2024 Challenge track 3: MER-OV. The “avg” column represents the average of 'Accuracys' and 'Recalls'
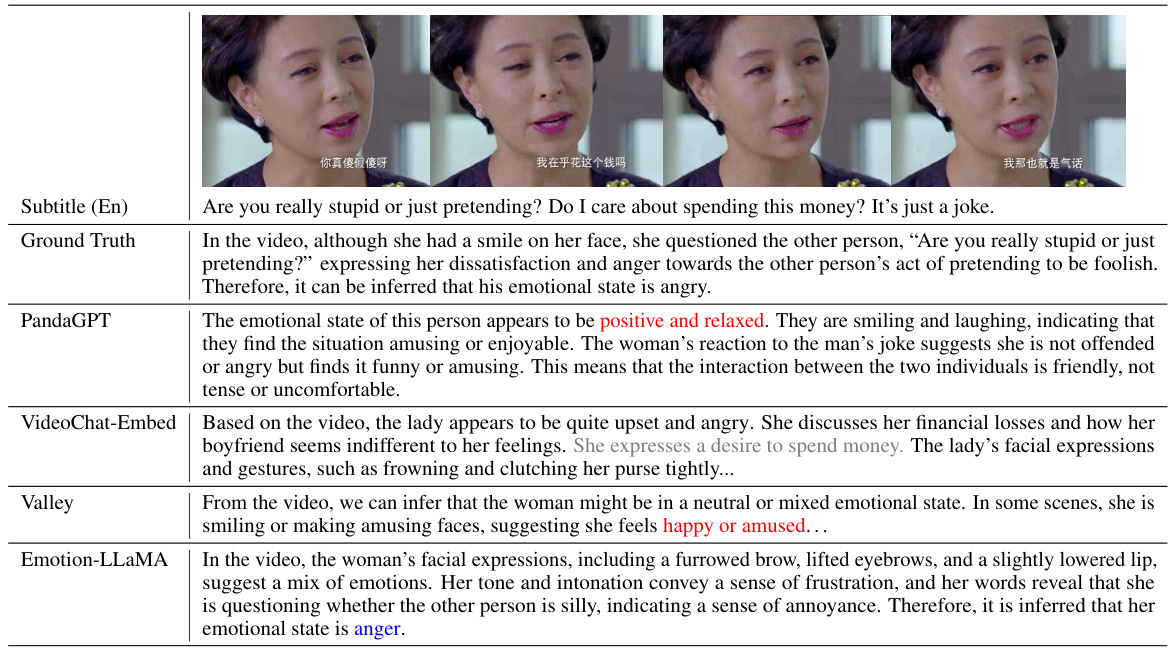
🔼 This table compares the performance of Emotion-LLaMA with other state-of-the-art Multimodal Large Language Models (MLLMs) on the EMER dataset for multimodal emotion reasoning. The EMER dataset uses human annotators to assess the quality of the models’ reasoning, focusing on three metrics: Clue Overlap (measuring the overlap between emotion-related clues in the model’s and the human’s responses), Label Overlap (measuring the overlap between summarized emotional states), and completeness of the reasoning process. Higher scores in Clue Overlap and Label Overlap indicate better performance.
read the caption
Table 1: Comparison of multimodal emotion reasoning results on the EMER dataset. Clue Overlap and Label Overlap scores range from 0 to 10.

🔼 This table presents the ablation study results focusing on the impact of different audio and visual encoders on the overall performance of the Emotion-LLaMA model. The F1 score is used as the evaluation metric to assess the model’s performance with various combinations of encoders. The results highlight the importance of using multiple modalities, including audio and multi-view visual information, for accurate emotion recognition.
read the caption
Table 6: Ablation Study Results for Different Encoders

🔼 This table presents the ablation study results, demonstrating the impact of different stages of instruction data on the Emotion-LLaMA model’s performance. It shows the results for three stages: Raw (direct concatenation of visual and audio descriptions), Coarse-grained (Emotion-LLaMA trained on coarse-grained annotations from MERR dataset), and Fine-grained (further instruction-tuning using fine-grained annotations). The Clue Overlap and Label Overlap scores indicate the model’s performance in terms of aligning emotional cues and identifying emotion labels, respectively. The table demonstrates that using the fine-grained annotations improves the model’s performance on both metrics.
read the caption
Table 7: Ablation Study Results for Different Stages of the MERR Dataset Instructions.
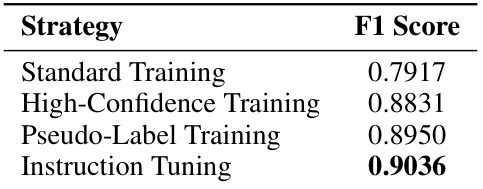
🔼 This table compares the performance of different models on the MER2023 dataset for multimodal emotion recognition. The models are evaluated across various modalities (audio, visual, text), and their performance is measured using the F1 score. The table highlights that the Emotion-LLaMA model achieves the highest F1 score, demonstrating its superior performance in this task.
read the caption
Table 3: Comparison of multimodal emotion recognition results on MER2023. The table shows the performance of different models across various modalities, with the highest F1 scores achieved by our proposed method.

🔼 This table presents the results of a human evaluation of the quality of the annotations in the MERR dataset. Five volunteers assessed the accuracy and relevance of the video descriptions for 20 randomly selected samples from each of the nine emotion categories. Each volunteer scored a total of 180 descriptions (20 samples x 9 categories). The table shows the individual scores for each volunteer, across the nine emotion categories, and the average score across all categories. The scores range from 0 to 5, representing the quality of the annotation in five levels.
read the caption
Table 9: The scores from manual evaluation of the MERR datasets for fine-grained annotation. The scores range from 0 to 5, with the Mean representing the average score across all categories.

🔼 This table compares several emotional datasets (EmoSet, EmoVIT, DFEW, MER2023, EMER) against the proposed MERR dataset. It highlights the differences in terms of the quantity of data, whether they include audio, visual objective and visual expression descriptions, if there are classification labels and finally if there are multimodal descriptions. The comparison emphasizes the richness of the MERR dataset, which provides more comprehensive annotations suitable for multimodal emotion recognition and reasoning.
read the caption
Table 15: Comparison of emotional datasets. The table presents a comparative analysis of several key emotional datasets, including DFEW, MER2023, EMER, and MERR. It highlights the unique features and contributions of each dataset, such as the range of emotion categories, availability of multimodal annotations, and dataset size. This comparison underscores the significance of the MERR dataset in advancing multimodal emotion recognition and reasoning research.
🔼 This table compares several key emotional datasets (DFEW, MER2023, EMER, MERR) based on several factors: quantity of samples, presence of audio/visual/textual descriptions, availability of visual expression descriptions and classification labels, and the availability of multimodal descriptions. It highlights the relative strengths and weaknesses of each dataset for emotion recognition and reasoning research and emphasizes the unique contribution of the MERR dataset.
read the caption
Table 15: Comparison of emotional datasets. The table presents a comparative analysis of several key emotional datasets, including DFEW, MER2023, EMER, and MERR. It highlights the unique features and contributions of each dataset, such as the range of emotion categories, availability of multimodal annotations, and dataset size. This comparison underscores the significance of the MERR dataset in advancing multimodal emotion recognition and reasoning research.
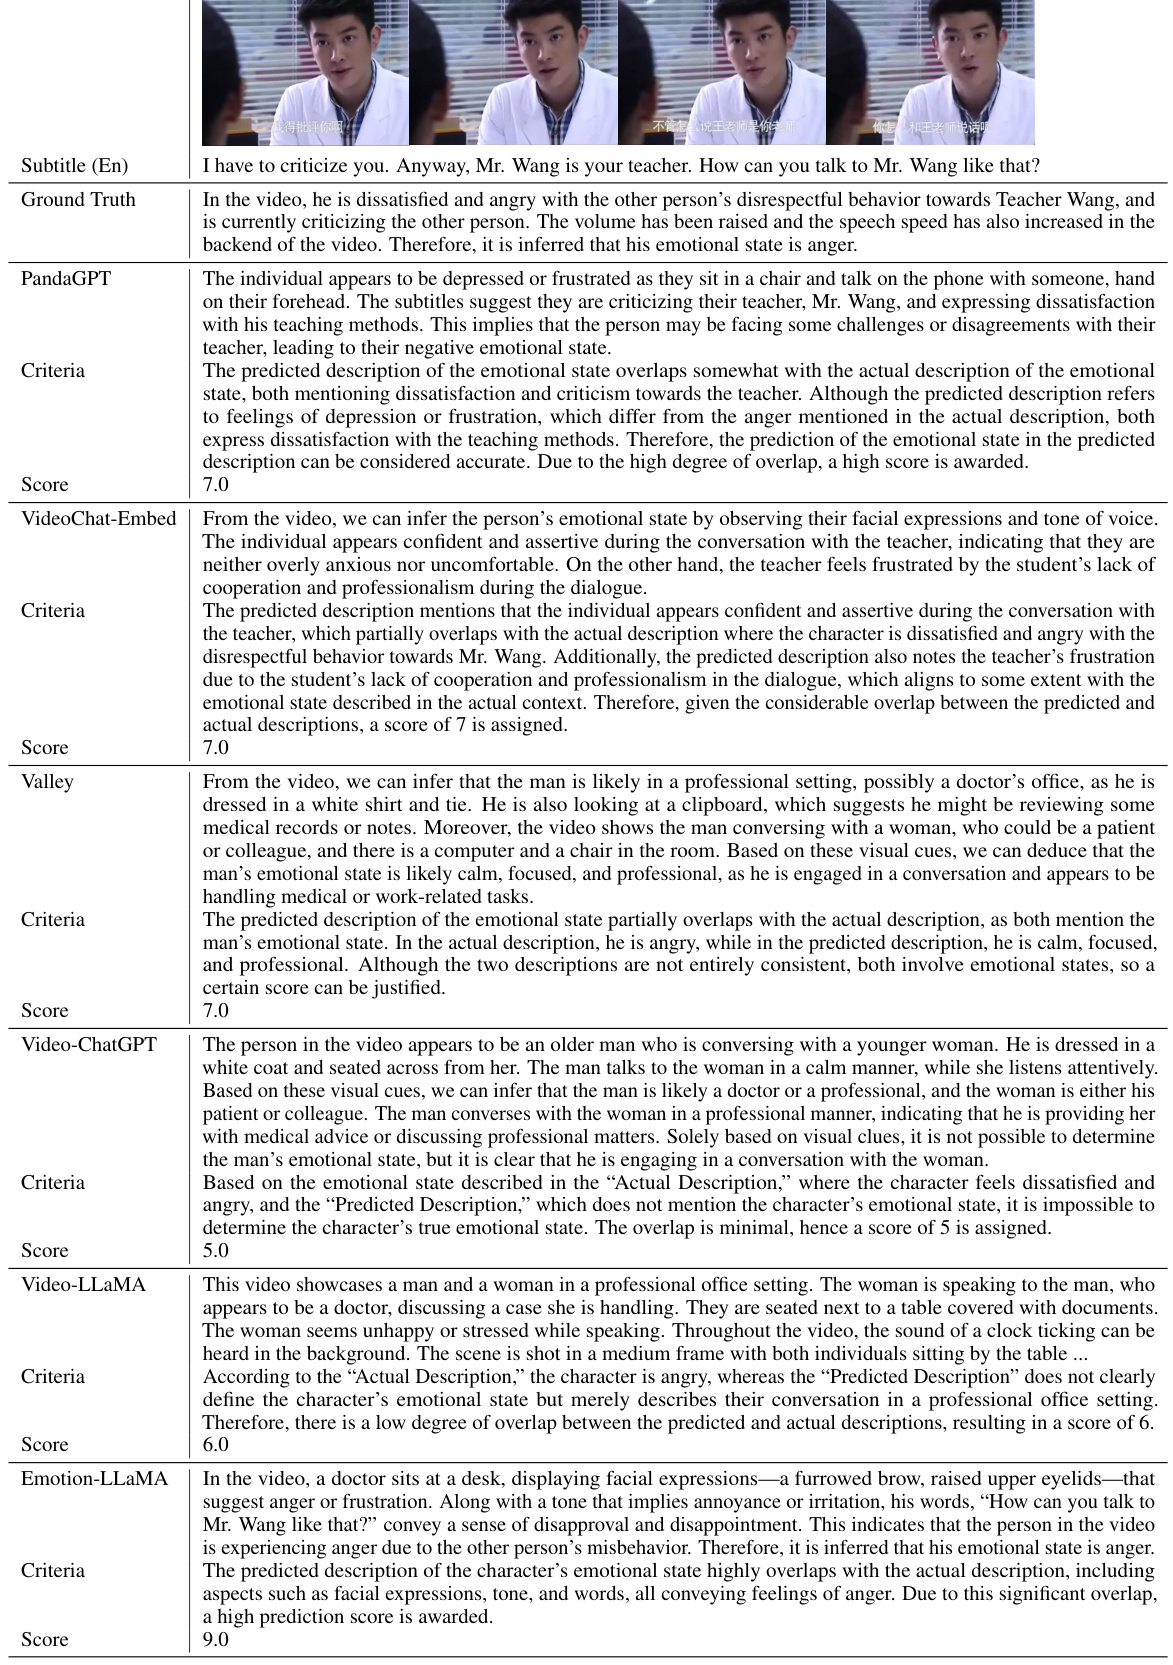
🔼 This table presents the results of a comparative analysis of different multimodal large language models’ performance on the EMER dataset, focusing on two key metrics: Clue Overlap and Label Overlap. These metrics assess the models’ abilities to reason about emotions by evaluating the overlap between the models’ generated reasoning and the ground truth reasoning provided in the dataset. Higher scores on both metrics indicate better emotion reasoning capabilities. The table allows for a comparison of Emotion-LLaMA’s performance against other state-of-the-art models.
read the caption
Table 1: Comparison of multimodal emotion reasoning results on the EMER dataset. Clue Overlap and Label Overlap scores range from 0 to 10.
Full paper#


