↗ OpenReview ↗ NeurIPS Homepage ↗ Chat
TL;DR#
Zero-shot learning models, while popular, suffer from biases inherited from their large-scale pretraining data. One major issue is the mismatch between the label distribution of the pretraining data and the downstream task, often leading to poor performance. Existing methods require labeled downstream data or knowledge of the pretraining distribution, making them impractical for real-world applications.
This paper introduces OTTER, a simple, lightweight technique using optimal transport to address this problem. OTTER only needs an estimate of the downstream task’s label distribution to adjust the model’s predictions. The authors provide theoretical guarantees for OTTER’s performance, and the empirical results across several image and text classification datasets show significant accuracy improvements, often surpassing existing approaches. OTTER offers a practical and efficient solution to improve zero-shot learning performance
Key Takeaways#
Why does it matter?#
This paper is important because it presents OTTER, a novel and efficient method to improve the accuracy of zero-shot models. Zero-shot learning is a rapidly growing field, and this work addresses a critical challenge by adapting the model predictions to a new task without needing extra labeled data or the knowledge of the true label distribution of pretraining data. This approach is more effective than traditional methods and provides theoretical guarantees, making it a valuable contribution to the zero-shot learning community. The method’s simplicity and effectiveness could accelerate the deployment of zero-shot models to new applications.
Visual Insights#

The figure shows a bar chart comparing the predicted label distributions of two CLIP models (RN50 and ViT-B/16) against the ground truth distribution for three pet breeds (Abyssinian, Persian, and Pug) in the Oxford-IIIT-Pet dataset. It highlights the issue of label distribution mismatch in zero-shot learning, where the distribution of labels in the pre-trained model differs significantly from the true distribution in the downstream task. This mismatch leads to biased predictions, with some classes (e.g., Persian) being significantly under-represented in the model’s predictions compared to their actual prevalence.

This table presents the results of zero-shot image and text classification experiments using two different models (ViT-B/16 for images and BERT for text). It compares the accuracy of three methods: Zero-shot, Prior Matching (a baseline method), and OTTER (the proposed method). The true label distribution was used as the label distribution specification for OTTER. The table shows that OTTER significantly outperforms both Zero-shot and Prior Matching across a wide range of datasets, achieving an average improvement of 4.9% for image classification and 15.5% for text classification.
In-depth insights#
OTTER Algorithm#
The OTTER algorithm, as described in the provided research paper, is a novel approach for addressing label distribution mismatch in zero-shot learning models. It leverages optimal transport (OT) to adjust model predictions without needing additional training data or knowledge of the pretrained model’s label distribution. Instead, it only requires an estimate of the downstream task’s label distribution. The core idea is to transport predicted labels to the optimal downstream classes, minimizing the overall cost. Theoretically, the paper demonstrates that under certain conditions, OTTER can recover the Bayes-optimal classifier. The algorithm’s simplicity and efficiency are key strengths, especially considering the limitations of existing approaches for handling this common problem in zero-shot learning. Empirical validation on various image and text classification tasks shows significant performance improvements, outperforming baselines in a majority of datasets. The OTTER algorithm presents a practical and effective solution for mitigating the bias introduced by mismatched label distributions in the zero-shot setting.
Empirical Results#
An effective ‘Empirical Results’ section in a research paper would thoroughly demonstrate the proposed method’s performance. It should present results across various datasets and settings to showcase generalizability and robustness. Clear visualizations, such as graphs and tables, are crucial for easy understanding and comparison. The section should go beyond simple accuracy metrics; it needs to analyze the method’s behavior under different conditions, perhaps including error analysis or ablation studies. Statistical significance should be rigorously addressed to establish the reliability of the findings. A strong section would also provide a detailed comparison to relevant baselines, highlighting the proposed method’s advantages and limitations. Quantitative metrics are important, but a comprehensive discussion that connects the quantitative results to the underlying hypotheses and the broader context of the work is paramount. Finally, the results should be interpreted thoughtfully, acknowledging limitations and suggesting future directions for research.
Theoretical Bounds#
A theoretical bounds section in a research paper provides a rigorous mathematical justification for the claims made. It usually involves deriving upper and lower bounds on the performance of a proposed method or algorithm. These bounds are crucial for demonstrating the effectiveness of the approach, particularly when compared to existing techniques. Ideally, tight bounds are preferred, indicating high precision in the theoretical analysis. The derivation of bounds often requires making simplifying assumptions about the problem domain or data distribution, and the section should clearly state these assumptions. Limitations in the theoretical analysis due to these assumptions and their potential impact on the results should be discussed honestly. The types of bounds presented can vary depending on the specific problem, including worst-case error bounds, average-case error bounds, and probabilistic bounds. A strong theoretical bounds section enhances the credibility of the research by providing mathematical guarantees, complements the experimental results, and reveals valuable insights about the algorithm’s fundamental limitations and strengths.
Label Shift Issue#
The label shift issue, a pervasive challenge in machine learning, particularly impacts zero-shot models. Zero-shot models, trained on massive, web-scale datasets, often inherit a label distribution that significantly differs from the target task’s distribution. This mismatch arises due to the inherent biases present in the large-scale datasets. These models struggle to generalize effectively as they’ve learned associations skewed by the skewed training data. Addressing this requires techniques that adapt model predictions to the target task’s label distribution without relying on labeled data from the target domain or needing knowledge of the training data’s true label balance. This constraint makes typical domain adaptation or fine-tuning methods inapplicable. Therefore, strategies focusing on reweighting predictions or utilizing optimal transport offer promising paths to correct for the label distribution discrepancy. The effectiveness of such techniques depends heavily on accurately estimating the target label distribution and handling any uncertainty or noise in that estimation. Ultimately, tackling label shift fundamentally requires a deeper understanding and mitigation of bias during the training phase itself.
Future Extensions#
The ‘Future Extensions’ section of a research paper presents opportunities for future research. It should thoughtfully discuss potential advancements building upon the current work. Extending the methodology to handle noisy or incomplete label distributions is crucial, as real-world datasets rarely provide perfectly clean labels. Exploring different cost functions within the optimal transport framework could improve the model’s adaptability to various tasks. Investigating the influence of various hyperparameters on model performance is essential to fine-tune the approach for optimal efficiency. Incorporating additional data modalities (e.g., incorporating temporal or spatial information) can enrich the analysis and enhance model generalization to different scenarios. Furthermore, a thorough examination of the model’s robustness against adversarial attacks is vital for practical applications. Finally, applying the approach to other domains such as natural language processing or time series analysis would broaden the impact and relevance of the research. A robust ‘Future Extensions’ section would clearly articulate these avenues for future research.
More visual insights#
More on figures

This figure displays the results of synthetic experiments evaluating the performance of different methods under varying degrees of label shift. The x-axis shows the total variation distance between the source and target distributions, indicating the severity of the label shift. The y-axis represents the prediction accuracy. Different lines represent different methods (Naive, Bayes, OTTER with different noise levels). The results demonstrate that OTTER significantly outperforms the baseline methods, especially when label shift is substantial.

This figure shows the results of synthetic experiments evaluating the performance of different methods under varying degrees of label shift. The x-axis represents the total variation distance between the source and target distributions, indicating the severity of the label shift. The y-axis shows the prediction accuracy. Different curves represent different classification methods (Naive, Bayes-optimal, OTTER with different noise levels). The results demonstrate that OTTER significantly outperforms baseline methods, especially when the label shift is substantial.

The figure shows the results of synthetic experiments to evaluate the performance of different methods under label shift. The x-axis represents the total variation distance between the source and target distributions (a measure of label shift severity). The y-axis represents the prediction accuracy. Different lines represent different methods (naive, Bayes optimal, OTTER with various noise levels). The results demonstrate that OTTER significantly outperforms the baseline, particularly when the label shift is more pronounced.

The figure shows a bar chart comparing the predicted label distributions of two CLIP models (RN50 and ViT-B/16) against the ground truth distribution for three pet classes (Abyssinian, Persian, and Pug) in the Oxford-IIIT-Pet dataset. The models, pretrained on a large, imbalanced dataset, show a significant bias in their predictions, allocating disproportionately high probabilities to certain classes compared to the uniform distribution of the ground truth. This highlights the problem of label distribution mismatch in zero-shot learning, where the label distribution of the pretrained data differs from the target task data, leading to biased predictions.

The figure shows the results of synthetic experiments conducted to evaluate the impact of label shift and noise on the performance of various methods (Naive, Bayes, OTTER with different noise levels). The x-axis represents the total variation distance (a measure of dissimilarity) between the source and target label distributions, illustrating the severity of label shift. The y-axis represents the prediction accuracy. The curves demonstrate that OTTER consistently outperforms the baseline methods, particularly when the label shift is more pronounced.

The figure shows the results of synthetic experiments comparing the performance of different methods (Naive, Bayes, OTTER with different noise levels) under varying degrees of label shift (x-axis: total variation distance between source and target distributions). The y-axis represents prediction accuracy. It demonstrates OTTER’s robustness to label shift, especially when compared to the baseline (Naive classifier). The results show that OTTER significantly outperforms the baseline when label shift is severe, indicating its effectiveness in handling label distribution mismatch.

This figure shows the results of a synthetic experiment designed to evaluate the performance of R-OTTER in handling label shift. The x-axis represents the total variation distance between the source and target label distributions, which is a measure of the severity of the label shift. The y-axis represents the classification accuracy. The plot shows the accuracy of four different methods: Naive classifier, Bayes optimal classifier, OTTER, and R-OTTER. As expected, R-OTTER’s performance closely matches that of the Bayes optimal classifier, indicating its effectiveness in addressing label shift. In comparison, the Naive classifier exhibits a significant decrease in accuracy as the label shift increases.
More on tables

This table presents the results of zero-shot image and text classification experiments using two different models (ViT-B/16 for images and BERT for text). The performance of OTTER is compared against a baseline method (Prior Matching) across various datasets. The numbers in parentheses show standard deviations. The table highlights that OTTER consistently outperforms the baseline, improving accuracy by an average of 4.9% for image classification and 15.5% for text classification.

This table presents the results of zero-shot image and text classification experiments using two different models (ViT-B/16 for images and BERT for text). It compares the performance of three methods: Zero-shot (baseline), Prior Matching (a competing method), and OTTER (the proposed method). The results show OTTER significantly outperforms the other methods, demonstrating substantial improvements in accuracy across a range of datasets.

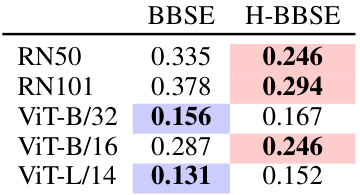
This table presents the results of using hierarchical OTTER (H-OTTER) on image classification tasks using the CLIP model. It shows that incorporating class hierarchy information can improve the accuracy of the zero-shot model. The improvements range up to 5.1% compared to the standard OTTER approach. Different CLIP model versions (RN50, RN101, and various ViT models) were tested. The accuracy and standard deviation are shown for each model.

This table presents the accuracy results of zero-shot image classification using ViT-B/16 and text classification using BERT. The results compare the performance of three methods: zero-shot classification (baseline), Prior Matching, and the proposed OTTER method. The true label distribution was used for the label distribution specification. The table shows accuracy improvements across different datasets for OTTER, significantly outperforming Prior Matching in most cases.

This table presents the results of zero-shot image and text classification experiments using two different models, ViT-B/16 for images and BERT for text. It compares the accuracy of three methods: zero-shot prediction (baseline), Prior Matching, and the proposed OTTER method. The results show significant improvements in accuracy using OTTER across a wide variety of datasets, surpassing prior matching in nearly every case, and demonstrating the effectiveness of the method in addressing label distribution mismatch.

This table presents the results of zero-shot image and text classification experiments using two different models, ViT-B/16 and BERT respectively. The accuracy of both Prior Matching and OTTER are shown for each dataset. The results highlight that OTTER consistently outperforms Prior Matching, achieving a significant accuracy improvement on average. The use of the true label distribution as a specification for the label distribution is also noted. Standard deviation for Prior Matching is reported over 10 different samplings of validation sets.

This table presents the results of zero-shot image and text classification experiments using two different models, ViT-B/16 for images and BERT for text. It compares the accuracy of three methods: a standard zero-shot approach, Prior Matching (PM), and the proposed OTTER method. The true label distribution was used as the label distribution specification for OTTER. The results show that OTTER significantly outperforms both the standard zero-shot approach and Prior Matching, achieving an average accuracy increase of 4.9% for image classification and 15.5% for text classification.

This table presents the accuracy of zero-shot image and text classification using different models (ViT-B/16 for images and BERT for text). It compares the performance of three methods: standard zero-shot classification, Prior Matching (a baseline method), and OTTER (the proposed method). The results show that OTTER significantly improves accuracy over both the standard zero-shot method and the baseline, particularly in text classification. The table highlights OTTER’s effectiveness across a wide range of datasets.

This table presents the results of zero-shot image and text classification experiments using two different models (ViT-B/16 for images and BERT for text). It compares the accuracy of three methods: a standard zero-shot approach, a prior matching baseline, and the proposed OTTER method. The results show that OTTER significantly outperforms both the zero-shot baseline and the prior matching method across a wide range of datasets. The table also includes standard deviations for the prior matching results.

This table presents the results of zero-shot image and text classification experiments using two different models, ViT-B/16 for images and BERT for text. It compares the performance of three methods: a zero-shot baseline, a prior matching method, and the proposed OTTER method. The results show OTTER significantly outperforms the other methods across most datasets, indicating its effectiveness in improving zero-shot accuracy.

This table presents the results of zero-shot image and text classification experiments using two different models: ViT-B/16 for images and BERT for text. The accuracy of the OTTER method is compared against a baseline method (Prior Matching) across various datasets. The results show significant improvement by OTTER over the baseline, especially in text classification, while using the true label distribution for the label distribution specification. Parenthetical values for Prior Matching reflect the standard deviation based on 10 different validation set samplings.

This table presents the results of zero-shot image and text classification experiments using two different models, ViT-B/16 for images and BERT for text. It compares the accuracy of three methods: Zero-shot (baseline), Prior Matching, and the proposed OTTER method. The results show that OTTER significantly improves the accuracy compared to the baseline and often outperforms Prior Matching, highlighting the effectiveness of OTTER in addressing label distribution mismatch in zero-shot scenarios. The use of the true label distribution as a specification is also noted. Standard deviations are reported for Prior Matching, reflecting multiple validation set samplings.

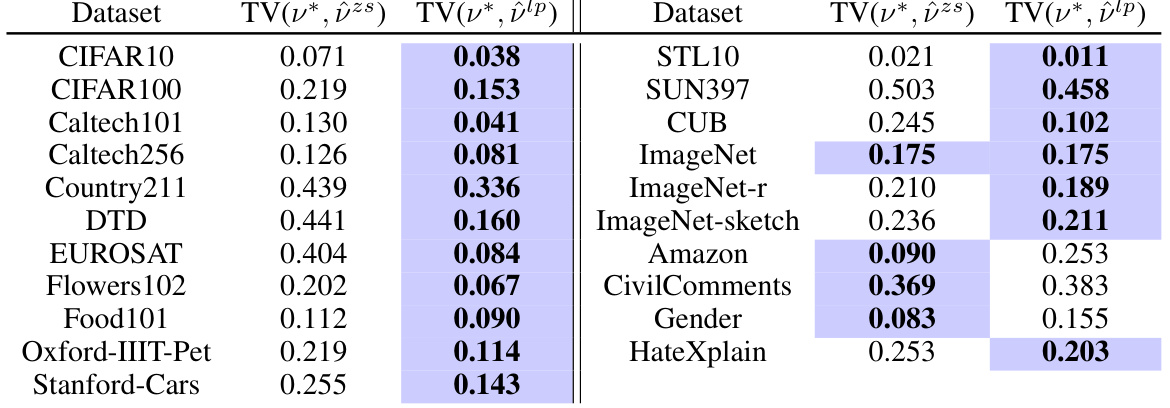
This table presents the total variation distance between the true label distribution and estimations using BBSE (Black Box Shift Estimation) with zero-shot prediction scores and linear probing prediction scores. It shows how well BBSE estimates the true class balance for different datasets. Lower values indicate better estimation accuracy.

This table presents the results of zero-shot image and text classification experiments using two different models (ViT-B/16 for images and BERT for text). It compares the accuracy of OTTER against a baseline method (Prior Matching) across various datasets. The results demonstrate OTTER’s significant improvement in accuracy, especially compared to the baseline.
Full paper#


