↗ OpenReview ↗ NeurIPS Homepage ↗ Hugging Face ↗ Chat
TL;DR#
Decoding human vision from brain signals is a long-standing challenge. While fMRI has shown promise, its high cost and low temporal resolution limit its use in BCIs. EEG, being portable and inexpensive, offers a more practical solution, but its low signal quality and spatial resolution hinder performance. Existing approaches using EEG for visual decoding have not yet reached fMRI-level performance.
This work introduces a novel zero-shot EEG-based framework for visual decoding and reconstruction. The key innovation is a tailored brain encoder and a two-stage image generation strategy. This approach significantly improves the accuracy of three downstream tasks: classification, retrieval, and reconstruction. It demonstrates the potential of EEG for building highly effective BCIs for visual applications, surpassing previous EEG-based approaches and closing the performance gap with fMRI.
Key Takeaways#
Why does it matter?#
This paper is highly important as it presents a novel zero-shot framework for visual decoding and reconstruction using EEG, addressing the limitations of fMRI and previous EEG methods. It opens new avenues for brain-computer interface (BCI) development, particularly in visual applications, and offers valuable neuroscience insights into the relationship between brain activity and visual perception. The high temporal resolution of EEG, combined with the innovative framework, makes this research highly relevant to the current trends in neuroscience and machine learning.
Visual Insights#

This figure illustrates the EEG/MEG-based zero-shot brain decoding and reconstruction framework. The left panel shows a schematic of the three visual decoding tasks (classification, retrieval, and generation) performed using EEG/MEG data obtained during natural image stimulation. The right panel showcases example images that were reconstructed from EEG/MEG signals using the proposed framework. The figure visually represents the system’s ability to decode and reconstruct visual information from brain activity.

This table presents a quantitative comparison of the reconstruction quality achieved using EEG, MEG, and fMRI data for Subject 8. Several metrics are used to evaluate the quality of the reconstructed images, including Pixel Correlation (PixCorr), Structural Similarity Index (SSIM), and scores from AlexNet (layers 2 and 5), Inception, CLIP, and SwAV. Higher scores generally indicate better reconstruction quality.
In-depth insights#
EEG Visual Decoding#
EEG visual decoding explores the fascinating intersection of neuroscience and machine learning, aiming to decipher visual information directly from brain signals recorded via electroencephalography (EEG). This non-invasive approach offers a significant advantage over fMRI, which is expensive and has low temporal resolution. The challenge lies in the inherent limitations of EEG: low spatial resolution, high noise levels, and substantial inter-subject variability. Current methods leverage advanced machine learning techniques, including deep learning models like convolutional neural networks and transformers, and contrastive learning to extract meaningful feature representations from EEG data. These embeddings are then used in downstream tasks like image classification, retrieval, and even image reconstruction. A key area of innovation involves designing robust and adaptable EEG encoders tailored to handle the noisy and variable nature of EEG signals. This includes incorporating spatial and temporal information, channel-wise attention mechanisms and more efficient model architectures to enhance decoding performance. Despite progress, a major challenge remains in achieving decoding accuracy comparable to fMRI-based methods, which necessitates continued research in encoder design, feature representation, and alignment with image embeddings, potentially exploring multi-modal approaches that integrate with other neuroimaging modalities. The potential applications are transformative, ranging from advancements in brain-computer interfaces to a deeper understanding of the human visual system.
ATM Encoder Design#
The Adaptive Thinking Mapper (ATM) encoder is a crucial innovation in this EEG-based visual decoding framework. Its design cleverly integrates several components to effectively capture and represent complex spatiotemporal neural signals. Channel-wise attention mechanisms are used to weigh the importance of different EEG channels, thereby focusing on the most relevant information. The integration of temporal-spatial convolutions addresses the unique challenges of EEG data—low spatial resolution and high temporal resolution—by effectively aggregating information across both time and space. This design is a significant step forward in EEG processing, surpassing earlier methods that primarily relied on simplistic convolutional layers or recurrent networks. The flexibility of ATM is also a strength; its modular architecture, with easily swappable components, makes it highly adaptable to different EEG datasets and experimental setups. Its modularity, therefore, allows researchers to easily tailor the encoder to the specific demands of their research without significant changes to the overall framework. The plug-and-play architecture allows for straightforward experimentation with different components and comparisons between them. Overall, the ATM design represents a sophisticated and adaptable approach to EEG encoding, pushing the boundaries of brain-computer interface technology.
Two-Stage Generation#
The proposed two-stage generation framework represents a notable advancement in EEG-based image reconstruction. Stage one leverages a prior diffusion model to refine EEG embeddings into image priors, effectively capturing high-level semantic information. Stage two integrates these priors with low-level features (extracted directly from EEG) and refined CLIP embeddings to generate a final image using a pre-trained diffusion model. This two-stage approach is crucial as it addresses the limitations of directly reconstructing images from EEG data, which often suffers from low spatial resolution and noise. By separating high-level and low-level reconstruction stages, the method enhances both the semantic consistency and the visual fidelity of the reconstructed image. The framework showcases the power of combining different models and data modalities, leading to significant improvements in reconstruction accuracy. The integration of CLIP embeddings further bridges the gap between neural representations and image understanding, resulting in a system capable of generating highly realistic and semantically consistent image reconstructions from EEG input.
Temporal Dynamics#
Analyzing temporal dynamics in brain activity related to visual processing is crucial for understanding the neural mechanisms underlying visual perception. The temporal resolution of EEG is a key advantage, allowing researchers to examine the precise timing of neural responses to visual stimuli. Studies focusing on temporal dynamics often employ time-frequency analysis, such as wavelet transforms or time-frequency representations, to track the changes in power and phase of neural oscillations across time. By investigating these changes, researchers can uncover how different brain regions interact and coordinate over time to process visual information. Temporal aspects of EEG responses can reveal how the brain segments and integrates information from multiple sources. For instance, the initial response might reflect basic feature extraction, while subsequent activity could be related to higher-order processing and decision-making. Additionally, comparing temporal patterns across various visual conditions (such as different image categories or tasks) can offer insights into the neural mechanisms that underlie how the brain distinguishes and classifies visual inputs. Furthermore, the precise timing of neural responses varies across brain regions, highlighting the intricate interplay among distinct cortical areas in the visual system. Finally, the study of temporal dynamics provides a deeper understanding of the brain’s processing efficiency and limitations.
Future of EEG-BCI#
The future of EEG-BCIs is incredibly promising, driven by advancements in machine learning, signal processing, and neurotechnology. Higher-density EEG systems will offer improved spatial resolution, enabling more precise decoding of brain activity. Advanced machine learning models, like deep learning architectures, will be crucial for accurately interpreting complex EEG signals, leading to more robust and reliable BCIs. New signal processing techniques will enhance signal-to-noise ratios and mitigate artifacts. Improved electrode designs could also lead to more comfortable and long-term wearable BCIs. Beyond motor control, future EEG-BCIs may enable direct brain-computer communication, facilitating the control of prosthetics, assistive devices, and even environmental interactions. Ethical considerations surrounding data privacy, security, and potential misuse will be paramount. Research into personalized BCIs, tailored to individual brain patterns, will be needed to maximize efficacy and improve the user experience. Despite challenges, the potential for EEG-BCIs to transform healthcare and human-computer interaction is immense.
More visual insights#
More on figures

This figure illustrates the overall framework for visual decoding and reconstruction using EEG/MEG data. It shows how EEG signals are encoded using an EEG encoder (which is a flexible component and can be replaced with different architectures). The encoded EEG features are then aligned with image features (using CLIP). This alignment allows for zero-shot image classification and retrieval. Furthermore, a two-stage generation process reconstructs images from the aligned EEG features, involving a prior diffusion model for high-level features and a separate process for low-level features which are combined to produce the final reconstructed image.

This figure details the architecture of the Adaptive Thinking Mapper (ATM), a novel EEG encoder. It shows how raw EEG signals are processed through several stages: an embedding layer that converts the EEG data into tokens, a channel-wise attention layer to focus on relevant EEG channels, a temporal-spatial convolution module for capturing both temporal and spatial relationships, and finally an MLP projector to output a fixed-size EEG embedding. The use of different components is highlighted, and the overall flow illustrates the process of converting raw EEG data into meaningful feature representations suitable for downstream tasks.

This figure compares the performance of nine different EEG/MEG encoders on two datasets (THINGS-EEG and THINGS-MEG) for visual decoding tasks. The left panel shows the results for the THINGS-EEG dataset, while the right panel shows the results for the THINGS-MEG dataset. The visual decoding tasks include classification and retrieval, as well as image generation. The performance metrics shown are within-subject and cross-subject accuracy for classification and retrieval, and the quality of generated images. The results demonstrate that the proposed ATM encoder outperforms the other eight encoders.

This figure shows the results of EEG-based image retrieval and classification experiments. Panel (a) illustrates the experimental setup, showing how EEG signals are used to perform both classification (identifying the category of an image) and retrieval (finding images similar to a seen image). Panel (b) displays examples of the top-five most similar images retrieved for a given EEG signal. Panels (c) and (d) present bar graphs comparing the performance of different EEG encoding models across multiple experimental conditions (2-way, 4-way, 10-way classification/retrieval). These graphs show that the proposed ATM model performs the best in both classification and retrieval tasks compared to other existing methods.

This figure illustrates the two-stage EEG-guided image generation pipeline. Panel (a) shows the overall process: EEG data is fed into an encoder to generate EEG embeddings, which are then used by a two-stage generation process to create images. The first stage generates prior CLIP embeddings based solely on EEG input, and the second stage uses both high-level CLIP embeddings and low-level image features from the EEG to refine the image using a pre-trained diffusion model. Panel (b) presents a comparison of similarity distributions between randomly selected image-EEG pairs and generated image-EEG pairs. The similarity distributions are compared to highlight the effectiveness of the approach. Panel (c) shows example pairs of original images and their reconstructions. Finally, panel (d) shows how the balance between similarity and diversity of the generated images changes according to the guidance scale used in the generation process.

This figure analyzes the impact of different EEG/MEG time windows on visual decoding performance. It shows the retrieval accuracy for expanding time windows, comparing two methods of selecting the time window ([0,t] and [t-100,t]). The figure also displays reconstructed images at various time points, illustrating the stabilization of image quality above 200ms. MEG data shows similar results but extends over a longer time period.

This figure demonstrates the impact of different brain regions on EEG-based visual decoding and reconstruction. Panel (a) shows how EEG electrodes are divided into five brain regions (frontal, central, temporal, parietal, occipital). Panel (b) presents the accuracy of top-1 and top-5 image retrieval, comparing performance when using EEG data from individual regions against using data from all regions combined. Panel (c) displays reconstructed images using EEG signals from each brain region separately and from all regions together, illustrating the contribution of each region to the overall reconstruction quality. The occipital region shows the best performance in both retrieval and reconstruction tasks.

This figure compares the performance of nine different EEG/MEG encoders on two datasets: THINGS-EEG and THINGS-MEG. The left panel shows the performance on the THINGS-EEG dataset, broken down into within-subject and cross-subject results for image classification, retrieval (top 1 and top 5), and image generation. The right panel shows similar results for the THINGS-MEG dataset. The ATM-S encoder (the authors’ method) consistently outperforms other encoders across various tasks and evaluation metrics.

This figure compares the image reconstruction results using a one-stage method (directly from EEG embeddings) versus a two-stage method (using a prior diffusion model to generate image embeddings before reconstruction). The two-stage approach shows improved results in reconstructing both semantic and low-level visual features of the original images, as demonstrated by visual examples and retrieval task performance improvements.

This figure shows examples of image reconstructions for Subject 8 using different combinations of the CLIP, semantic, and low-level pipelines. It demonstrates how using different components impacts the quality and details of the resulting images. The ‘Seen Image’ column displays the original images shown to the subject. The remaining columns each show reconstructions using a different combination of image generation pipelines.

This figure provides a high-level overview of the proposed EEG/MEG-based zero-shot brain decoding and reconstruction framework. The left panel illustrates the three main decoding tasks: classification, retrieval, and generation, showing how visual perception sequences are encoded into brain embeddings using EEG/MEG data. The right panel showcases example reconstructed images generated by the model, demonstrating its capability to translate brain activity into visual representations.

This figure shows the results of a concept analysis performed on the EEG embeddings. The left panel (a) illustrates the process: EEG embeddings are fed into a concept encoder to produce 42-dimensional vectors representing different concepts. These are then compared to the actual concepts associated with the original images, revealing high similarity. Panel (b) shows a similarity matrix representing the correlation between the EEG-derived concept embeddings and the true concept embeddings, demonstrating a strong relationship. Panel (c) displays a clustered similarity matrix after applying k-means clustering (k=5) to the concept embeddings, showing improved clarity in the relationships.

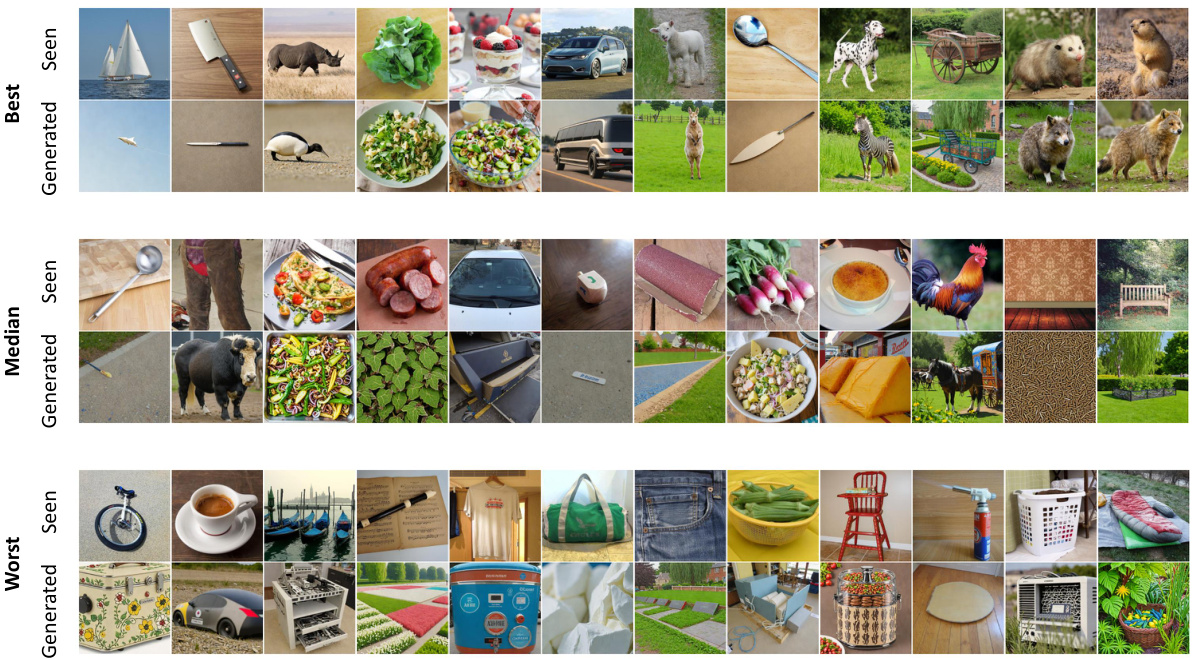
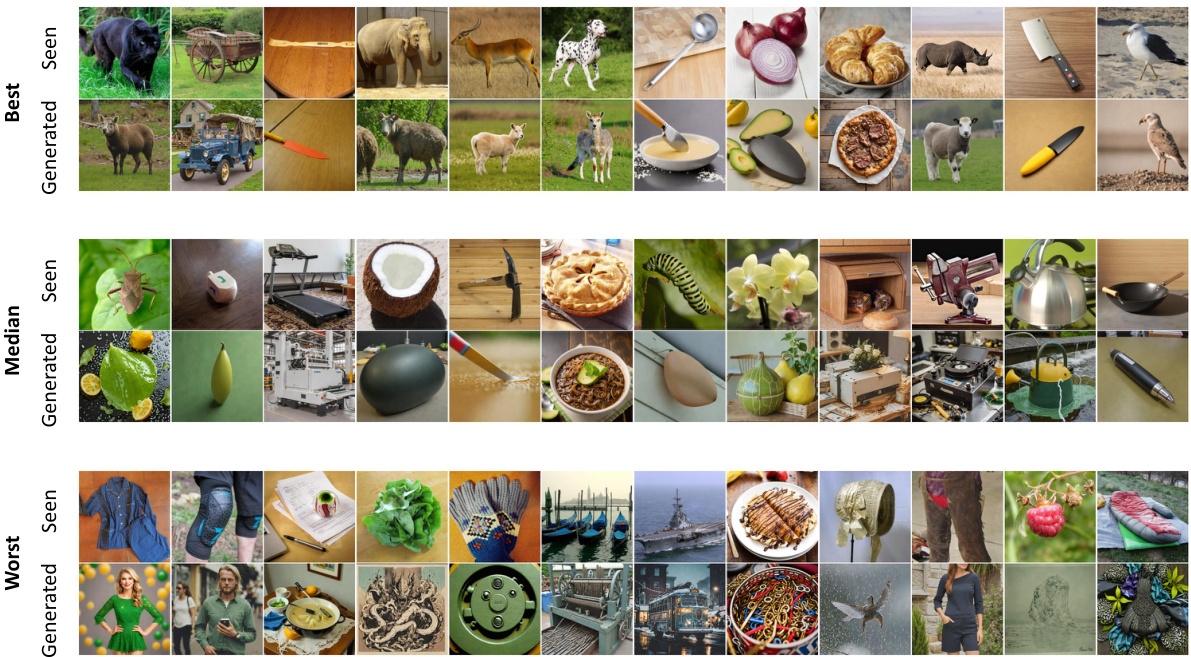
This figure shows the results of the EEG-guided visual reconstruction. The figure is divided into three rows: best, median and worst. Each row contains 12 pairs of images showing the original image seen by subjects and the corresponding reconstructed images generated using the two-stage image generation model proposed in the paper. This visualization helps to understand the performance and quality of the image reconstruction model under different conditions.

This figure shows additional retrieval results. For each of several seen images, the top 10 most similar images retrieved by the model are shown. This provides a visual demonstration of the model’s performance on image retrieval.

This figure shows examples of images reconstructed from EEG data using the proposed two-stage image generation method. The top row displays the original images that were shown to the subjects. The subsequent rows present the reconstructed images, categorized into ‘Best,’ ‘Median,’ and ‘Worst’ based on their similarity to the original images. The figure visually demonstrates the model’s ability to reconstruct images with varying degrees of accuracy, highlighting the potential and limitations of EEG-based image reconstruction.

This figure shows examples of images reconstructed from EEG data using the proposed two-stage image generation method. The top row displays the original images (‘Seen’) that subjects viewed while their EEG data was recorded. Subsequent rows showcase reconstructed images, organized into groups representing the ‘Best’, ‘Median’, and ‘Worst’ reconstruction quality, with 12 examples in each group. The quality is assessed by comparing the CLIP embeddings of generated and original images. The figure aims to visually demonstrate the model’s ability to reconstruct images with varying degrees of accuracy.

This figure compares the image reconstruction results of one-stage and two-stage EEG-guided image generation methods. The two-stage approach, using a prior diffusion model to generate image embeddings from EEG data before generating the final image, shows better reconstruction of both semantic and low-level visual features compared to a single-stage method which directly generates images from EEG data. A retrieval task using ATM-S shows that the two-stage method also achieves a significant improvement in retrieval accuracy.

This figure compares the performance of nine different EEG/MEG encoders on two datasets (THINGS-EEG and THINGS-MEG) across three visual decoding tasks: classification, retrieval, and generation. The left panel shows the results for the THINGS-EEG dataset, while the right panel presents the results for the THINGS-MEG dataset. The performance is evaluated for both within-subject (the same subject for training and testing) and cross-subject settings (training on a subset of subjects, testing on the remaining subjects). The figure highlights that the proposed ATM encoder consistently outperforms other state-of-the-art encoders across both datasets and evaluation settings.
This figure demonstrates the EEG/MEG-based zero-shot brain decoding and reconstruction framework. The left panel shows a schematic of the three main visual decoding tasks (classification, retrieval, and generation) using EEG/MEG data obtained during natural image viewing. The right panel showcases example images reconstructed by the model.

This figure shows examples of images reconstructed from EEG data using the proposed two-stage image generation method. The top row displays the original images seen by the subjects. The subsequent rows show the best, median, and worst performing reconstructions, ranked according to their similarity to the original images. This visualization demonstrates the model’s ability to generate images that capture the visual stimulus but also highlights the variability and limitations of the reconstruction process.
This figure compares the performance of nine different EEG/MEG encoders on two datasets (THINGS-EEG and THINGS-MEG) for three visual decoding tasks: classification, retrieval, and generation. The left panel shows the results for the THINGS-EEG dataset, while the right panel shows results for the THINGS-MEG dataset. The performance is evaluated across different scenarios (within-subject and cross-subject) for each task. The figure highlights that the proposed ATM encoder in this paper outperforms other encoders.

This figure shows examples of images reconstructed from EEG data using a two-stage generation method. The top row displays the original images seen by the subjects. The middle and bottom rows show the reconstructed images, categorized as ‘best,’ ‘median,’ and ‘worst’ based on their similarity to the originals. The figure demonstrates the effectiveness of the method in reconstructing images with varying degrees of accuracy.
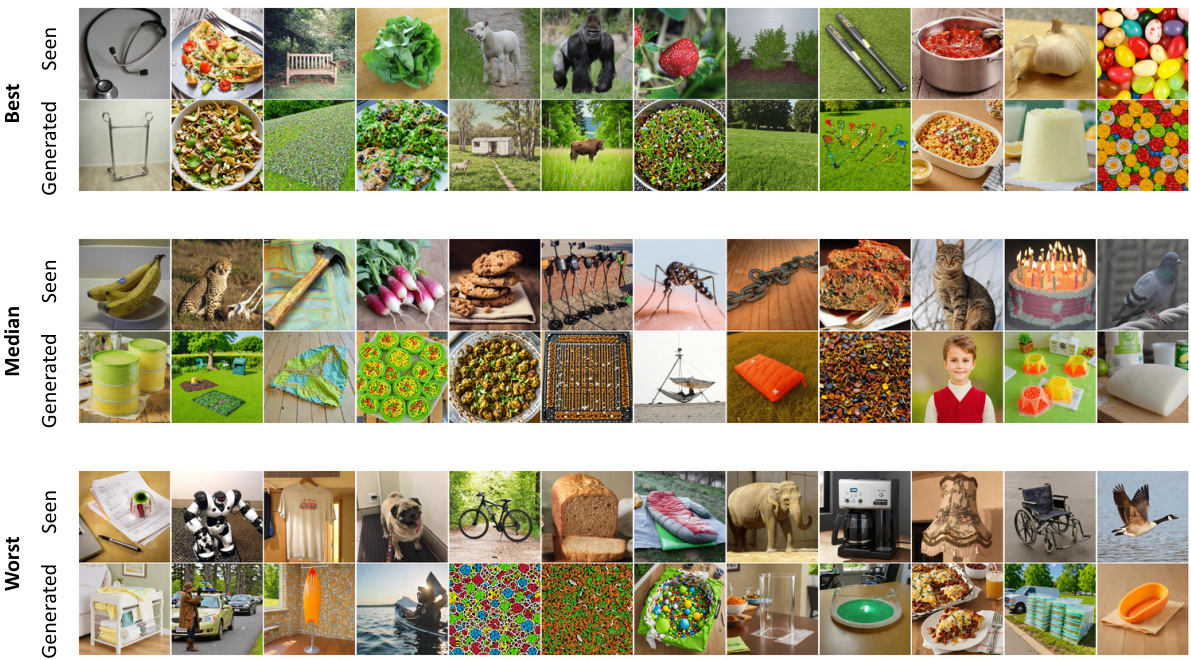
This figure shows examples of images reconstructed from EEG data using the proposed two-stage method. The top row shows the original images seen by the subjects. The rows below show 12 examples each of the best, median, and worst reconstructions, ranked by similarity to the original images. The quality of the reconstruction varies considerably, with the best reconstructions closely resembling the originals and the worst reconstructions showing little resemblance.

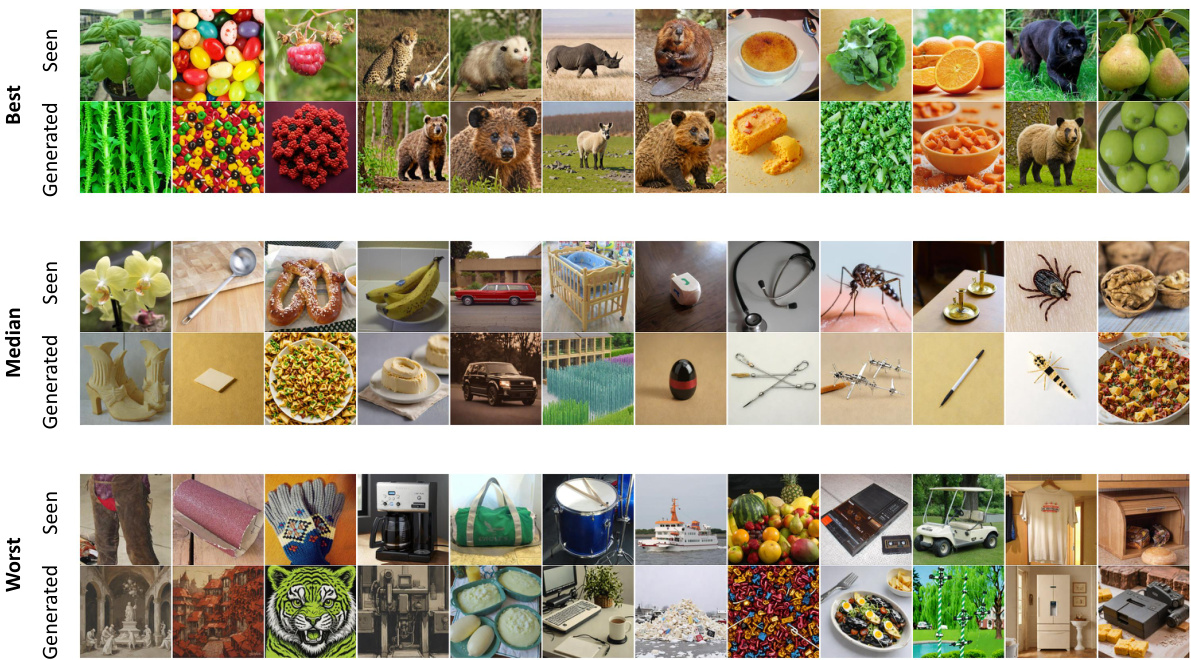
This figure shows example image reconstruction results using EEG data. The top row shows the original images viewed by subjects. The subsequent rows display reconstruction results categorized as ‘Best’, ‘Median’, and ‘Worst’ based on a similarity metric comparing the generated images to the original images. The figure illustrates the varying degrees of success in reconstructing the images from EEG data, ranging from high-fidelity matches to blurry or semantically incorrect results.
This figure compares the performance of nine different EEG encoders on two datasets (THINGS-EEG and THINGS-MEG) across three visual decoding tasks: classification, retrieval, and generation. The left panel shows results for the THINGS-EEG dataset, while the right panel shows results for the THINGS-MEG dataset. The performance is evaluated using within-subject and cross-subject metrics. The figure highlights that the proposed ATM encoder significantly outperforms other encoders.

This figure shows examples of images reconstructed from EEG data using a two-stage image generation method. The top row displays the original images that were shown to the subjects, and the bottom row shows the images reconstructed by the model. The images are grouped into three categories: best, median, and worst, based on how well the reconstructed images match the originals.

This figure shows examples of images reconstructed from EEG data using the proposed two-stage method. The top row displays the original images that subjects saw, while the subsequent rows illustrate the best, median, and worst reconstruction results based on the similarity between generated and original images. The results highlight the model’s ability to reconstruct images with varying levels of accuracy, capturing both semantic and low-level details in successful reconstructions, and failing to do so in less successful instances.

This figure compares the performance of nine different EEG encoders on two datasets: THINGS-EEG and THINGS-MEG. The left side shows the performance on THINGS-EEG, broken down into within-subject and across-subject performance for image classification and retrieval tasks, as well as image generation. The right side shows similar comparisons using the THINGS-MEG dataset. The key takeaway is that the proposed ATM encoder significantly outperforms all other encoders across all tasks and datasets, highlighting its effectiveness in visual decoding using EEG/MEG data.
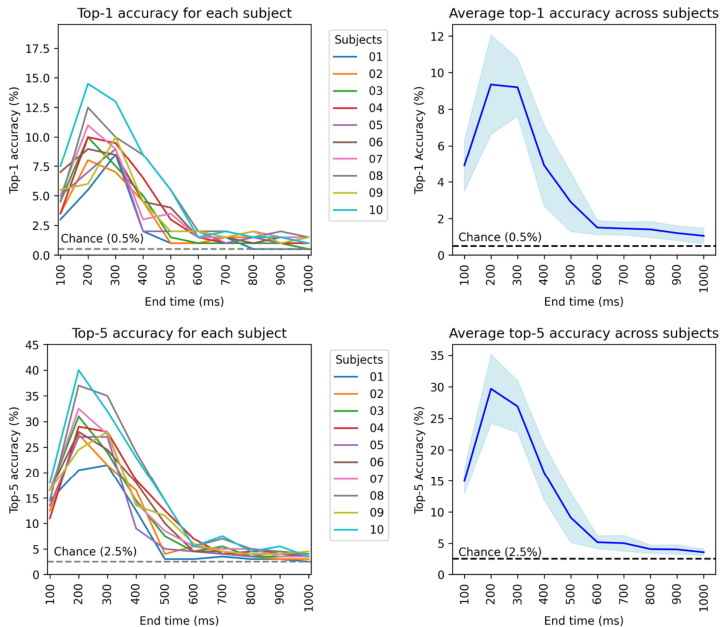
This figure compares the performance of nine different EEG/MEG encoders on two datasets, THINGS-EEG and THINGS-MEG, for three visual decoding tasks (classification, retrieval, and generation). The left panel shows the results for THINGS-EEG, while the right panel displays the results for THINGS-MEG. The performance is evaluated using within-subject and cross-subject metrics for classification and retrieval, as well as by top-1 and top-5 accuracy for image generation. The results indicate that the proposed ATM encoder significantly outperforms other methods, demonstrating the effectiveness of the proposed approach for EEG/MEG-based visual decoding.

This figure compares the performance of different EEG encoders on two datasets: THINGS-EEG and THINGS-MEG. The left panel shows results for the THINGS-EEG dataset, broken down by within-subject and cross-subject performance for several decoding tasks (classification and retrieval). The right panel repeats the analysis but for the THINGS-MEG dataset. The figure demonstrates the superiority of the authors’ proposed method (ATM-S) across all tasks and datasets compared to other state-of-the-art encoders.
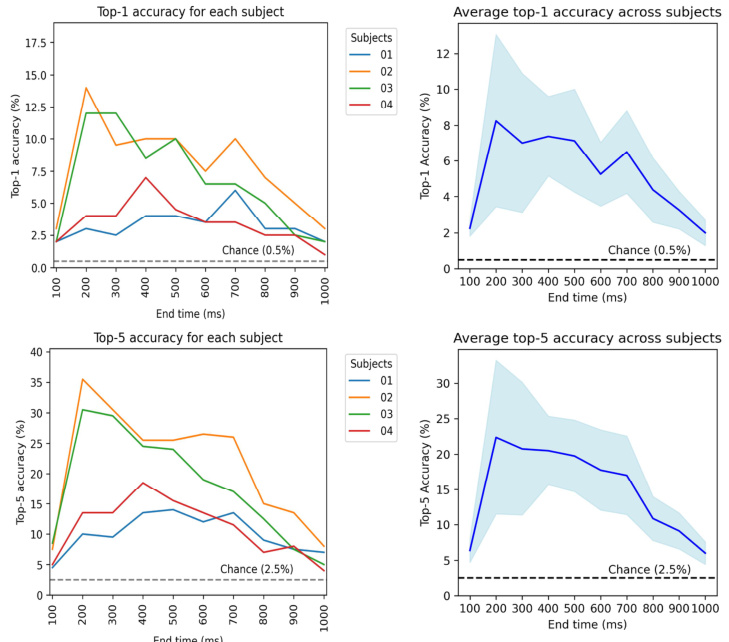
This figure compares the performance of nine different EEG encoders on two datasets: THINGS-EEG and THINGS-MEG. The left panel shows results for the THINGS-EEG dataset, while the right panel shows results for the THINGS-MEG dataset. The performance is evaluated across three visual decoding tasks: classification, retrieval (top-1 and top-5), and generation (top-1 and top-5). The results demonstrate that the proposed ATM encoder outperforms all other encoders across both datasets and across all three tasks.
More on tables

This table details the architecture of the Adaptive Thinking Mapper (ATM), the EEG encoder used in the proposed framework. It lists each layer of the ATM, including its input and output shapes and the number of parameters. The table provides a quantitative overview of the model’s complexity and the computational resources required for its operation.

This table presents the results of an ablation study conducted on the Adaptive Thinking Mapper (ATM) model, a tailored EEG encoder. The study systematically removed different components of the ATM model to assess their individual contributions to the model’s performance on the THINGS-EEG dataset’s retrieval task. The components tested are MLP, Temporal-Spatial Convolution (TSC), and Channel-wise Attention (CAL). The table shows the Top-1 and Top-5 accuracies achieved by different configurations of the ATM model. This helps to understand the relative importance of each component in the overall performance.

This table presents the ablation study results on the ATM model. It shows the impact of each module (Channel-wise attention layer, Token embedding, Feed Forward Network, Position encoding, Temporal spatial convolution) on the Top-1 and Top-5 retrieval accuracy. Different configurations of each module are tested and their corresponding accuracies are reported. The results highlight the contribution of each component to the overall model’s performance.

This table presents the Top-1 and Top-5 retrieval accuracies achieved using latent variables from a Variational Autoencoder (VAE). The results are compared against the ideal chance level, which represents the accuracy expected by random chance. The ATM-S (Ours) row shows the results obtained using the authors’ proposed method. The table demonstrates that the proposed method significantly outperforms random chance in image retrieval tasks, suggesting its effectiveness in extracting meaningful representations from EEG data.

This table compares the classification performance of different models on two datasets: GOD-Wiki (fMRI) and THINGS (MEG/EEG). The performance is evaluated using top-1 and top-5 accuracy across three different numbers of image categories (50-way, 100-way, and 200-way). The table highlights the superior performance of the proposed ATM model on the THINGS dataset, especially in the MEG modality.

This table presents a quantitative comparison of the reconstruction quality achieved using EEG, MEG, and fMRI data for Subject 8. It compares various metrics including Pixel Correlation (PixCorr), Structural Similarity Index (SSIM), and the top-1 and top-5 accuracy using AlexNet (layers 2 and 5), Inception, CLIP, and SwAV. Higher values for most metrics generally indicate better reconstruction quality.
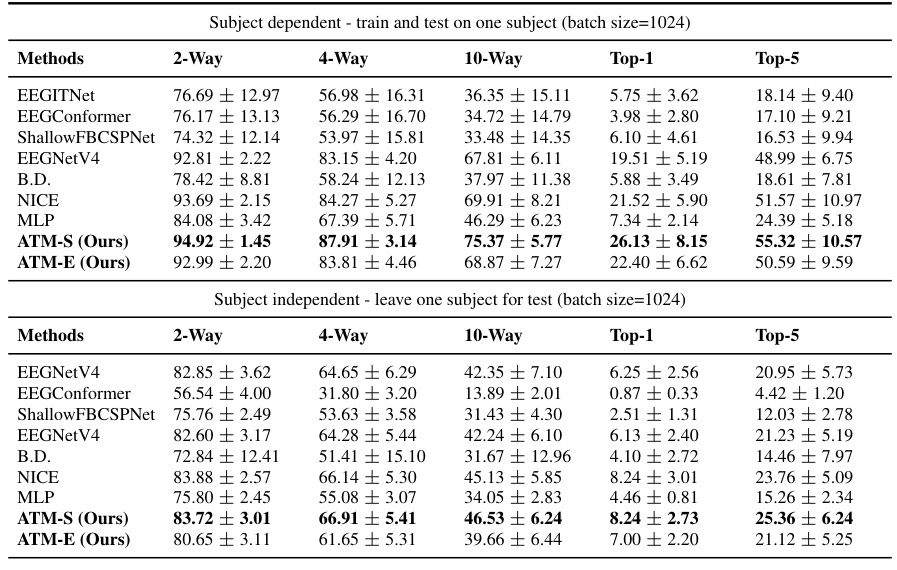
This table presents a comprehensive comparison of the zero-shot retrieval performance using different EEG embedding methods on the THINGS-EEG dataset. It breaks down the results for both subject-dependent (training and testing on the same subject) and subject-independent (leave-one-subject-out) scenarios, across various retrieval tasks (2-way, 4-way, 10-way, Top-1, and Top-5) and with a batch size of 1024. The table highlights the superior performance of the proposed ATM-S and ATM-E methods compared to existing methods.
Full paper#


