↗ OpenReview ↗ NeurIPS Homepage ↗ Chat
TL;DR#
Vanilla pixel-level classifiers for semantic segmentation struggle with intra-class variance and fail to fully utilize spatial information, leading to inaccurate segmentation results, particularly at object boundaries. These limitations stem from directly interacting fixed prototypes with pixel features, neglecting context.
SSA-Seg tackles this by introducing adaptive semantic and spatial prototypes, guided by coarse masks. The model simultaneously considers prototypes from both domains for improved classification accuracy. Further, an online multi-domain distillation learning strategy is employed to fine-tune the adaptation process. This approach significantly improves segmentation performance across multiple benchmark datasets, while maintaining efficiency.
Key Takeaways#
Why does it matter?#
This paper is important because it offers a novel approach to semantic segmentation, a crucial task in computer vision with broad applications. The improved accuracy and efficiency achieved by SSA-Seg have significant implications for real-world applications, particularly in resource-constrained environments. It also opens new avenues for research in adaptive classifiers and multi-domain distillation.
Visual Insights#

This figure illustrates the limitations of vanilla pixel-level classifiers and how SSA-Seg addresses them. (a) shows a test image. (b) visualizes feature distribution, highlighting the large intra-class variance and information loss. (c) and (d) demonstrate how SSA-Seg adapts semantic and spatial prototypes for improved classification, moving them toward the center of semantic and spatial domains. A visual comparison of results using the baseline and SSA-Seg is shown in Figure 5.

This table presents a comparison of the performance of SSA-Seg against other state-of-the-art models for semantic segmentation on three benchmark datasets (ADE20K, COCO-Stuff-10K, and PASCAL-Context). It shows the FLOPs (floating point operations), latency (in milliseconds), number of parameters, and mean Intersection over Union (mIoU) for each method. The table is divided into two parts: general methods and lightweight methods. For each method, both baseline results and results after applying SSA-Seg are provided for comparison. The improvements achieved by SSA-Seg are highlighted in green.
In-depth insights#
Adaptive Prototypes#
The concept of “Adaptive Prototypes” in a semantic segmentation context signifies a significant departure from traditional methods. Instead of relying on fixed, pre-trained prototypes, adaptive prototypes dynamically adjust based on the specific characteristics of the input image. This adaptability is crucial for handling the inherent variability in real-world data, particularly the large intra-class variance often encountered in semantic segmentation tasks. By adapting to the unique spatial and semantic features of each test image, adaptive prototypes improve the accuracy of pixel-level classification. This approach is particularly valuable in situations with complex backgrounds or significant variations in object appearance across different images. The effectiveness hinges on the method used for adaptation, which could involve mechanisms such as learning the relationship between prototypes and image features or leveraging contextual information to guide adjustments. A key advantage is the potential for improved performance without a substantial increase in computational overhead, especially in lightweight models.
Multi-Domain Distillation#
Multi-domain distillation, as a training strategy, refines the primary classifier by leveraging knowledge from multiple domains. Response domain distillation uses the teacher classifier’s higher-entropy, ground-truth guided output to improve the primary classifier’s predictions, particularly at boundaries. Semantic domain distillation focuses on refining the inter-class relationships of the semantic prototypes, promoting better feature separation and categorization. Spatial domain distillation leverages spatial relationships, using position embeddings to guide the learning process and ensure accurate spatial prototype adaption. This multi-faceted approach, by simultaneously considering and integrating knowledge from the semantic, spatial, and response domains, is crucial for controlling prototype adaptation and achieving significant improvements in segmentation accuracy, especially in complex scenarios with high intra-class variability.
Semantic-Spatial Fusion#
Semantic-spatial fusion in computer vision aims to synergistically integrate semantic understanding (object categories) with spatial information (object location, shape, and context). Effective fusion is crucial for tasks demanding fine-grained scene understanding, such as semantic segmentation, where precise pixel-level classification requires both accurate object recognition and spatial reasoning to resolve ambiguities. Naïve concatenation of semantic and spatial features often fails to capture complex interactions. Successful fusion strategies often involve attention mechanisms, which weigh the importance of spatial context relative to object semantics, or multi-stage processing, where spatial relationships inform semantic refinement or vice-versa. The choice of fusion technique depends heavily on the specific task and data characteristics. Higher-level representations, beyond simple feature concatenation, are key to robust and accurate semantic-spatial fusion. Ultimately, the goal is to generate richer, more holistic scene representations than either modality can provide alone.
Efficiency Gains#
Analyzing efficiency gains in a research paper requires a multifaceted approach. First, identify precisely what constitutes an efficiency gain—is it reduced computational cost (FLOPS, latency), fewer parameters, faster training times, or a combination? The paper should clearly quantify these gains with concrete metrics and benchmark comparisons against relevant state-of-the-art methods. Transparency is key; methodologies must be explicitly defined, allowing reproducibility of the results. Contextualization within the broader research field is crucial—are these efficiency improvements significant enough to warrant practical deployment or are they marginal gains? Furthermore, trade-offs should be evaluated: does the efficiency gain compromise accuracy or other critical performance measures? Finally, generalizability is important: do these efficiency gains hold across various datasets, hardware setups and application scenarios? A thoughtful analysis must address all these questions, offering a nuanced perspective on the true impact of the reported improvements.
Future Extensions#
Future extensions of this semantic segmentation research could involve exploring more sophisticated attention mechanisms to better capture long-range dependencies within images. Improving the efficiency of the adaptive classifier, perhaps through model compression techniques or more efficient attention implementations, is another promising area. Investigating the use of self-supervised learning or semi-supervised learning strategies to reduce the reliance on large, labeled datasets would also be beneficial. The spatial prototype adaptation could be enhanced by incorporating more advanced geometric reasoning or using graph neural networks to better capture spatial relationships between objects. Finally, a thorough evaluation on a wider range of datasets and benchmarking against state-of-the-art methods for various vision tasks would solidify the approach’s generalizability and practical impact.
More visual insights#
More on figures

This figure illustrates the overall architecture of SSA-Seg, showing how semantic and spatial information is integrated for improved semantic segmentation. The left side depicts the core SSA-Seg classifier, which uses a coarse mask to guide the adaptation of semantic and spatial prototypes. The right side details the online multi-domain distillation process that refines these prototypes using ground truth information. The figure uses various visual elements such as arrows, boxes, and mathematical symbols to clearly represent the flow of information and the different processes involved.

This figure visualizes the inter-class relation matrices for semantic prototypes with and without semantic domain distillation. The matrices show the relationships between different semantic prototypes. The results demonstrate that after applying semantic domain distillation, the prototypes exhibit better separability, which improves category recognition.

The figure shows two line graphs, one for ADE20K and one for COCO-Stuff-10K, illustrating the validation set mIoU (mean Intersection over Union) over the number of training iterations. Each graph compares the performance of the baseline SeaFormer model (blue line) with the performance of the proposed SSA-Seg model (orange line). The results demonstrate that SSA-Seg achieves a higher mIoU and reaches its peak performance with significantly fewer training iterations.

This figure compares the results of SSA-Seg and the baseline model (SeaFormer-L) on a specific image from the ADE20K dataset. The visualization uses t-SNE to show the distribution of pixel features in the feature space. Purple and gray dots represent features from the door and other categories, respectively. The orange star marks the original fixed prototype for the ‘wall’ category, while the red star represents the adapted prototype generated by SSA-Seg. The figure demonstrates how SSA-Seg adjusts the fixed prototypes toward the center of the semantic and spatial domains, leading to improved segmentation accuracy.

This figure demonstrates a scenario where, without distillation, the offset of the prototype is uncontrollable and in extreme cases moves away from the semantic features of the corresponding image, leading to more pixels being misclassified. The image shows how the prototype offsets without distillation (red star) versus with distillation (purple star). The t-SNE plots show the improved clustering and separation of features when distillation is applied.

This figure uses t-SNE to visualize the pixel feature distributions of ‘door’ and ’table’ classes from the ADE20K dataset. It demonstrates that even within the same class, pixel features exhibit high intra-class variance due to diverse imaging conditions and object appearances. This variance highlights a key challenge addressed by the proposed SSA-Seg method which adapts to variations in the test image.

This figure visualizes the segmentation results and class activation maps (CAMs) for different methods on the ADE20K dataset. It compares the ground truth (GT) segmentations with those produced by SeaFormer, CAC, and SSA-Seg. The CAMs, generated using Grad-CAM [41], highlight the regions of the feature maps that are most important for making classification decisions. The figure shows that SSA-Seg produces more accurate and complete segmentations, particularly in resolving ambiguous boundaries and handling complex scenes, compared to SeaFormer and CAC. The CAM visualization further supports this conclusion, demonstrating that SSA-Seg focuses its attention on more relevant features leading to more accurate results.
More on tables

This table presents a comparison of the performance of SSA-Seg against other state-of-the-art semantic segmentation methods. It shows the mIoU (mean Intersection over Union), FLOPs (floating-point operations), and latency for various backbones on three benchmark datasets (ADE20K, COCO-Stuff-10K, and PASCAL-Context). The results demonstrate SSA-Seg’s improvements in mIoU with minimal increases in computational cost. The table is separated into general and lightweight methods sections for easier comparison.

This table compares the performance of SSA-Seg integrated with different mask classification methods on three benchmark datasets (ADE20K, COCO-Stuff-10K, and PASCAL-Context). It shows the number of parameters, FLOPs, latency, and mIoU achieved by each method. The results highlight SSA-Seg’s ability to improve the performance of existing mask-based methods.

This table presents the ablation study of the position basis in the SSA-Seg model. The baseline is SeaFormer-L. It shows a comparison between the full SSA-Seg model and a version that only uses the randomly initialized position basis, demonstrating the impact of spatial prototype adaptation on model performance. The results highlight the importance of the spatial prototype adaptation component in achieving the best results.

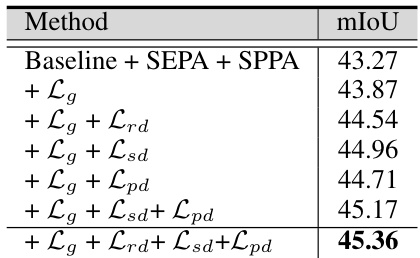
This table presents the ablation study of the response domain distillation loss (Lrd) in the SSA-Seg model. It shows the effect of removing different components from the Lrd calculation on the final mIoU (mean Intersection over Union) performance. Specifically, it evaluates the impact of removing the entropy (H), boundary mask (B), and a term denoted by ε from the Lrd formula. The results demonstrate the importance of each component for the overall performance of the SSA-Seg model.

This table shows the ablation study on the generation of the spatial domain center Pc. It compares the performance of using only softmax on the channel dimension (SoftmaxK) versus using softmax on both the channel and spatial dimensions (SoftmaxHW). The results indicate that applying softmax on both dimensions leads to a significant improvement in mIoU, suggesting that considering the spatial distribution of features is crucial for accurate segmentation.

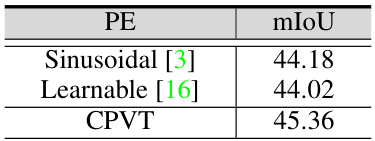
This table presents the ablation study of different position encoding methods used in the SSA-Seg model on the ADE20K dataset. It compares the performance (mIoU) of three different position encoding techniques: Sinusoidal, Learnable, and CPVT. The results show the impact of the choice of position encoding on the overall segmentation accuracy.

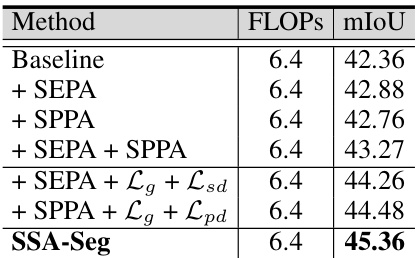
This table shows the ablation study of the proposed Semantic and Spatial Adaptive Classifier (SSA-Seg). It compares the performance of different components of SSA-Seg in terms of mIoU and FLOPs. The baseline uses a 1x1 convolution with softmax. Adding SEPA (Semantic Prototype Adaptation) and SPPA (Spatial Prototype Adaptation) improves mIoU, and the inclusion of the distillation losses (Lg, Lsd, and Lpd) further enhances the performance.

This table compares the performance of SSA-Seg against other state-of-the-art semantic segmentation models, both general and lightweight, across three benchmark datasets: ADE20K, COCO-Stuff-10K, and PASCAL-Context. It presents metrics such as mIoU (mean Intersection over Union), FLOPs (floating point operations), latency (in milliseconds), and the number of parameters for each model. The table highlights the improvements achieved by incorporating SSA-Seg into various baseline models, demonstrating its effectiveness in enhancing segmentation performance without significant computational overhead.

This table compares the performance of SSA-Seg against several state-of-the-art semantic segmentation models, both general and lightweight, across three benchmark datasets: ADE20k, COCO-Stuff-10K, and PASCAL-Context. It shows the model’s mIoU (mean Intersection over Union), FLOPs (floating point operations), latency (in milliseconds), and the number of parameters. The comparison highlights SSA-Seg’s ability to improve baseline models’ performance while maintaining efficiency. The increase in FLOPs and latency introduced by SSA-Seg is minimal compared to the improvements achieved in mIoU.

This table compares the performance of SSA-Seg against other state-of-the-art semantic segmentation models, both general and lightweight, across three benchmark datasets (ADE20K, COCO-Stuff-10K, and PASCAL-Context). Metrics include mIoU (mean Intersection over Union), FLOPs (floating point operations), and latency (inference time). The table highlights SSA-Seg’s improvements in mIoU while showing minimal increases in computational cost. Green numbers denote the performance gain from applying SSA-Seg to a baseline model.

This table compares the performance of SSA-Seg against other state-of-the-art models on three common semantic segmentation datasets (ADE20K, COCO-Stuff-10K, and PASCAL-Context). It shows the model’s mIoU (mean Intersection over Union), FLOPs (floating point operations), parameters, and latency. The comparison is broken down into general and lightweight models, highlighting the efficiency gains achieved by SSA-Seg. Green numbers indicate performance improvements over the baseline models after applying SSA-Seg.

This table compares the performance of SSA-Seg against several state-of-the-art semantic segmentation models, both general and lightweight. It shows the model’s performance in terms of mean Intersection over Union (mIoU), FLOPS (floating point operations per second), and latency (in milliseconds) on three benchmark datasets: ADE20K, COCO-Stuff-10K, and PASCAL-Context. The increase in performance achieved by adding SSA-Seg to existing models is highlighted.
Full paper#


