↗ OpenReview ↗ NeurIPS Homepage ↗ Hugging Face ↗ Chat
TL;DR#
The machine learning community widely believes that AUPRC is superior to AUROC for tasks with imbalanced classes. This paper challenges that notion. It argues that AUROC and AUPRC differ only in their weighting of false positives and that AUPRC can unduly favor improvements in certain subpopulations, raising fairness concerns.
The paper presents both theoretical analysis and empirical evidence using synthetic and real-world datasets. It establishes that AUROC and AUPRC’s differing behaviors are related to how they prioritize improvements over different ranges of model output scores, not class imbalance. This highlights AUPRC’s potential to exacerbate existing biases, particularly in scenarios involving multiple subpopulations, thereby advocating for careful metric selection in order to avoid potentially harmful algorithmic disparities.
Key Takeaways#
Why does it matter?#
This paper is crucial because it challenges a widely held belief in machine learning, potentially impacting model selection and fairness in various applications. It highlights the limitations of AUPRC, a frequently used metric, and promotes more careful metric selection to improve model fairness and avoid biases. This has significant implications for researchers working in high-stakes domains like healthcare and finance.
Visual Insights#

This figure illustrates the relationship between AUROC and AUPRC when correcting model mistakes in binary classification tasks. It highlights how AUROC treats all mistakes equally, whereas AUPRC prioritizes high-score mistakes which can lead to fairness concerns in subpopulations. The figure uses diagrams and examples to illustrate different scenarios where AUROC or AUPRC may be more suitable metrics.

This table presents the number of samples, features, and the prevalence of positive labels in higher and lower prevalence subgroups for four datasets (adult, compas, lsac, and mimic) after balancing by sex and race. These statistics are essential for understanding the class imbalance characteristics of the datasets used in the paper’s experiments on fairness.
In-depth insights#
AUROC vs AUPRC#
The debate around AUROC vs. AUPRC centers on their relative effectiveness in evaluating classifiers, especially under class imbalance. AUROC, or Area Under the Receiver Operating Characteristic curve, considers the trade-off between true positive rate and false positive rate across all classification thresholds. AUPRC, or Area Under the Precision-Recall curve, focuses on the trade-off between precision and recall. While AUPRC is often favored for imbalanced datasets due to its purported robustness, this paper challenges that notion. It theoretically demonstrates that AUPRC’s apparent superiority stems from its weighting of false positives inversely to the model’s prediction confidence. This inherent weighting can create a bias, particularly in multi-population datasets, where AUPRC might unfairly favor improvements in higher-prevalence subpopulations at the expense of less-represented groups. The authors advocate for AUROC in context-independent model evaluation due to its unbiased weighting of errors, reserving AUPRC for specific deployment scenarios where false negatives or other subpopulation-specific performance characteristics are considerably more consequential than others.
Theoretical Analysis#
A theoretical analysis section in a research paper typically delves into the mathematical and logical underpinnings of the study’s claims. It often involves developing formal models, deriving theorems, or proving propositions to establish a solid foundation for the empirical findings. A strong theoretical analysis section enhances the credibility and generalizability of the research. It can illuminate the underlying mechanisms and relationships between variables. For example, in a machine learning study, theoretical analysis might involve deriving bounds on the generalization error of a model or analyzing the sensitivity of model performance to various hyperparameters. Such rigorous analysis distinguishes a high-quality research paper and builds trust in the conclusions drawn. The level of mathematical sophistication will vary widely based on the field and complexity of the research topic, but a well-structured theoretical section should clearly outline all assumptions made, provide comprehensive proofs, and carefully define all notation used. Clear explanations linking the theoretical results to the empirical observations are also vital. This bridges the gap between abstract concepts and practical applications. The absence of a theoretical foundation might make the research appear less robust and its findings limited in scope.
Synthetic Experiments#
In a research paper, a section on “Synthetic Experiments” would likely detail the use of artificially generated datasets to validate or explore the theoretical claims made earlier. These experiments would be crucial for several reasons. First, they offer a controlled environment, allowing researchers to isolate specific variables and precisely measure their effects on AUROC and AUPRC, avoiding the confounding factors present in real-world data. Second, synthetic data can be tailored to test specific hypotheses related to class imbalance and model behavior under various conditions, such as extreme imbalance ratios or specific types of model errors. The use of synthetic data allows for systematic investigation of how different levels of class imbalance influence performance metrics such as AUROC and AUPRC, potentially uncovering unexpected relationships or confirming theoretical predictions. Results from synthetic experiments would then serve as a foundation for the subsequent real-world experiments, providing a baseline to assess the generalizability of the findings and providing strong support for claims made based on theoretical analyses alone. Therefore, the “Synthetic Experiments” section would provide an essential bridge between theory and practice, strengthening the validity and insights of the entire research paper.
Real-World Datasets#
A robust evaluation of machine learning (ML) models necessitates the use of real-world datasets. These datasets, unlike synthetic ones, capture the complexity and nuances of real-world phenomena, including noise, missing data, and class imbalances. Using real-world datasets enables a more realistic assessment of model performance in actual applications, leading to a more trustworthy assessment of a model’s generalizability. The choice of real-world datasets is crucial, as they must be representative of the target domain and the problem being addressed. Furthermore, careful consideration must be given to potential biases present within the datasets which could skew the results and undermine the validity of the evaluation. Ethical considerations are paramount, especially when dealing with sensitive data. Transparency in data selection and preprocessing is vital for ensuring the reproducibility and trustworthiness of results, promoting the integrity of the entire ML research process. Therefore, it’s essential to choose and employ real-world datasets judiciously for a rigorous and responsible evaluation process.
Limitations & Future#
The ‘Limitations & Future Work’ section of a research paper is crucial for assessing the study’s scope and potential for future development. A strong limitations section acknowledges inherent constraints, such as dataset biases, model assumptions, or methodological choices, fostering transparency and credibility. It demonstrates a realistic understanding of the research’s boundaries, improving the paper’s overall impact. Future work outlines potential extensions and improvements, showcasing the long-term vision and suggesting areas ripe for further investigation. This might involve addressing limitations, exploring different approaches, tackling more complex problems, or expanding the dataset. A thoughtful discussion of limitations and future work not only enhances the research paper’s rigor but also strengthens its impact and helps establish directions for future research. Clearly articulating potential shortcomings and indicating avenues for subsequent research is essential. A balanced presentation of both limitations and future opportunities ensures a complete and informative contribution.
More visual insights#
More on figures

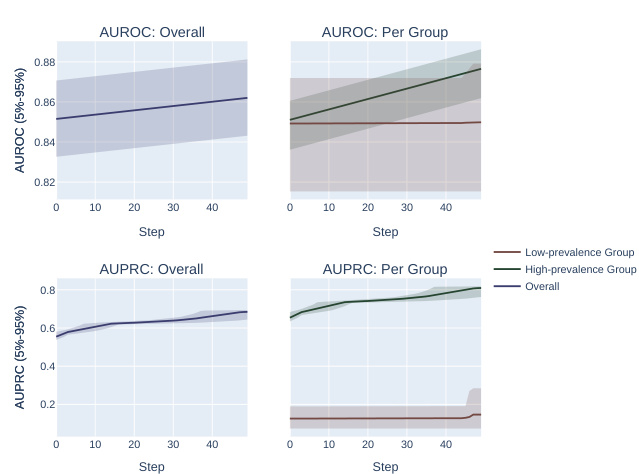
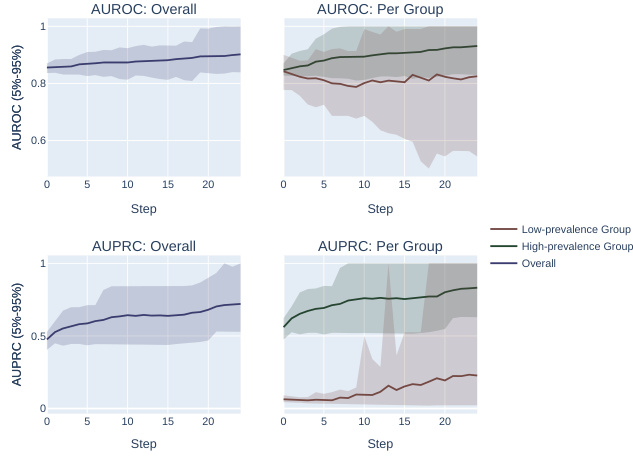
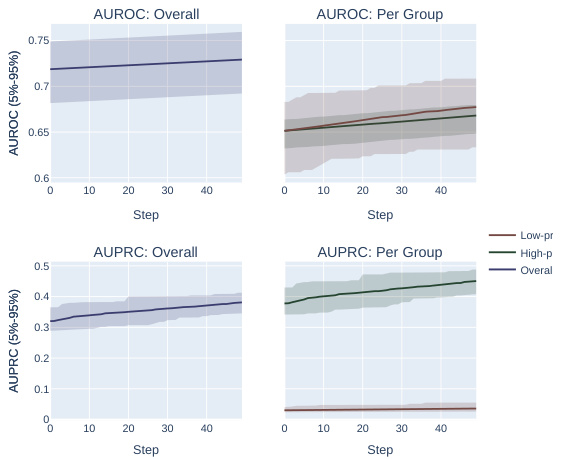
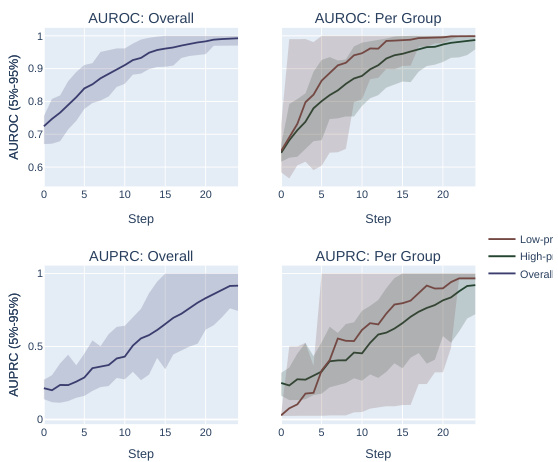
This figure compares the performance of AUROC and AUPRC in a synthetic experiment with two subpopulations. Two optimization methods are shown. The results demonstrate that AUPRC optimization disproportionately benefits the higher prevalence subpopulation while AUROC treatment is fairer to both.
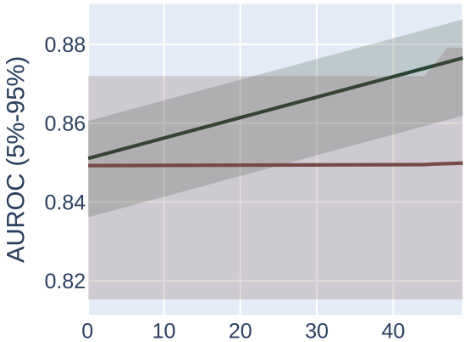
The figure compares the impact of optimizing for AUROC vs. AUPRC in a synthetic experiment with two subpopulations. Two optimization methods are shown: one that fixes individual mistakes and one that performs random permutations of scores. The results demonstrate that AUPRC disproportionately improves the high-prevalence group, while AUROC treats both groups equally.
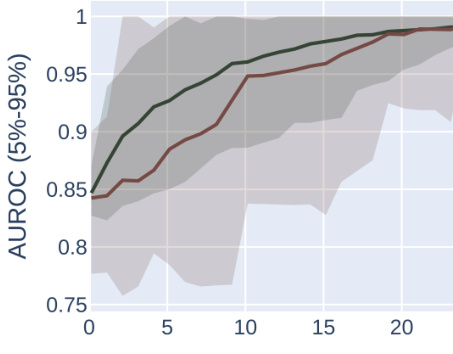
This figure compares the results of optimizing for AUROC vs. AUPRC using two different optimization methods on a synthetic dataset with two subpopulations, one high-prevalence and one low-prevalence. It demonstrates that AUPRC disproportionately favors the high-prevalence group, while AUROC treats both groups more equally.
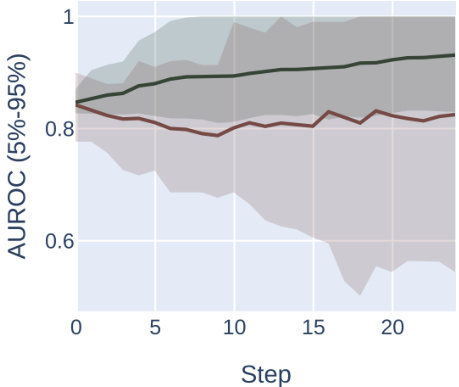
This figure shows the results of synthetic experiments designed to compare the effects of optimizing for AUROC vs. AUPRC on subpopulation disparity in binary classification tasks. The results demonstrate that optimizing for AUPRC favors high-prevalence subpopulations, while optimizing for AUROC treats subpopulations more equally. Two optimization procedures were tested, one fixing individual mistakes and another using random score permutations.

This figure illustrates how AUROC and AUPRC handle different types of model mistakes in binary classification, particularly highlighting the impact of class imbalance and its relation to fairness and ethical considerations. Panel (a) sets the stage, showing how AUROC treats all mistakes equally, while AUPRC favors correcting mistakes at higher scores. Panels (b) to (e) illustrate different real-world scenarios where either AUROC or AUPRC would be more appropriate as the evaluation metric.

This figure illustrates the difference between AUROC and AUPRC in terms of how they prioritize correcting model mistakes in binary classification tasks. AUROC treats all mistakes equally, while AUPRC prioritizes high-score mistakes, which can lead to algorithmic bias and fairness concerns, particularly when dealing with multiple subpopulations with different positive label prevalence.
This figure illustrates how AUROC and AUPRC differ in prioritizing model improvements (mistakes) in various scenarios with two subpopulations (A=0 and A=1). (a) shows how AUROC and AUPRC handle mistakes differently. Subsequent sections (b-e) illustrate different real-world use cases and how AUROC and AUPRC would prioritize improvements. These different prioritizations highlight the importance of the choice of metric given the context.
This figure illustrates the key differences between AUROC and AUPRC in prioritizing model improvements based on the score assigned to samples and various use cases. It highlights how AUROC treats all mistakes equally, while AUPRC prioritizes high-scoring mistakes, potentially leading to fairness concerns.
This figure illustrates how AUROC and AUPRC prioritize correcting different types of model mistakes in binary classification. It highlights the key difference between the two metrics: AUROC treats all mistakes equally, while AUPRC favors high-scoring mistakes. The figure provides several use cases, such as cancer screening, public health intervention, and small molecule screening, to showcase how the choice between AUROC and AUPRC impacts the performance and fairness of model predictions.
This figure illustrates how AUROC and AUPRC prioritize correcting different types of model mistakes, which has implications for model evaluation and selection in various scenarios, particularly when considering fairness and cost of errors. In different use cases (cancer screening, public health intervention, and small molecule screening), the optimal prioritization of mistakes differs, revealing the limitations of AUPRC compared to AUROC in certain contexts.
This figure illustrates how AUROC and AUPRC prioritize correcting different types of model mistakes in binary classification tasks, especially considering class imbalance and subpopulations. It uses several example scenarios to highlight how the choice of metric influences the focus on improving model performance in different regions of the output score distribution, which in turn can have implications for fairness and ethical considerations.
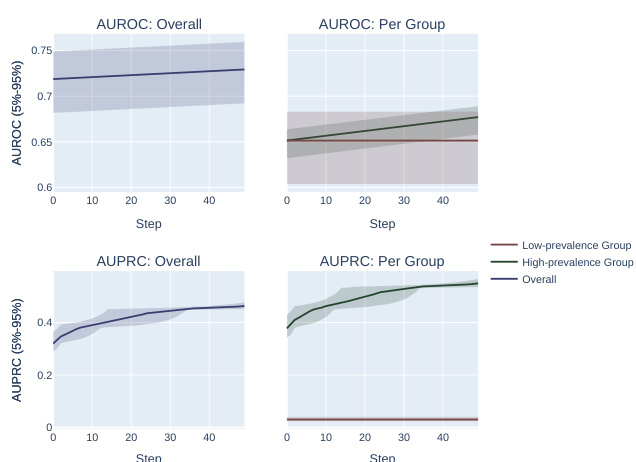
This figure illustrates the differences between AUROC and AUPRC in terms of how they prioritize model improvements (mistakes) across different scenarios, with varying cost ratios and fairness considerations. It demonstrates that AUROC treats all mistakes equally, while AUPRC prioritizes high-score mistakes, which can lead to unfairness in multi-population use cases.
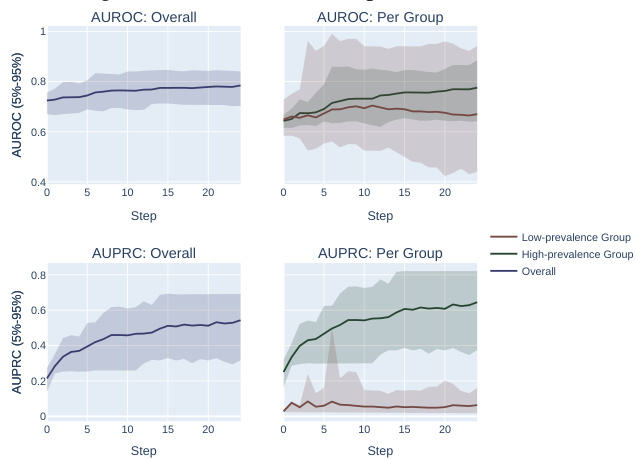
This figure illustrates the differences between AUROC and AUPRC in terms of how they prioritize correcting model mistakes. AUROC treats all mistakes equally, while AUPRC prioritizes high-scoring mistakes. The figure also shows how this difference affects model selection in various scenarios such as cancer screening and public health intervention, highlighting the importance of selecting the appropriate metric based on the specific application and ethical considerations.
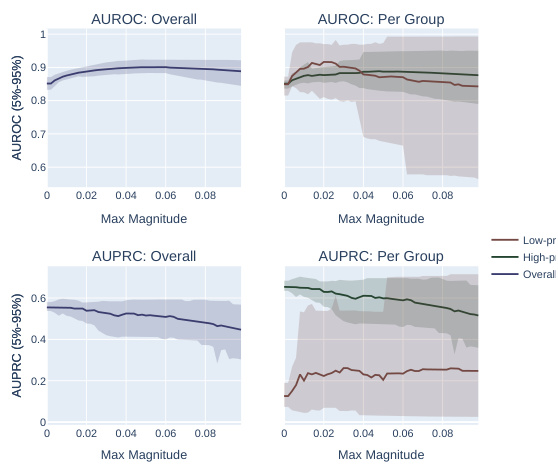
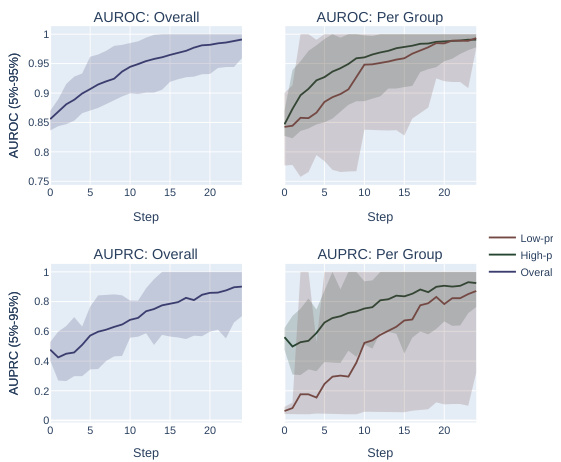
The figure compares the performance of AUROC and AUPRC on synthetic data with two subpopulations under two optimization strategies. The results show that AUPRC favors the higher-prevalence subpopulation, while AUROC treats both groups equally.
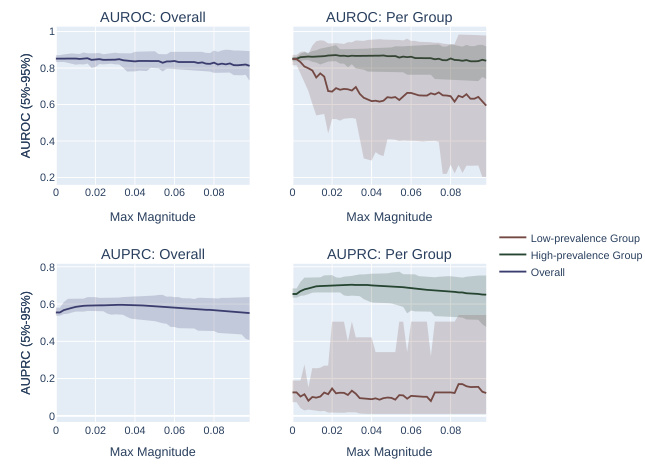
This figure shows the results of synthetic experiments comparing AUROC and AUPRC optimization methods. Two methods were used: fixing individual mistakes and permuting scores. The results demonstrate that AUPRC disproportionately favors the high-prevalence subpopulation during optimization, unlike AUROC, which treats both groups more equally.

This figure compares the effects of optimizing for AUROC and AUPRC in a synthetic experiment with two subpopulations. It shows that AUPRC optimization disproportionately favors the higher-prevalence subpopulation, while AUROC treatment of the groups is more equitable. This is demonstrated using two different optimization procedures: successively correcting individual mistakes (a and b) and successively selecting an optimal score permutation (c and d). The results highlight the bias AUPRC can introduce.

This figure displays the results of real-world experiments to validate the theoretical findings of the paper. It shows the difference in Spearman’s correlation between the AUROC gap (the difference in AUROC between two subpopulations) and overall AUPRC, and the AUROC gap and overall AUROC. The x-axis represents the prevalence ratio between the two groups in each dataset, and the y-axis represents the difference in Spearman’s correlation. Datasets are sorted by prevalence ratio. Error bars show 95% confidence intervals based on 20 different random data splits. The results show a positive correlation between prevalence ratio and the difference in Spearman’s correlation, indicating that AUPRC favors high-prevalence subpopulations more than AUROC.
More on tables
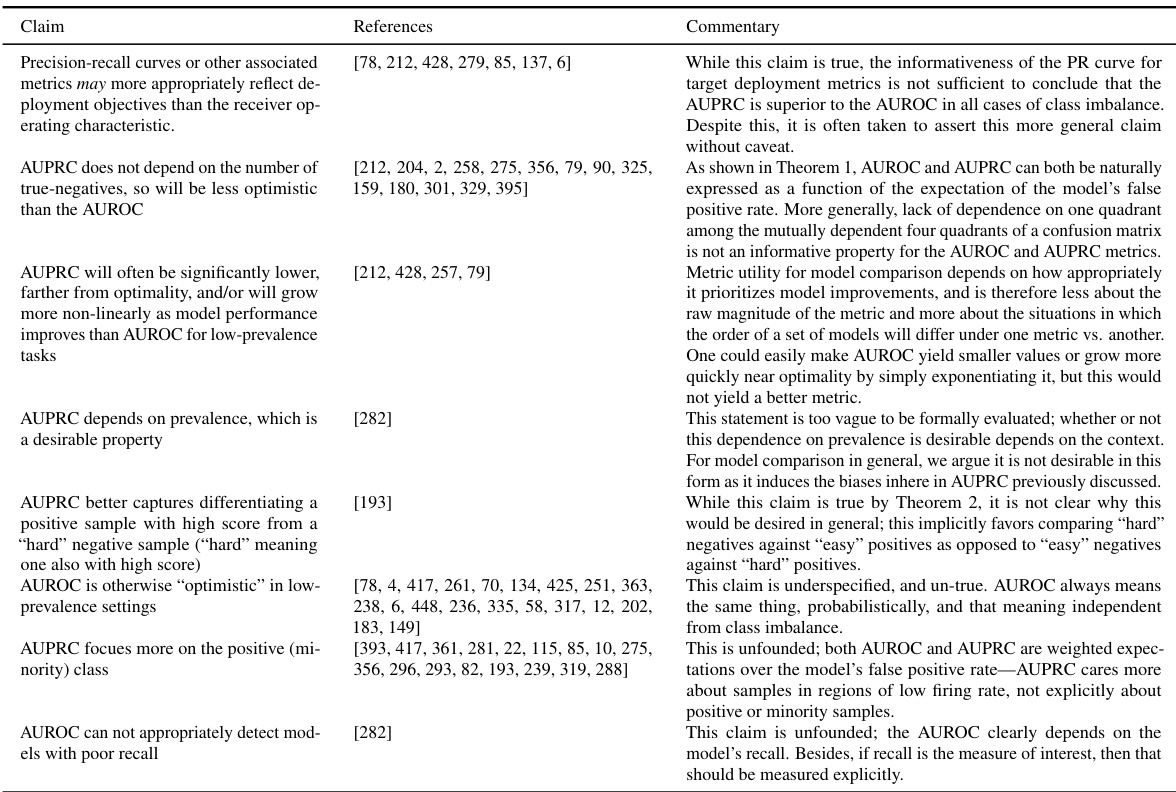
This table summarizes various arguments frequently used to support the claim that AUPRC is superior to AUROC in cases of class imbalance. For each argument, the table lists the references where the argument appears and provides a commentary analyzing the validity and nuances of the argument, highlighting cases where it is oversimplified or misapplied. The commentary section also provides context and clarifies the authors’ positions based on their theoretical findings.
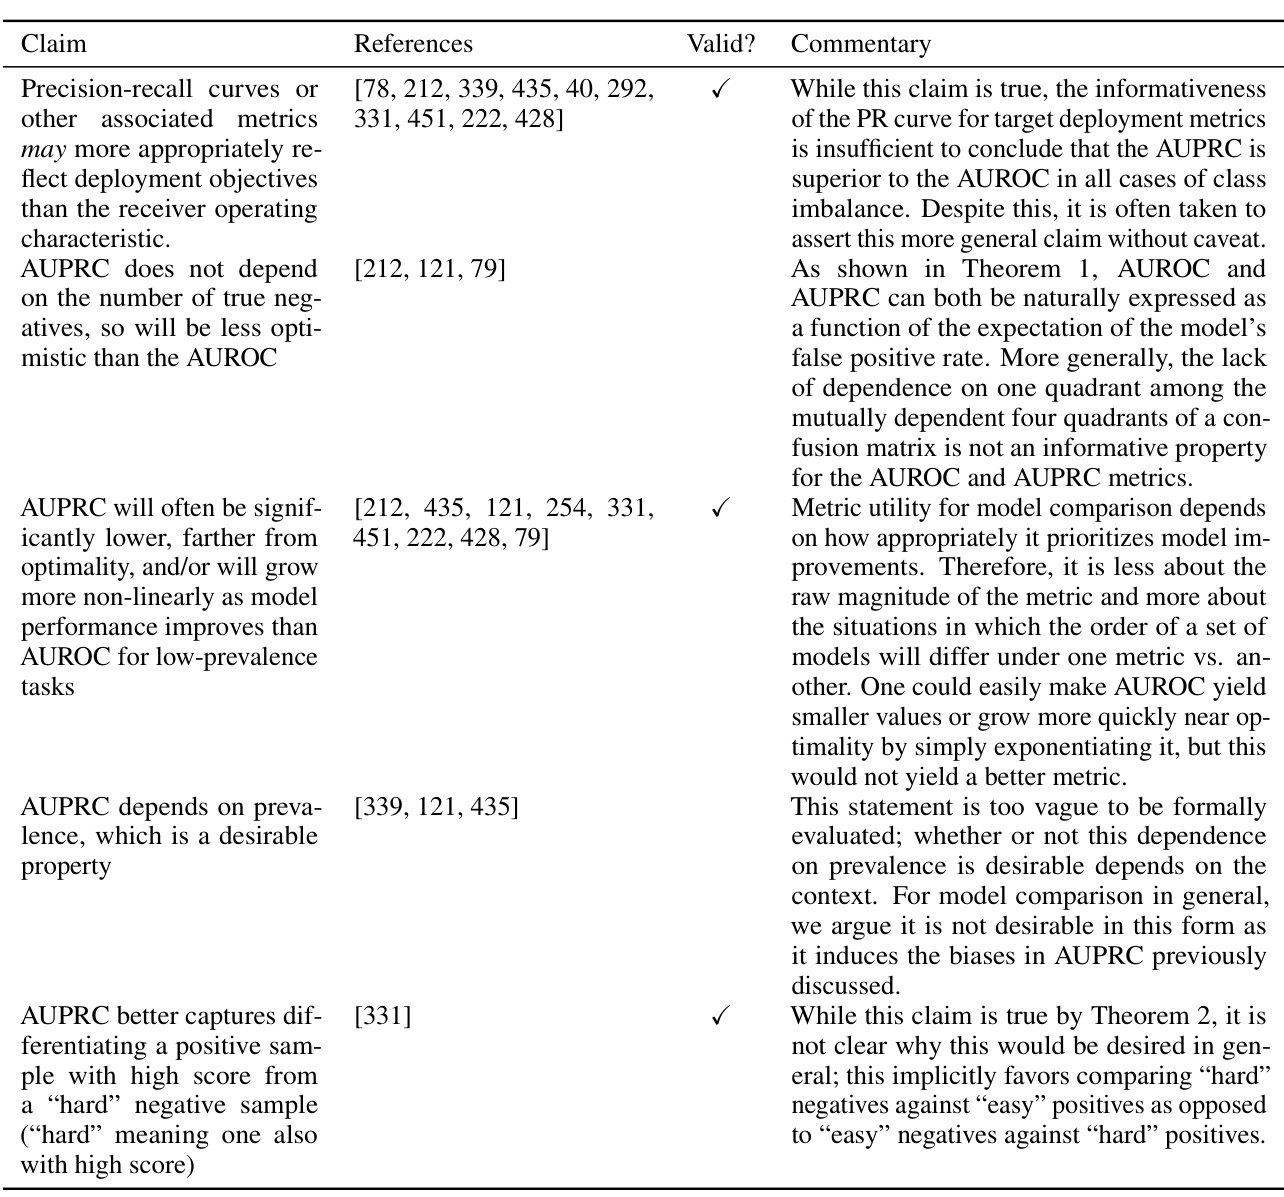
This table summarizes various arguments found in the literature supporting the claim that AUPRC is superior to AUROC in cases of class imbalance, along with the authors’ responses evaluating the validity of these arguments. Each argument is categorized, references to supporting papers are provided, and a commentary section explains the authors’ perspective on the validity and relevance of each argument in the context of their findings. The table helps to illustrate the prevalence and weaknesses of the common arguments used to justify the widespread yet ultimately flawed claim.
Full paper#


