↗ OpenReview ↗ NeurIPS Homepage ↗ Chat
TL;DR#
Graph alignment, crucial for various fields, is hampered by the NP-hardness of the quadratic assignment problem (QAP). Existing methods often employ intermediary representations (embeddings), simplifying the problem but potentially losing critical information and leading to suboptimal solutions. This paper tackles these limitations.
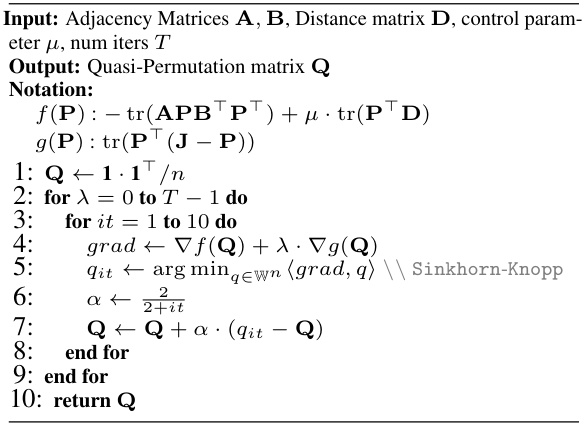
The proposed FUGAL method directly tackles the QAP using a novel optimization strategy that incorporates both adjacency matrices and structural features. By judiciously relaxing constraints and using a Frank-Wolfe algorithm with Sinkhorn distance, FUGAL achieves highly accurate alignments. Experiments consistently demonstrate its superiority over state-of-the-art methods across real-world and synthetic datasets.
Key Takeaways#
Why does it matter?#
This paper is crucial for researchers in graph alignment and related fields because it presents FUGAL, a novel method that significantly improves accuracy without sacrificing efficiency. Its unrestricted approach, directly working on adjacency matrices instead of relying on intermediary representations, opens up new possibilities for more accurate and efficient graph alignment. This advancement is especially relevant for analyzing complex real-world networks in various domains like biology, chemistry, and social sciences.
Visual Insights#

This figure shows the accuracy of FUGAL and various other state-of-the-art graph alignment algorithms on three real-world datasets (MultiMagna, Voles, and HighSchool) with varying levels of real-world noise (represented as a percentage of edges removed). The x-axis represents the dataset variant and the percentage of edges retained, and the y-axis represents the accuracy of the algorithm. The results demonstrate that FUGAL consistently outperforms the other methods in accuracy across all datasets and noise levels.

This table lists the hyperparameters used in the FUGAL algorithm for each of the benchmark datasets. The parameter μ controls the influence of node features in the optimization process; datasets with sparser graphs, characterized by lower connectivity, benefit from a higher μ value, while denser graphs perform better with lower μ values.
In-depth insights#
Graph Alignment#
Graph alignment, a crucial task in network analysis, aims to find a correspondence between nodes of two graphs. Its significance spans diverse fields, from biology (protein-protein interaction networks) to computer vision (feature matching). The inherent complexity arises from the NP-hard nature of the problem, often tackled using heuristics or approximations. Mediated approaches leverage intermediary representations like embeddings, simplifying the problem but potentially sacrificing accuracy. Conversely, unmediated methods directly operate on graph structures, attempting to find optimal node mappings, although computationally expensive. The ideal approach balances accuracy and efficiency, highlighting the need for innovative techniques to navigate this trade-off effectively. Feature-fortified methods offer a promising direction, incorporating additional node information to guide alignment and improve robustness.
FUGAL Method#
The FUGAL method presents a novel approach to graph alignment, addressing the limitations of existing methods by directly operating on adjacency matrices. Instead of relying on intermediate representations, which can lead to information loss, FUGAL tackles the core Quadratic Assignment Problem (QAP) directly. This is achieved through judicious constraint relaxation, allowing for efficient computation without sacrificing accuracy. A key innovation lies in the incorporation of a Linear Assignment Problem (LAP) term, leveraging structural graph features to improve alignment quality. This feature-fortified approach, coupled with a customized Frank-Wolfe optimization, makes FUGAL robust and scalable, leading to consistently superior performance on benchmark datasets. The unrestricted nature of FUGAL, unlike methods confined to intermediate spaces, represents a significant contribution in tackling the complex problem of graph alignment with improved accuracy and efficiency.
Experimental Setup#
A well-defined ‘Experimental Setup’ section is crucial for reproducibility and validation of research findings. It should detail the computational resources used, including hardware specifications and software versions, to ensure repeatability. Clearly outlining the datasets employed, including their sizes, characteristics (e.g., real-world vs. synthetic), and any preprocessing steps, is vital. The methodology for creating synthetic datasets should be explicitly described if applicable. Parameter settings for all algorithms and models should be meticulously documented, including justifications for specific choices or ranges. For baseline comparisons, the exact versions and configurations of existing methods used should be stated. Noise injection techniques and levels must be precisely specified, while evaluation metrics should be defined and their rationale justified. Addressing potential limitations and biases within the experimental design adds rigor and contributes to a thorough evaluation. A comprehensive ‘Experimental Setup’ empowers others to replicate the study’s results and fosters greater trust in the findings.
Accuracy Results#
An in-depth analysis of accuracy results in a research paper would involve examining the metrics used to evaluate accuracy, such as precision, recall, F1-score, or AUC. It’s crucial to understand the specific context of the problem and the implications of different types of errors. For example, in a medical diagnosis system, a false negative (failing to detect a disease) would be far more serious than a false positive. The choice of metric should reflect this. Next, a comparison with baseline models is vital. Are the improvements statistically significant? How much better does the proposed method perform compared to state-of-the-art solutions? What are the limitations of the baseline models? Careful analysis of error bars and confidence intervals is necessary to assess the reliability and stability of the results. Additionally, consider the distribution of errors; are they clustered in specific regions of the data? A visualization of results (e.g., confusion matrices, ROC curves) can reveal more than simple summary statistics. Finally, exploring the impact of various parameters on accuracy is needed. This can be done through sensitivity analysis or ablation studies to determine the importance of specific features or components.
Future Directions#
Future research could explore more sophisticated feature engineering techniques to enhance graph representation, potentially incorporating higher-order graph structures or incorporating node attributes beyond basic structural features. Investigating alternative optimization strategies beyond Frank-Wolfe, such as those leveraging gradient descent methods or advanced convex optimization techniques, could improve computational efficiency and scalability for larger graphs. A promising direction is in-depth analysis of FUGAL’s robustness to various noise models beyond the ones tested, particularly in real-world scenarios with complex noise patterns. Finally, extending FUGAL’s applicability to dynamic graphs and graphs with different types of edges (e.g., directed, weighted) is crucial for realistic applications, requiring the development of novel techniques to handle temporal dependencies and diverse edge properties.
More visual insights#
More on figures

This figure visualizes the accuracy of graph alignment algorithms on real-world datasets with varying levels of real-world noise. The x-axis represents different noise variants, and the y-axis shows accuracy. The results demonstrate FUGAL’s superior performance compared to other state-of-the-art graph alignment methods across all three datasets (MultiMagna, Voles, HighSchool). The consistent accuracy advantage of FUGAL highlights its robustness to real-world noise.

This figure displays the accuracy of various graph alignment methods under different graph densities and with one-way noise. The x-axes of the three subplots represent varying values for the parameters p (rewiring probability) and k (number of nearest neighbors), which control the density of the Newman-Watts graphs used in the experiment. The y-axis represents accuracy. The figure shows that FUGAL outperforms other methods, particularly in sparse graphs (low p), indicating its robustness to variations in graph density.

This figure shows the accuracy of FUGAL and other state-of-the-art graph alignment methods on three real-world datasets (MultiMagna, Voles, HighSchool) with varying levels of real-world noise. The x-axis represents different noise levels (variants #) or percentages of edges remaining in the graph. The y-axis shows the accuracy of graph alignment, indicating the percentage of correctly aligned nodes. The results demonstrate that FUGAL consistently outperforms other methods across all datasets and noise levels.

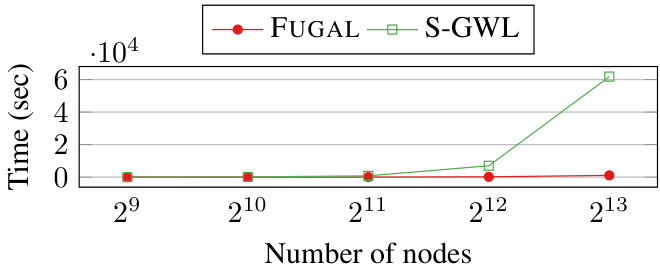
This figure demonstrates the scalability of FUGAL and S-GWL algorithms on Newman-Watts graphs with varying numbers of nodes. The x-axis represents the number of nodes (log scale), and the y-axis shows the running time in seconds. The figure reveals that as the number of nodes increases, FUGAL’s running time grows more slowly than S-GWL’s, indicating that FUGAL scales better to larger graph sizes. At 512 nodes, both algorithms have comparable running times; however, as the number of nodes increases, FUGAL outperforms S-GWL significantly.

This figure displays the accuracy of graph alignment methods under different noise conditions on four real-world datasets: inf-euroroad, arenas, ca-netscience, and bio-celegans. The top row shows results with one-way noise (edges removed from one graph), while the bottom row illustrates the results with bimodal noise (edges both removed and added). Each point on the graph represents the average accuracy at a specific noise level (percentage of edges affected). The results highlight the performance of FUGAL compared to other state-of-the-art methods in handling noise.

This figure compares the accuracy of different variants of the FUGAL algorithm under one-way noise conditions. Each variant uses a subset of the four structural features described in the paper (degree, clustering coefficient, mean degree of neighbors, and mean clustering coefficient of neighbors). FUGAL-0 uses none of these features, while FUGAL-i uses only the ith feature, and FUGAL uses all four features. The results show that using more structural features generally leads to higher accuracy, with FUGAL (using all four features) achieving the highest accuracy overall.

This figure compares the computational efficiency of FUGAL against several state-of-the-art graph alignment algorithms across various real-world and synthetic datasets. The x-axis represents different datasets, and the y-axis shows the running time in seconds (logarithmic scale). The figure highlights that FUGAL achieves competitive running times compared to other algorithms, particularly on larger datasets, showcasing its scalability and efficiency. While some baselines have slightly better times on smaller datasets, the substantial accuracy advantage of FUGAL makes its efficiency competitive in practice.

This figure compares the accuracy of FUGAL and several other graph alignment methods across four real-world datasets (inf-euroroad, arenas, ca-Netscience, and bio-celegans) under both one-way and bimodal noise conditions. One-way noise involves randomly removing edges from the target graph, while bimodal noise involves both adding and removing edges. The x-axis represents the percentage of noise added to the graphs (from 0% to 25%), and the y-axis represents the accuracy of the graph alignment. Each subplot represents a different dataset. The figure demonstrates the performance of FUGAL in comparison to other methods across different noise levels and across different datasets.

This figure compares the performance of several graph alignment algorithms on Erdős-Rényi random graphs of varying sizes. The left panel shows the accuracy of each algorithm, while the right panel shows the Frobenius distance between the Laplacian matrices of the aligned graphs. The results indicate that FUGAL, S-GWL, and PARROT achieve perfect alignment (accuracy of 1 and distance of 0) across all graph sizes. In contrast, other algorithms exhibit lower accuracy and larger distances, particularly as the graph size increases.

This figure displays the accuracy of various graph alignment algorithms on three real-world datasets (MultiMagna, Voles, HighSchool) with varying levels of real-world noise. The x-axis represents the noise level (variant # for MultiMagna, percentage of edges for Voles and HighSchool). The y-axis shows the accuracy of the algorithms. It demonstrates that FUGAL consistently outperforms other state-of-the-art methods across all datasets and noise levels.

This figure displays the accuracy results for real graphs with real noise. The x-axis represents different variants or noise levels, and the y-axis shows accuracy. Multiple lines represent the performance of different graph alignment algorithms (FUGAL, CONE, FAQ, PARROT, IsoRank, GOT, S-GWL, GW, GRAMPA, GRASP-B, FGW) across three datasets: MultiMagna, Voles, and HighSchool. The graph demonstrates FUGAL’s consistent superior performance compared to other state-of-the-art algorithms across various noise levels and graph structures. Note that this is a comparison of different methods on real world data which already has noise in it, rather than applying synthetic noise.

The figure shows the accuracy of FUGAL and other state-of-the-art graph alignment methods on three real-world datasets (MultiMagna, Voles, HighSchool) with varying levels of noise (percentage of edges). The x-axis represents the noise level, while the y-axis represents the accuracy. Each dataset has several variants, reflecting different noise conditions. The results demonstrate the superior accuracy of FUGAL across all datasets and noise levels compared to other methods.

This figure displays the accuracy of FUGAL and several other graph alignment algorithms on three real-world networks (MultiMagna, Voles, HighSchool) with varying levels of real noise. The x-axis represents the variant of the graph with added noise (different percentages of edges removed). The y-axis shows the accuracy of the algorithms. FUGAL consistently outperforms other methods across all datasets and noise levels.
More on tables

This table lists the values of the hyperparameter ( \mu ) used in the FUGAL algorithm for each of the benchmark datasets. The selection of ( \mu ) considers the sparsity of the graphs, with sparser graphs benefiting from higher values to emphasize node features.

This table lists the real-world datasets used in the paper’s benchmark experiments for graph alignment. For each dataset, it provides the number of nodes (n), the number of edges (m), and a brief description of the network type (e.g., communication, infrastructure, biological, etc.). This information is crucial for understanding the characteristics of the datasets used and how generalizable the results of the experiments are.

This table presents the accuracy of various graph alignment methods on the ACM and DBLP datasets. It shows that FUGAL significantly outperforms all other methods, achieving an accuracy of 0.487 compared to the next best method’s 0.183. The low accuracy of other methods indicates the challenge of aligning such large real-world graphs without utilizing additional information beyond the graph structure.

This table shows the values of the hyperparameter (\mu) used in the FUGAL algorithm for each of the benchmark datasets. The values of (\mu) are chosen based on the density of the graph; sparser graphs tend to have higher values of (\mu), while denser graphs have lower values. This is because sparser graphs have less information in the adjacency matrix, so it is more important to rely on node features to improve the accuracy of the algorithm.

This table shows the values of the hyperparameter (\mu) used in the FUGAL algorithm for each of the benchmark datasets used in the paper. The hyperparameter (\mu) controls the influence of the linear assignment problem (LAP) term in the overall optimization objective, balancing the importance of structural similarity with that of edge-wise similarity. The choice of (\mu) reflects the trade-off between the utility of including these features on alignment quality and the efficiency of computing these features. Sparser graphs benefit from higher (\mu) values because they contain less information in their adjacency matrices.
Full paper#


