↗ OpenReview ↗ NeurIPS Homepage ↗ Hugging Face ↗ Chat
TL;DR#
Large language models (LLMs) excel in NLP tasks, largely due to the attention mechanism and the softmax unit. However, the reasons behind LLMs’ ability to learn from just a few examples (in-context learning) are not fully understood. Existing work simplified this by studying linear self-attention without the softmax unit, revealing limitations. This research addresses this by exploring in-context learning using a softmax regression approach to encompass the behavior of the softmax unit, thus creating a more complete and realistic representation of LLMs’ functionality.
This paper investigates in-context learning in a simplified model using softmax regression, revealing a surprising theoretical closeness to gradient descent. The authors prove that the data transformations induced by a single self-attention layer and gradient descent on a loss function are both bounded, meaning their differences remain small and controlled. Numerical experiments also demonstrate a strong similarity between the model’s behaviors and predictions when training self-attention-only Transformers for fundamental regression tasks, confirming the theoretical findings. This contributes significantly to our understanding of in-context learning and the internal mechanisms of LLMs.
Key Takeaways#
Why does it matter?#
This paper is crucial for researchers in LLMs and in-context learning. It provides a novel theoretical framework that bridges the gap between in-context learning and gradient descent, offering new insights into the inner workings of LLMs. This understanding can lead to better model design and training strategies, potentially enhancing performance and efficiency.
Visual Insights#

This figure compares the performance of two models, namely a trained single self-attention (SA) layer with a softmax unit and a softmax regression model trained with one-step gradient descent (GD), on synthetic softmax regression tasks. The tasks are designed with document length n=200. The figure presents plots showing the losses of both models over training steps (a), and their differences and similarities over the training steps (b), including the prediction difference measured by the l2 norm, the model sensitivity difference, and the cosine similarity between the sensitivities of both models.
In-depth insights#
In-Context Learning#
In-context learning, a remarkable ability of large language models (LLMs), allows them to perform tasks based on a few examples provided within the input prompt, without explicit retraining. This capacity challenges traditional machine learning paradigms, where separate training and testing phases are fundamental. The paper explores this phenomenon focusing on the softmax regression model to investigate the parallels between in-context learning and gradient descent. The core idea revolves around the model’s ability to shift its internal weights based on the in-context examples, demonstrating an implicit learning process. This weight shifting, though not identical, shows considerable similarity to the iterative updates of gradient descent on a loss function. The theoretical analysis focuses on upper-bounding the data transformations induced by both in-context learning and gradient descent, highlighting that, under specific conditions, these transformations remain close, providing a theoretical justification for the observed empirical similarity. This research bridges the gap in our understanding of how LLMs learn without explicit parameter updates, offering insights into the fundamental mechanisms of in-context learning and its relation to traditional gradient-based methods.
Softmax Regression#
Softmax regression, a cornerstone of many machine learning models, particularly shines in multi-class classification problems. It elegantly transforms raw model outputs (often logits) into probability distributions over multiple classes, ensuring the probabilities sum to one. This probabilistic interpretation is crucial for understanding model confidence and making informed decisions. However, the softmax function’s inherent non-linearity presents challenges for both theoretical analysis and optimization. Its sensitivity to large input values can lead to numerical instability, necessitating careful consideration of scaling techniques during training. Despite these challenges, the softmax function’s ability to provide calibrated probabilities is highly valued, making it a preferred choice in applications where understanding class likelihood is paramount, such as in image recognition and natural language processing. The tradeoff between interpretability and computational efficiency is a critical consideration when employing softmax regression. Recent research focuses on mitigating the computational cost and improving the numerical stability of the softmax function, while preserving its desirable properties.
Gradient Descent#
Gradient descent is a fundamental optimization algorithm in machine learning, used to iteratively minimize a loss function by updating model parameters in the direction of the negative gradient. Its core concept is to iteratively adjust parameters to reduce the error between predicted and actual values. The algorithm’s effectiveness hinges on several factors, including the choice of learning rate (controlling the step size), the shape of the loss function (affecting convergence speed and the potential for getting stuck in local minima), and the presence of noise or variations in the data. Proper tuning of the learning rate is crucial, too small a learning rate leads to slow convergence, while too large a learning rate can cause instability and prevent convergence altogether. Different variants of gradient descent exist, such as batch gradient descent (using the entire dataset per iteration), stochastic gradient descent (using a single data point per iteration), and mini-batch gradient descent (using a small subset of the data), each with unique tradeoffs in computation time and convergence properties. The convergence of gradient descent is not always guaranteed, particularly with non-convex loss functions where the algorithm might get trapped in suboptimal solutions. Advanced techniques like momentum and adaptive learning rates are often employed to mitigate these issues and accelerate convergence. Despite potential challenges, gradient descent remains a cornerstone algorithm for training many machine learning models, and a deep understanding of its mechanics is vital for practitioners.
Theoretical Bounds#
A theoretical bounds section in a research paper would rigorously analyze the capabilities and limitations of a proposed model or algorithm. It would likely involve deriving mathematical expressions to quantify performance metrics such as accuracy, error rates, or computational complexity. The analysis might use simplifying assumptions to make the problem tractable, and the results would ideally be presented as upper and lower bounds on performance, highlighting best-case and worst-case scenarios. A strong theoretical bounds section would carefully discuss the assumptions made, their implications, and the scope of the results. It might also include comparisons to existing theoretical results, demonstrating how the new bounds improve upon or refine previous work. Furthermore, the discussion might explore the relationship between theoretical bounds and empirical observations, explaining any discrepancies. Tight bounds, where the upper and lower bounds are close together, are particularly valuable, providing a highly precise characterization of model performance. The ultimate goal would be to provide a robust and nuanced understanding of the model’s capabilities within a well-defined theoretical framework.
Empirical Validation#
An Empirical Validation section in a research paper would systematically test the study’s hypotheses or claims. This involves designing experiments or studies to collect data and then analyzing that data using appropriate statistical methods. A strong validation section would clearly describe the methodology, including the selection of participants or samples, data collection procedures, and the statistical tests used. The results would be presented clearly and concisely, with appropriate visualizations and statistical measures (e.g. p-values, effect sizes, confidence intervals) to assess the significance and magnitude of the findings. Crucially, the limitations of the empirical approach would also be addressed, acknowledging any potential biases, confounding factors, or generalizability issues. A discussion of how the findings support or contradict the study’s hypotheses is essential. Furthermore, the implications of the results, both for theory and practice, should be explored. In short, a robust empirical validation section goes beyond simply presenting results; it provides a transparent and rigorous evaluation of the research claims, thereby strengthening the overall credibility and impact of the study.
More visual insights#
More on figures

This figure compares the loss of two models (Gradient Descent and Trained Transformer) on synthetic softmax regression tasks with varying word embedding sizes (d). The x-axis represents the embedding size, and the y-axis represents the loss. The plot shows that the losses of the two models are similar across different embedding sizes.

This figure compares the performance of a single self-attention layer with softmax unit (approximating a full Transformer) and a softmax regression model trained with one-step gradient descent. It shows the losses over training steps, along with the prediction difference, model sensitivity difference, and cosine similarity between the two models. The results demonstrate the similarity in performance and alignment between the two models, particularly in terms of cosine similarity, which increases over training steps.

The figure compares the performance of the softmax regression model trained by gradient descent and the single self-attention layer with a softmax unit for document length n = 200. It shows the losses of two models and their difference and similarity over training steps. The results indicate similar performance of the two models.

This figure compares the performance of a single self-attention layer with a softmax unit (approximating a full Transformer) and a one-step gradient descent method on synthetic softmax regression tasks. The document length is 25 and embedding size is 20. The plots show the losses over training steps for both models, along with their prediction difference, model difference, and cosine similarity. This illustrates how closely the two models’ performance aligns.
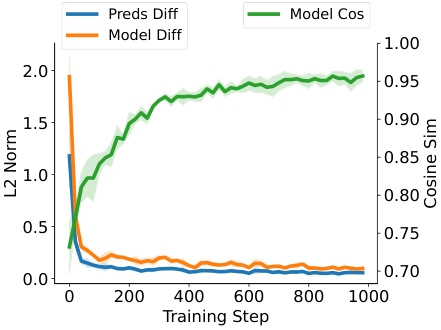
This figure compares the performance of a single self-attention layer with a softmax unit (approximating a full Transformer) and a softmax regression model trained with one-step gradient descent. The comparison is done on synthetic softmax regression tasks with document length n=25 and word embedding size d=20. The figure shows the losses over training steps for both models, and also displays the difference and similarity metrics between the two: Preds Diff (prediction difference), Model Diff (model sensitivity difference), and Model Cos (cosine similarity of model sensitivities). The results illustrate the similarity in performance and behavior between the two approaches.
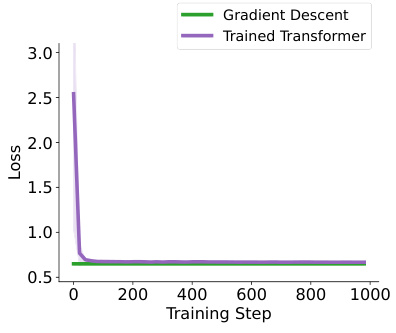
This figure compares the performance of a trained single self-attention layer with softmax unit and a softmax regression model trained with one-step gradient descent on softmax regression tasks with document length n=200. Subfigures (a) show the losses over training steps, while subfigures (b) show the differences and similarities between the two models (prediction difference, model sensitivity difference and cosine similarity).

This figure compares the performance of a single self-attention layer with softmax unit (approximating full Transformers) and a softmax regression model trained with one-step gradient descent on a synthetic softmax regression task. The document length (n) is 25, and the word embedding size (d) is 20. The plot shows the losses over training steps for both models, as well as the difference and similarity between their predictions and model sensitivities. The shaded areas represent the standard deviation across multiple independent repetitions. This figure demonstrates the similarity in performance and alignment between the two models on this specific task.

This figure compares the performance of a trained single self-attention layer with a softmax unit and a softmax regression model trained with one-step gradient descent on softmax regression tasks with a document length of 200. The figure shows three subplots: (a) Losses over training steps, (b) Difference and similarity over training steps. The results show that the two models exhibit similar performance and close alignment.
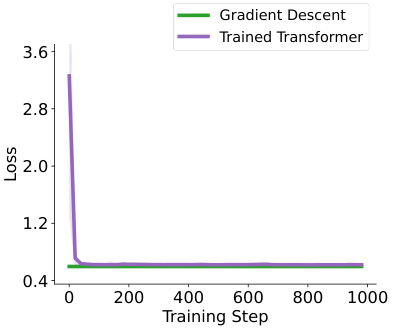
This figure compares the performance of a softmax regression model trained with one-step gradient descent (GD) and a trained single self-attention (SA) layer with a softmax unit on synthetic softmax regression tasks. The document length (n) is fixed at 200. The figure likely shows training loss curves for both models across training steps, perhaps also showing metrics like prediction difference and cosine similarity between the models’ predictions to illustrate their closeness.

This figure compares the performance of a trained single self-attention layer with a softmax unit and a softmax regression model trained with one-step gradient descent on synthetic softmax regression tasks with a document length of 200. The left panel (a) shows the losses over training steps for both models. The right panel (b) displays the difference and similarity between the two models over the training steps, including prediction difference, model sensitivity difference, and cosine similarity of model sensitivities.

This figure compares the performance of a softmax regression model trained with one-step gradient descent and a single self-attention layer with a softmax unit (approximating full Transformers) on synthetic softmax regression tasks. The document length is fixed at 200 words. The figure shows (a) the losses over training steps for both models and (b) their differences and similarities over training steps, measured by prediction differences, model sensitivity differences, and cosine similarity between the models’ sensitivities. This demonstrates the closeness in performance between gradient descent and the Transformer-based approach.

This figure compares the performance of a single self-attention layer with softmax unit (approximating full Transformers) and a softmax regression model trained with one-step gradient descent. The comparison is shown across training steps for a synthetic softmax regression task with a document length of 25 and a word embedding size of 20. The subfigures show the losses over training steps, the differences and similarities between the two models’ performances over the training steps.

This figure compares the performance of a single self-attention layer with softmax unit and one-step gradient descent on softmax regression tasks with a document length of 200. The figure shows that the two models have similar performances in terms of loss over training steps, and that the prediction and model differences decrease while the cosine similarity between the models increases over training steps. This indicates that the model learned by gradient descent and the Transformer show great similarity.

This figure presents a comparison of the performance of a trained single self-attention layer with a softmax unit (approximating full transformers) and a softmax regression model trained with one-step gradient descent. The comparison is done across training steps, showing the losses for both models, and also the prediction difference, model sensitivity difference and cosine similarity between the two models. This allows for a visual assessment of how similar the models’ behavior is.
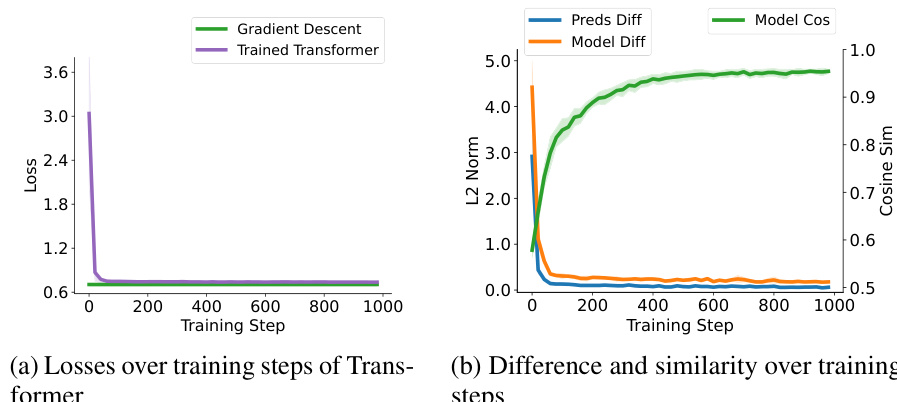
The figure shows the comparison results between a trained single self-attention layer with a softmax unit and a softmax regression model trained with one-step gradient descent. The left panel shows the losses over training steps for both models on synthetic softmax regression tasks with document length n=200. The right panel shows the differences and similarities of the two models over training steps measured by Prediction Difference (Preds Diff), Model Difference (Model Diff), and Model Cosine Similarity (Model Cos).
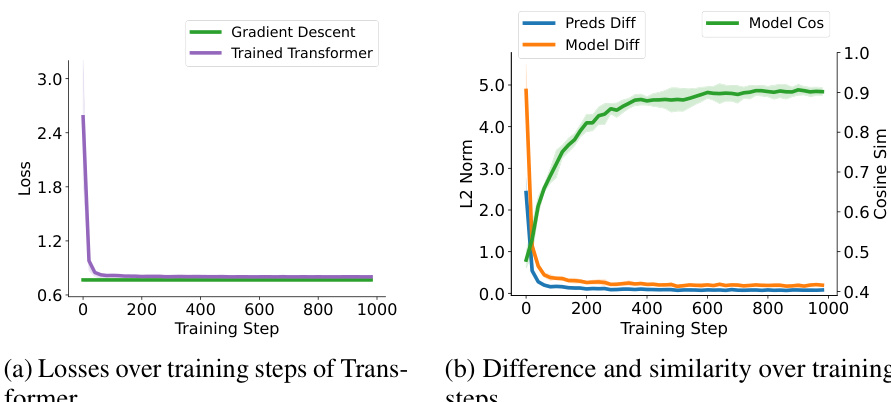
This figure compares the performance of a trained single self-attention layer with softmax unit and a softmax regression model trained with one-step gradient descent on synthetic softmax regression tasks with a document length of 200. The left subplot shows losses over training steps, and the right subplot displays the differences and similarities between the two models over the training steps. The figure helps to visualize the closeness of in-context learning and weight shifting for softmax regression.
Full paper#


