↗ OpenReview ↗ NeurIPS Homepage ↗ Chat
TL;DR#
Conformal prediction (CP) is a powerful tool for uncertainty quantification, but it often suffers from large prediction sets, especially in class-conditional settings with many or imbalanced classes. This significantly limits its applicability in high-stakes decision-making. Existing class-conditional CP methods often produce large prediction sets, hindering practical use. This paper addresses this issue by proposing a solution that doesn’t compromise on the valid coverage guarantee.
The proposed Rank Calibrated Class-conditional CP (RC3P) algorithm uses label rank calibration to selectively iterate the class-wise thresholding subroutine only for a subset of classes. This leads to smaller prediction sets without sacrificing the valid class-wise coverage. RC3P’s model-agnostic nature and superior performance (demonstrated through comprehensive experiments on imbalanced real-world datasets) make it a valuable tool for researchers needing high-confidence predictions with improved predictive efficiency.
Key Takeaways#
Why does it matter?#
This paper is crucial for researchers working on uncertainty quantification and conformal prediction, particularly those dealing with imbalanced classification datasets. It offers a novel solution to a significant challenge in the field: achieving class-wise coverage with smaller prediction sets, improving the efficiency and usability of conformal prediction methods in high-stakes applications. The provided theoretical analysis and empirical results provide strong support for the method’s effectiveness and open up avenues for future research on improving the predictive efficiency of CP.
Visual Insights#

This figure shows the class-conditional coverage and prediction set size for four different datasets (CIFAR-10, CIFAR-100, mini-ImageNet, and Food-101) using three different methods (CCP, Cluster-CP, and RC3P). The top row shows the class-conditional coverage, demonstrating that RC3P achieves higher coverage above the target threshold (0.9) compared to the other methods. The bottom row displays the prediction set size, highlighting that RC3P generates significantly smaller prediction sets than CCP and Cluster-CP, especially for CIFAR-100, mini-ImageNet, and Food-101.

This table presents the average prediction set sizes (APSS) achieved by three different conformal prediction methods (CCP, Cluster-CP, and RC3P) on four imbalanced image classification datasets (CIFAR-10, CIFAR-100, mini-ImageNet, Food-101). The results are broken down by three imbalance types (EXP, POLY, MAJ) and two imbalance ratios (p=0.5, p=0.1). The ResNet-20 model was trained for 200 epochs. The under coverage ratio (UCR) was controlled to ensure a fair comparison of the methods. RC3P shows significant improvement in prediction set size compared to CCP and Cluster-CP.
In-depth insights#
Class-wise Coverage#
Class-wise coverage in conformal prediction (CP) addresses the challenge of achieving reliable uncertainty quantification for each class individually, especially crucial when dealing with imbalanced datasets. Standard CP methods often generate large prediction sets, impacting usability. Class-wise coverage aims to create prediction sets that guarantee a minimum probability of including the true label for each class. This is a significant improvement, as it ensures fairness and accuracy across all classes, rather than providing an overall marginal coverage that could mask poor performance on specific classes. This granular level of coverage is particularly important for applications like medical diagnosis, where the cost of misclassifying different classes varies greatly. Achieving class-wise coverage with small prediction sets is a key goal, as overly large sets diminish the practical value of CP. Therefore, research focuses on developing efficient algorithms that balance the strict requirement of class-wise coverage with the need for concise and informative prediction sets.
Label Rank Calib#
A hypothetical heading, ‘Label Rank Calib,’ suggests a method refining class-conditional conformal prediction. It likely involves calibrating the rank of predicted labels from a classifier, instead of uniformly considering all classes. This is crucial for improving efficiency by focusing on more confident predictions. This rank calibration likely uses a threshold or score related to the classifier’s confidence in its top-k predictions for each class. The approach addresses the challenge of large prediction sets in class-conditional conformal prediction, especially with imbalanced or many classes. The calibration process likely aims to selectively apply the conformal method, improving efficiency and maintaining class-wise coverage guarantees. The resulting algorithm would likely prioritize labels with higher confidence and smaller top-k errors, thus reducing the size of prediction sets. It’s important to note that such a method requires careful analysis to prove it maintains the valid coverage properties of conformal prediction.
RC3P Algorithm#
The RC3P algorithm stands out for its innovative approach to conformal prediction, particularly in tackling class-wise coverage with many classes. It cleverly augments standard class-conditional conformal prediction (CCP) by integrating a label rank calibration strategy. This strategic addition allows RC3P to selectively apply the CCP thresholding subroutine, focusing only on a subset of the most “certain” class labels for each prediction. The selection is guided by a class-wise top-k error, ensuring that only labels with sufficient confidence are used, leading to smaller prediction sets. Importantly, RC3P’s class-wise coverage guarantee is model-agnostic, meaning it holds regardless of the underlying classifier and data distribution. This is a significant advantage over other methods that often rely on model-specific assumptions. The theoretical analysis further supports the effectiveness of this approach, proving a reduction in prediction set size compared to traditional CCP. The empirical results confirm the theoretical findings, demonstrating average prediction size reductions and maintained class-wise coverage across diverse real-world datasets. The overall contribution of RC3P is substantial, marking a significant improvement in the efficiency and reliability of conformal prediction for multi-class classification problems.
Predictive Efficiency#
Predictive efficiency, in the context of conformal prediction, refers to the size of the prediction sets generated by the model. Smaller prediction sets are desirable as they offer more precise and actionable predictions. The paper highlights that predictive efficiency often competes with coverage validity, meaning that efforts to reduce prediction set size might compromise the guarantee that the true label is included. The core of the proposed RC3P algorithm lies in improving predictive efficiency without sacrificing the class-wise coverage validity. RC3P achieves this by incorporating label rank calibration. This strategy intelligently prioritizes classes with high certainty according to their rank in the classifier’s output, effectively reducing the number of classes that need to be considered during the thresholding process. The paper provides theoretical analysis supporting the enhanced efficiency and presents comprehensive experimental results demonstrating the average reduction in prediction set size is notable. The model-agnostic nature of the algorithm is crucial, as it ensures the benefits apply broadly, irrespective of the underlying model used. The improved efficiency directly translates to practical benefits in applications involving many and/or imbalanced classes where smaller prediction sets are crucial for efficient decision making.
Future Research#
Future research directions stemming from this paper on conformal prediction could explore several key areas. Extending RC3P to handle more complex data types beyond classification, such as structured data or time series, would significantly broaden its applicability. Investigating the impact of different non-conformity scores on RC3P’s performance is crucial, as the choice of score function significantly impacts both coverage and efficiency. A theoretical analysis to establish tighter bounds on prediction set size reduction would strengthen the theoretical foundation of RC3P. Developing more efficient calibration techniques to speed up the process and reduce computational burden is a practical goal. Finally, empirical evaluation on a wider range of datasets with varying characteristics and levels of class imbalance is essential to further validate and generalize the findings.
More visual insights#
More on figures

This figure visualizes the normalized frequency distribution of label ranks in the prediction sets generated by three different methods (CCP, Cluster-CP, and RC3P) for imbalanced datasets with imbalance type EXP and a mis-coverage rate of 0.1. The models used were trained for 200 epochs. The results show that RC3P produces a distribution with lower label ranks and a shorter tail compared to CCP and Cluster-CP, indicating a more effective use of lower-ranked labels in its predictions.

This figure empirically validates the theoretical condition (Equation 6 and Lemma 4.2) for RC3P to achieve better predictive efficiency than CCP. It shows the distribution of the condition numbers (σy) across different classes for the CIFAR-10, CIFAR-100, mini-ImageNet, and Food-101 datasets. The vertical dashed line indicates a σy value of 1. Since all observed σy values are below 1, the condition is satisfied, suggesting that RC3P should produce smaller prediction sets than CCP for the given settings.

This figure shows three different ways to create imbalanced datasets from a balanced dataset. The x-axis represents the class index, and the y-axis represents the number of training examples in each class. (a) shows an exponential decay, (b) shows a polynomial decay, and (c) shows a majority-based decay. These illustrate the different distributions of data that can occur with imbalanced datasets, where some classes have far fewer examples than others.

This figure shows the class-conditional coverage and prediction set size for four different datasets (CIFAR-10, CIFAR-100, mini-ImageNet, and Food-101) using three different conformal prediction methods (CCP, Cluster-CP, and RC3P). The top row shows the distribution of class-wise coverage, demonstrating that RC3P achieves a higher coverage above the target threshold (0.9) than the other two methods. The bottom row illustrates the distribution of prediction set sizes, revealing that RC3P generates significantly smaller prediction sets, improving predictive efficiency while maintaining class-wise coverage.

This figure compares the performance of three class-conditional conformal prediction methods (CCP, Cluster-CP, and RC3P) in terms of class-wise coverage and prediction set size on four imbalanced datasets. The top row shows the class-wise coverage achieved by each method, while the bottom row shows the distribution of prediction set sizes. The results demonstrate that RC3P achieves similar coverage to the other methods while generally producing significantly smaller prediction sets, particularly on CIFAR-100, mini-ImageNet, and Food-101.

This figure compares the performance of three class-conditional conformal prediction methods (CCP, Cluster-CP, and RC3P) on four imbalanced datasets. The top row shows the class-conditional coverage, while the bottom row displays the prediction set sizes. The results demonstrate that RC3P achieves higher class-conditional coverage and smaller prediction set sizes than the other two methods, particularly on CIFAR-100, mini-ImageNet, and Food-101.
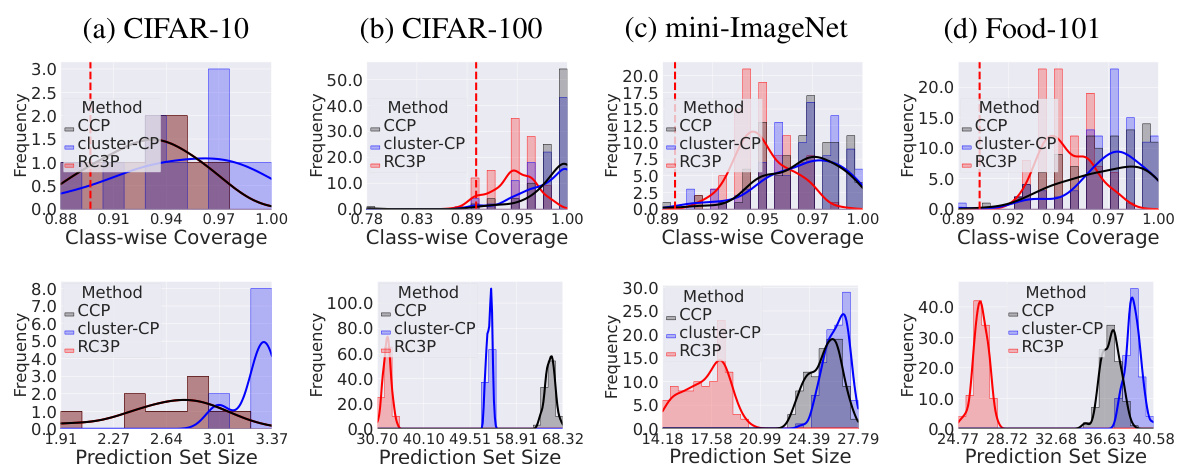
This figure shows the class-conditional coverage and prediction set size for four different datasets (CIFAR-10, CIFAR-100, mini-ImageNet, Food-101) with an imbalance ratio of p=0.1 and using the exponential decay type. The top row displays histograms of the class-wise coverage for each method (CCP, Cluster-CP, and RC3P), demonstrating that RC3P achieves higher class-conditional coverage above 0.9 (the target 1-α). The bottom row shows histograms of prediction set sizes, illustrating that RC3P produces significantly smaller prediction sets, especially for CIFAR-100, mini-ImageNet, and Food-101.

This figure shows the class-conditional coverage and prediction set size for four different datasets (CIFAR-10, CIFAR-100, mini-ImageNet, and Food-101) using three different methods (CCP, Cluster-CP, and RC3P). The top row displays the class-conditional coverage for each method, while the bottom row shows the prediction set sizes. The results demonstrate that RC3P outperforms CCP and Cluster-CP in terms of both coverage and prediction set size, particularly for CIFAR-100, mini-ImageNet, and Food-101.

This figure visualizes the normalized frequency distribution of label ranks in the prediction sets generated by three different methods: CCP, Cluster-CP, and RC3P. It shows that RC3P uses lower-ranked labels more frequently than the other two methods, indicating improved predictive efficiency. The shorter tail of the distribution for RC3P further suggests that RC3P produces more concise prediction sets.

This figure visualizes the distribution of label ranks used in prediction sets generated by CCP, Cluster-CP, and RC3P methods. It shows that RC3P utilizes significantly fewer high-ranked labels compared to the other methods, implying better predictive efficiency. This is further highlighted by the shorter tail in the probability density function of label ranks for RC3P, indicating a preference for more certain predictions.

This figure visualizes the normalized frequency distribution of label ranks in prediction sets generated by three different methods: CCP, Cluster-CP, and RC3P. The experiment used the EXP imbalance type with p=0.1 and a miscoverage rate (alpha) of 0.1. Models were trained for 200 epochs. The results show that RC3P uses lower-ranked labels more frequently than the other methods, indicated by a shorter tail in the probability distribution. This suggests that RC3P incorporates less uncertain predictions (higher ranked labels) into its prediction sets.

This figure visualizes the frequency distribution of label ranks within prediction sets generated by three different methods: CCP, Cluster-CP, and RC3P. The results show that RC3P tends to incorporate lower-ranked labels, indicating improved predictive efficiency. This efficiency is further emphasized by the shorter tail of the probability density function for label ranks in RC3P’s predictions, suggesting a greater focus on more certain predictions.

This figure visualizes the normalized frequency distribution of label ranks in the prediction sets generated by three different class-conditional conformal prediction methods: CCP, Cluster-CP, and RC3P. The results are shown for an imbalanced dataset with an exponential decay in class distribution (EXP) with a miscoverage rate (alpha) of 0.1, and models trained for 200 epochs. The key observation is that RC3P produces a significantly lower frequency of high-ranked labels in its prediction sets compared to CCP and Cluster-CP, indicating a greater emphasis on more certain predictions.

This figure verifies the condition in Lemma 4.2 of the paper. The condition number σy is computed for each class and plotted in a histogram. The vertical dashed lines indicate the value 1. Since all the computed σy values are less than 1, it confirms that RC3P produces smaller prediction sets than CCP. This is because the combined calibration on non-conformity scores and label ranks of RC3P leads to better trade-off between coverage and efficiency compared to CCP.

This figure shows the empirical verification of the condition numbers (σy) from Equation 6 in the paper. Each histogram represents the distribution of σy values for one of four datasets (CIFAR-10, CIFAR-100, mini-ImageNet, Food-101). The vertical dashed line indicates a value of 1. Because all histograms show that the condition numbers are below 1, this provides empirical support for Lemma 4.2 in the paper, which states that the proposed algorithm (RC3P) produces smaller prediction sets than the baseline method (CCP). The improved efficiency comes from the combined calibration of conformity scores and label ranks.

This figure shows the verification of condition numbers (σy) calculated using Equation 6. The x-axis represents the calculated σy values, and the y-axis represents the frequency of those values. The vertical dashed lines indicate the value of 1. The results show that all calculated σy values are less than 1, which confirms the conditions for Lemma 4.2 and that RC3P produces smaller prediction sets than CCP due to the optimized trade-off between calibration using non-conformity scores and label ranks.

This figure empirically validates the theoretical finding in Lemma 4.2 and Equation 6 that supports the efficiency improvement of RC3P over CCP. The condition number σy is calculated for each class and is shown to be less than 1, satisfying the condition for improved efficiency. This confirms that the combined calibration strategy of RC3P on conformity scores and label ranks leads to smaller prediction sets, as theoretically proven.

This figure empirically validates the theoretical finding (Lemma 4.2) that RC3P produces smaller prediction sets than CCP. It shows the distribution of the condition numbers (σy), which quantify the predictive efficiency gain of RC3P over CCP. The fact that all σy values are below 1 supports the theoretical claim, indicating that RC3P’s combined calibration strategy consistently leads to smaller prediction sets.

This figure shows the verification of the condition numbers (σy) for the proposed RC3P algorithm. The condition number is defined in Equation 6, and it is a measure of the predictive efficiency improvement of RC3P over CCP. The condition numbers are computed for four datasets (CIFAR-10, CIFAR-100, mini-ImageNet, Food-101) with imbalance type EXP and ratio p = 0.1, and models trained for 200 epochs. The vertical dashed lines represent the value 1. Since all condition numbers are smaller than 1, this verifies the validity of Lemma 4.2, and therefore RC3P’s predictive efficiency improvement over CCP.

This figure empirically validates the theoretical finding in Lemma 4.2 and Equation (6) of the paper. It demonstrates that the condition numbers (σy) for all classes (y) are less than 1. This inequality is a crucial condition for RC3P to guarantee that its predictive efficiency is better than the baseline CCP method, and this figure empirically verifies the condition. By selectively applying the conformal thresholding subroutine based on the label ranks of the classifier’s prediction, RC3P effectively reduces the size of the prediction sets compared to the uniform thresholding used in CCP, while maintaining the class-wise coverage guarantee.

This figure empirically validates the theoretical finding (Equation 6 and Lemma 4.2) that the condition number σy is less than 1. The condition number σy compares the probability of a test sample falling within the prediction set of RC3P to the probability of it falling within the prediction set of CCP. The fact that σy < 1 means that RC3P produces smaller prediction sets than CCP, improving predictive efficiency.

This figure shows the results of experiments comparing three class-conditional conformal prediction methods (CCP, Cluster-CP, and RC3P) on four imbalanced datasets. The top row displays the class-conditional coverage, showing that RC3P achieves higher coverage above the target (1-α) than the other methods. The bottom row illustrates the average prediction set sizes, demonstrating that RC3P produces significantly smaller prediction sets than CCP and Cluster-CP on three of the four datasets (CIFAR-100, mini-ImageNet, and Food-101).

This figure shows the empirical verification of the condition σy ≤ 1 (Equation 6 in the paper) for the proposed RC3P algorithm. The condition ensures that RC3P produces smaller prediction sets than the baseline CCP method. The histograms represent the distribution of the condition number σy for each class across four different datasets (CIFAR-10, CIFAR-100, mini-ImageNet, Food-101) using the EXP imbalance type with ratio p = 0.1 and training for 200 epochs. The vertical dashed lines indicate the threshold of 1. The fact that most of the distributions are concentrated below 1 empirically supports the theoretical finding and the advantage of RC3P.

This figure empirically validates the theoretical finding in Lemma 4.2 and Equation 6, demonstrating that RC3P achieves improved predictive efficiency compared to CCP. The histogram shows the distribution of condition numbers (σy) across different classes, all of which are less than 1. This supports the claim that RC3P produces smaller prediction sets due to the combined calibration on non-conformity scores and label ranks.
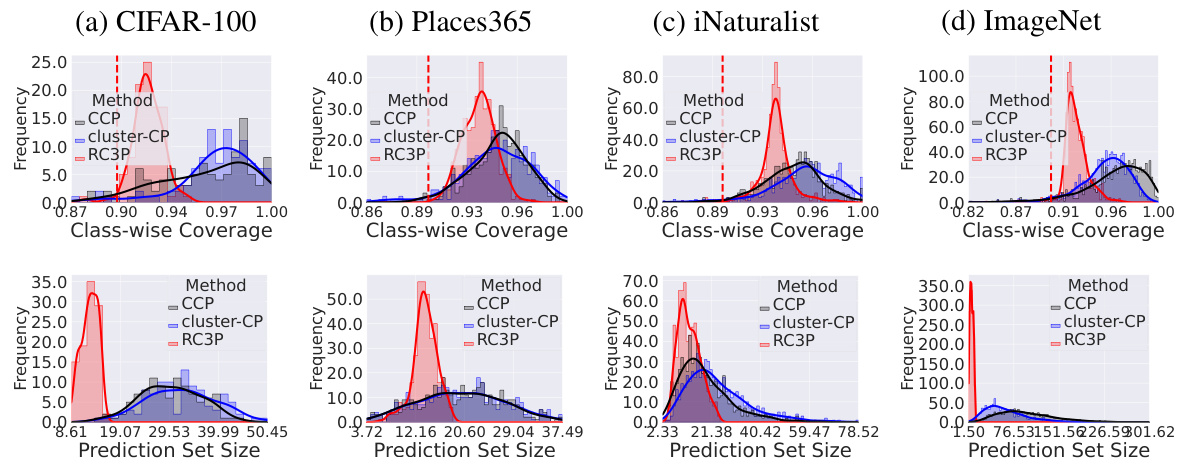
This figure shows the class-conditional coverage and prediction set size distributions for CCP, Cluster-CP, and RC3P methods on four datasets (CIFAR-10, CIFAR-100, mini-ImageNet, and Food-101) with an imbalance ratio of 0.1. The top row displays histograms of class-wise coverage, showing that RC3P achieves coverage above the target (0.9) more often than the other methods. The bottom row shows histograms of prediction set sizes, demonstrating that RC3P consistently produces smaller prediction sets, especially noticeable on CIFAR-100, mini-ImageNet, and Food-101.

This figure visualizes the normalized frequency distribution of label ranks in the prediction sets generated by three different methods: CCP, Cluster-CP, and RC3P. The results indicate that RC3P uses fewer labels with higher ranks compared to other methods. The shorter tail of RC3P’s probability density function further supports this conclusion, implying a higher focus on more certain predictions.

This figure shows the verification of the condition numbers (σy) used in Lemma 4.2 to guarantee the improved efficiency of RC3P over CCP. The condition number is calculated for four datasets (CIFAR-100, Places365, iNaturalist, ImageNet). The histograms show the distribution of (σy) for each dataset, and the vertical dashed lines indicate the value 1. The results demonstrate that RC3P produces smaller prediction sets because all condition numbers are below 1, fulfilling the condition of Lemma 4.2.
More on tables

This table presents the average prediction set size (APSS) results for four imbalanced datasets (CIFAR-10, CIFAR-100, mini-ImageNet, Food-101) using three different conformal prediction methods: CCP, Cluster-CP, and the proposed RC3P. The experiments were conducted with a ResNet-20 model trained for 200 epochs, using different imbalance types and ratios, and with a mis-coverage rate of α = 0.1. The results demonstrate that RC3P consistently achieves smaller prediction sets than CCP and Cluster-CP while maintaining similar coverage validity.

This table presents a comparison of the average prediction set size (APSS) achieved by three different class-conditional conformal prediction methods (CCP, Cluster-CP, and RC3P) on four imbalanced datasets (CIFAR-10, CIFAR-100, mini-ImageNet, and Food-101). The comparison is made across various imbalance types and ratios, using the ResNet-20 model trained for 200 epochs with a miscoverage rate (α) of 0.1. The under coverage ratio (UCR) is controlled to ensure a fair comparison. The results show that RC3P consistently achieves smaller prediction sets than the other methods.

This table presents a comparison of the average prediction set sizes (APSS) of three class-conditional conformal prediction methods (CCP, Cluster-CP, and RC3P) on four imbalanced datasets (CIFAR-10, CIFAR-100, mini-ImageNet, Food-101). The experiment uses a ResNet-20 model trained for 200 epochs and considers different imbalance ratios and types. RC3P consistently shows a significant reduction in APSS compared to the other methods while maintaining class-wise coverage.

This table presents a comparison of the average prediction set size (APSS) for three different conformal prediction methods: CCP, Cluster-CP, and the proposed RC3P, on four imbalanced datasets. The results show the impact of different imbalance types and ratios, with RC3P demonstrating significant improvements in predictive efficiency (smaller prediction sets) while maintaining the desired coverage guarantee.

This table presents a comparison of the average prediction set size (APSS) of three conformal prediction methods (CCP, Cluster-CP, and RC3P) on four imbalanced datasets (CIFAR-10, CIFAR-100, mini-ImageNet, Food-101) with different imbalance ratios and types. The results demonstrate that RC3P significantly outperforms the other methods in terms of reducing the average prediction set size while maintaining the desired coverage.

This table presents a comparison of the average prediction set size (APSS) achieved by three different class-conditional conformal prediction methods: CCP, Cluster-CP, and RC3P. The comparison is made across four different datasets (CIFAR-10, CIFAR-100, mini-ImageNet, Food-101) under various imbalance types and ratios. The under coverage ratio (UCR) is controlled to ensure a fair comparison, and the results show that RC3P significantly reduces the prediction set size compared to CCP and Cluster-CP.

This table presents a comparison of the average prediction set size (APSS) of three conformal prediction methods (CCP, Cluster-CP, and RC3P) on four imbalanced datasets (CIFAR-10, CIFAR-100, mini-ImageNet, Food-101) using ResNet-20 models trained for 200 epochs. The experiment uses a miscoverage rate (alpha) of 0.1 and explores different imbalance types and ratios. The UCR (Under Coverage Ratio) is controlled to ensure a fair comparison, and the results demonstrate RC3P’s superior performance in producing smaller prediction sets.

This table presents a comparison of the average prediction set sizes (APSS) of three different class-conditional conformal prediction methods (CCP, Cluster-CP, and RC3P) on four imbalanced datasets. The results are shown for different imbalance types and ratios, with a miscoverage rate (α) of 0.1. The UCR (Under Coverage Ratio) was controlled to ensure a fair comparison. RC3P consistently achieves smaller prediction set sizes than the other methods, demonstrating its improved predictive efficiency.

This table presents a comparison of the average prediction set size (APSS) achieved by three different class-conditional conformal prediction (CCP) methods: CCP, Cluster-CP, and the proposed RC3P, on four imbalanced datasets (CIFAR-10, CIFAR-100, mini-ImageNet, and Food-101). The results are shown for different imbalance types and ratios (p=0.5 and p=0.1). The under coverage ratio (UCR) is controlled to ensure a fair comparison. The table highlights that RC3P consistently outperforms both CCP and Cluster-CP in terms of achieving smaller prediction set sizes, showing a significant reduction in size.

This table presents a comparison of the average prediction set size (APSS) for three different conformal prediction methods: CCP, Cluster-CP, and the proposed RC3P method. The comparison is done across four datasets (CIFAR-10, CIFAR-100, mini-ImageNet, Food-101) under various imbalance conditions (EXP, POLY, MAJ types and different ratios of imbalance). The under coverage ratio (UCR) is controlled to ensure a fair comparison. The results show that RC3P consistently achieves smaller prediction sets while maintaining class-wise coverage.

This table presents a comparison of the average prediction set size (APSS) for three different conformal prediction methods (CCP, Cluster-CP, and RC3P) on four imbalanced datasets (CIFAR-10, CIFAR-100, mini-ImageNet, and Food-101) with different imbalance ratios and types. The results show RC3P significantly reduces the prediction set size while maintaining the desired coverage.

This table presents a comparison of the average prediction set size (APSS) for three different conformal prediction methods (CCP, Cluster-CP, and RC3P) on four imbalanced datasets (CIFAR-10, CIFAR-100, mini-ImageNet, Food-101). The experiments were conducted using a ResNet-20 model trained for 200 epochs with a miscoverage rate (α) of 0.1. The results show that RC3P significantly outperforms the other two methods in terms of reducing the average prediction set size, achieving a 24.47% reduction across all four datasets and a 32.63% reduction when excluding CIFAR-10.

This table presents a comparison of the average prediction set size (APSS) of three conformal prediction methods (CCP, Cluster-CP, and RC3P) on four imbalanced datasets (CIFAR-10, CIFAR-100, mini-ImageNet, Food-101) under various imbalance settings (imbalance type and ratio). The results demonstrate RC3P’s effectiveness in reducing the size of prediction sets while maintaining class-wise coverage.

This table presents the average prediction set sizes (APSS) for different imbalance ratios and types, comparing the performance of RC3P against CCP and Cluster-CP on four datasets using the ResNet-20 model. It highlights RC3P’s significant improvement in predictive efficiency (smaller prediction sets) while maintaining class-wise coverage.
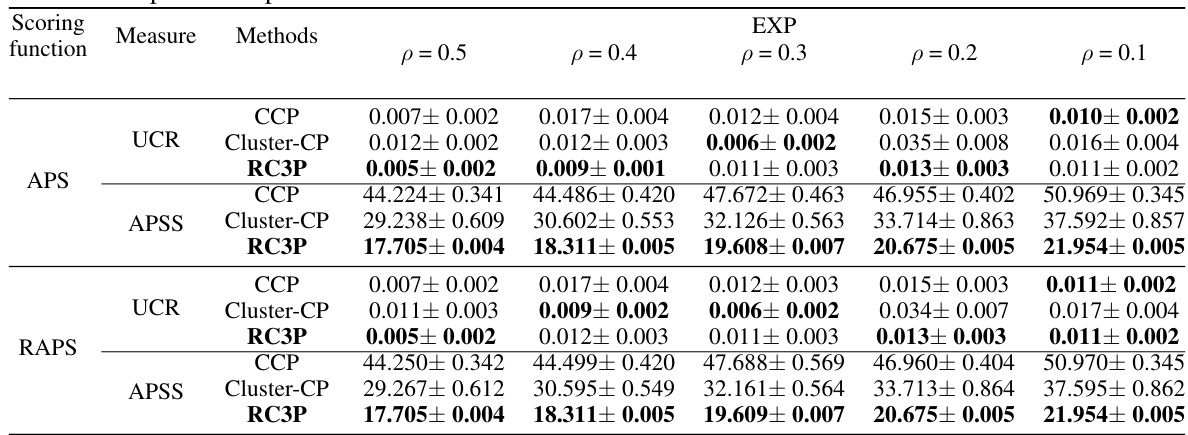
This table presents a comparison of the average prediction set size (APSS) for three different conformal prediction methods: CCP, Cluster-CP, and the proposed RC3P, on four imbalanced datasets. The results are shown for various imbalance types and ratios, and using the ResNet-20 model with 200 epochs of training. The under coverage ratio (UCR) is controlled to ensure a fair comparison of APSS among the methods. The table highlights the significant improvement in predictive efficiency achieved by RC3P compared to the baseline methods.

This table presents a comparison of the average prediction set size (APSS) for three different conformal prediction methods (CCP, Cluster-CP, and RC3P) on four imbalanced datasets (CIFAR-10, CIFAR-100, mini-ImageNet, Food-101). The experiments are conducted with a ResNet-20 model trained for 200 epochs, using different imbalance types and ratios, and a miscoverage rate (α) of 0.1. The Under Coverage Ratio (UCR) is controlled to ensure a fair comparison, and the results show that RC3P significantly reduces prediction set size compared to CCP and Cluster-CP.
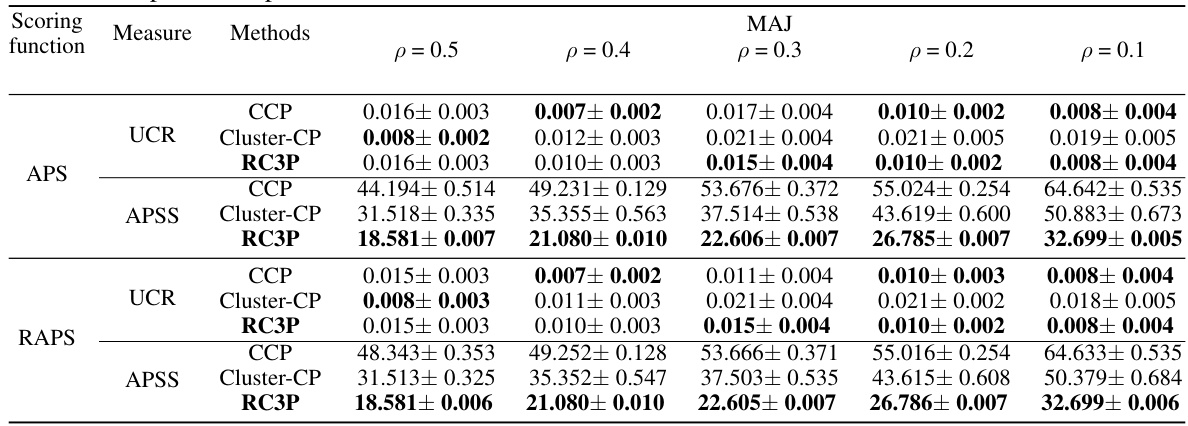
This table presents the average prediction set size (APSS) results for imbalanced classification experiments on four datasets using three different class-conditional conformal prediction methods: CCP, Cluster-CP, and RC3P. The table shows the impact of different imbalance ratios and types on the APSS for each method, highlighting the superior performance of RC3P. It demonstrates RC3P’s efficiency in significantly reducing prediction set size compared to existing methods while maintaining valid class-wise coverage.
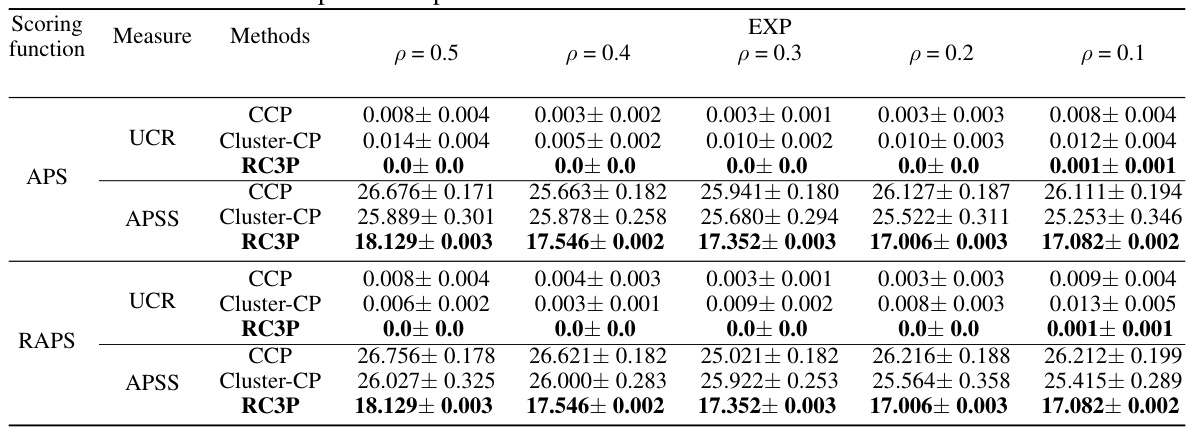
This table presents a comparison of the average prediction set sizes (APSS) achieved by three different class-conditional conformal prediction methods (CCP, Cluster-CP, and RC3P) on four imbalanced datasets (CIFAR-10, CIFAR-100, mini-ImageNet, Food-101). The results are broken down by imbalance type (EXP, POLY, MAJ) and imbalance ratio (p=0.1, p=0.5) and use a miscoverage rate (α) of 0.1. A key point is that RC3P consistently outperforms the other two methods in terms of achieving smaller prediction set sizes, while still maintaining the desired coverage guarantee. The under-coverage ratio (UCR) is controlled to ensure a fair comparison of the APSS.

This table presents a comparison of the average prediction set size (APSS) of three different conformal prediction methods (CCP, Cluster-CP, and RC3P) on four imbalanced datasets. The results are broken down by dataset, imbalance type, and imbalance ratio, illustrating the improvement in predictive efficiency achieved by RC3P.
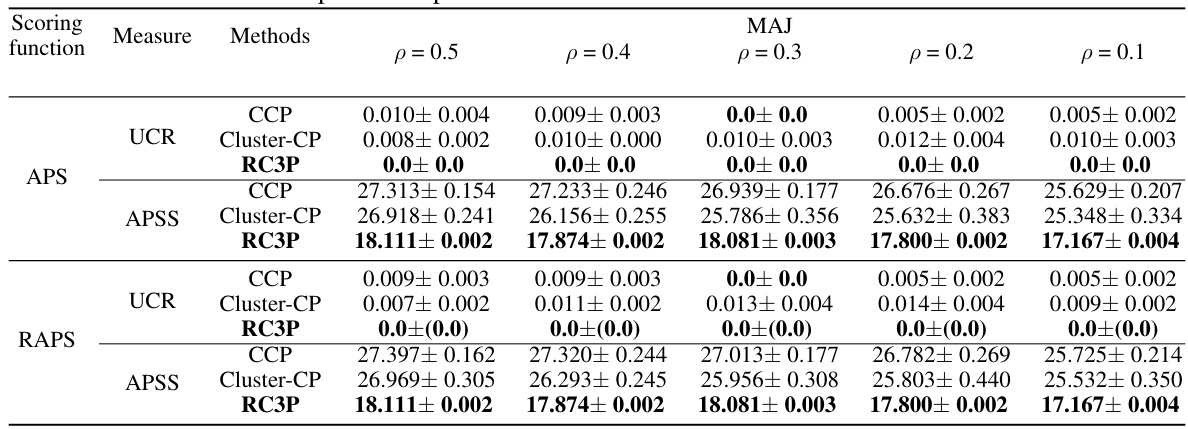
This table presents the average prediction set size (APSS) results for four different datasets (CIFAR-10, CIFAR-100, mini-ImageNet, Food-101) under various imbalance scenarios. Three different methods are compared: Class-Conditional Conformal Prediction (CCP), Cluster-CP, and the proposed Rank Calibrated Class-conditional CP (RC3P). The results demonstrate that RC3P consistently achieves smaller prediction set sizes than the baselines, showcasing its improved predictive efficiency while maintaining class-wise coverage.

This table presents a comparison of the average prediction set size (APSS) of three different conformal prediction methods (CCP, Cluster-CP, and RC3P) on four imbalanced datasets (CIFAR-10, CIFAR-100, mini-ImageNet, Food-101) with different imbalance ratios and types. The results demonstrate that RC3P significantly reduces prediction set size compared to the other methods while maintaining class-wise coverage.
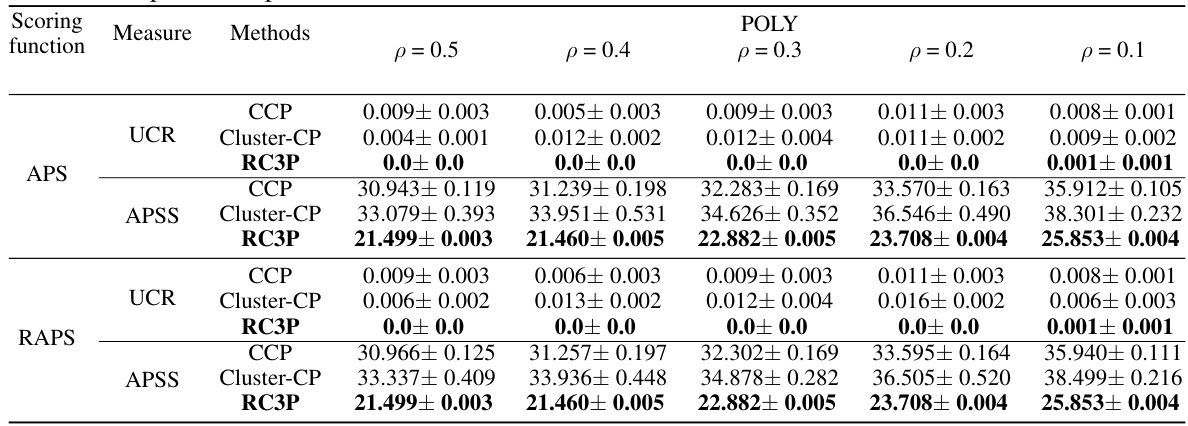
This table presents the average prediction set size (APSS) results for four imbalanced datasets (CIFAR-10, CIFAR-100, mini-ImageNet, Food-101) using three different imbalance types and ratios. It compares the performance of three methods: CCP, Cluster-CP, and the proposed RC3P. The results demonstrate that RC3P achieves significantly smaller prediction set sizes while maintaining class-wise coverage.
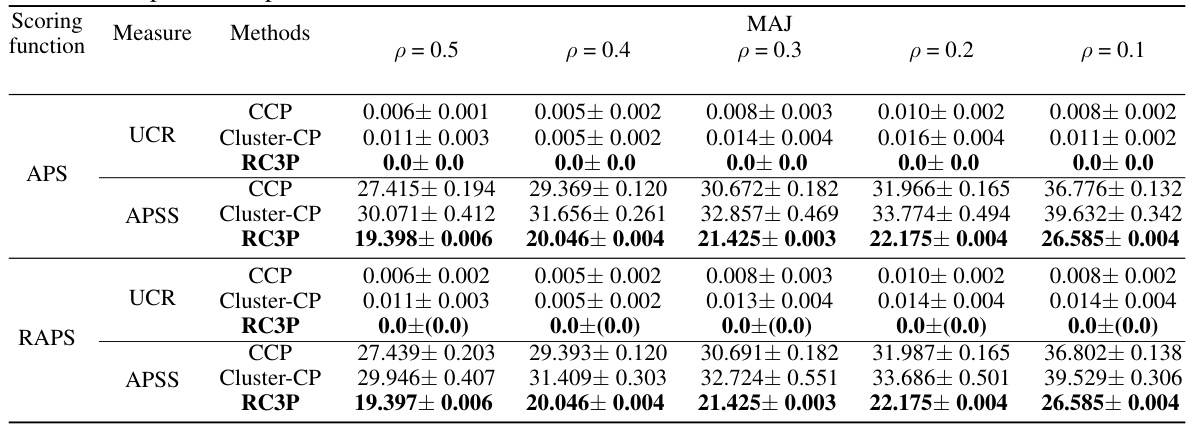
This table presents a comparison of the average prediction set size (APSS) achieved by three different conformal prediction methods (CCP, Cluster-CP, and RC3P) on four imbalanced datasets (CIFAR-10, CIFAR-100, mini-ImageNet, Food-101) with different imbalance ratios and types. The under coverage ratio (UCR) is controlled to be similar across methods for fair comparison. The results demonstrate that RC3P significantly reduces prediction set sizes compared to CCP and Cluster-CP, achieving a 24.47% reduction on average across all datasets and a 32.63% reduction when excluding CIFAR-10.
Full paper#


