↗ OpenReview ↗ NeurIPS Homepage ↗ Chat
TL;DR#
Deep learning models are vulnerable to adversarial attacks, hindering their use in safety-critical applications. Current methods to improve robustness fall into empirical and certified approaches. Empirical approaches, such as adversarial training, lack formal guarantees and are easily broken by unseen attacks. Certified approaches provide formal guarantees but suffer from limited achievable robustness. This work focuses on certified defenses, exploring their scalability using generated data. Prior work had already shown that using generated data from state-of-the-art diffusion models improve robustness of adversarial training.
This paper demonstrates that a similar approach can also considerably improve deterministic certified defenses. The authors achieve state-of-the-art deterministic certificates on CIFAR-10 by using data generated by an elucidating diffusion model. They highlight notable differences in the scaling behavior between certified and empirical methods, providing a list of recommendations to improve the robustness of certified training approaches. This includes considerations like regularization, training epochs, and the balance between real and generated data. Their results highlight the potential for substantial improvements in the field of certified adversarial robustness.
Key Takeaways#
Why does it matter?#
This paper is crucial for researchers in adversarial robustness. It presents state-of-the-art results in certified robustness, a critically important area for deploying machine learning models in safety-critical applications. The research also opens up exciting new avenues of research in scaling certified defenses by using generated data, directly impacting future robustness solutions.
Visual Insights#

This figure compares the certified and clean accuracy of several top-performing models on the CIFAR-10 dataset, as reported in a state-of-the-art survey on certified robustness. The models were evaluated under two different threat models (l∞ and l2). The key finding is that using data generated by an elucidating diffusion model (EDM) leads to a significant increase in both certified and clean accuracy across all models and threat models. Grey arrows are used to visually highlight this improvement due to data augmentation.

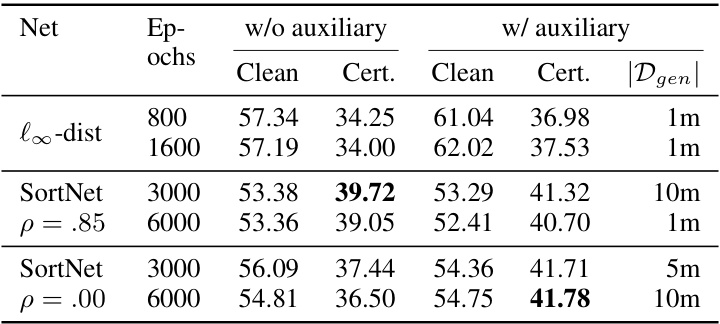
This table presents the clean and certified accuracy results on the CIFAR-10 dataset using the l∞ norm with an epsilon value of 8/255 for two different neural network architectures: l∞-dist Net and SortNet. The results are shown for both cases with and without the use of auxiliary data generated by an elucidating diffusion model (EDM). The table highlights the best performing models in each scenario and indicates the amount of generated data used to achieve the highest accuracy. The ‘p’ column represents the dropout rate used in the SortNet architecture.
In-depth insights#
Certified Robustness#
Certified robustness, a crucial aspect of machine learning security, focuses on providing formal guarantees about a model’s resistance to adversarial attacks. Unlike empirical methods like adversarial training, which only offer probabilistic assurances, certified methods provide mathematically verifiable bounds on the model’s robustness. This is achieved through techniques that mathematically prove a model’s accuracy remains above a certain threshold even when exposed to adversarial examples within a specified perturbation radius. The paper explores how generating additional training data using diffusion models significantly enhances certified robustness, achieving state-of-the-art results. A key insight is the difference in scaling behavior between certified and empirical approaches, with certified methods showing a saturation point in improvement with increasing data. The study also investigates the influence of various hyperparameters (epochs, model size, regularization) on certified robustness, providing valuable recommendations for optimizing certified training procedures. The trade-off between clean accuracy and certified robustness remains a critical challenge, highlighted by the fact that improvements in one may not always translate to improvements in the other.
Data Augmentation#
Data augmentation, in the context of this research paper, plays a crucial role in enhancing the robustness of certified adversarial defenses. The core idea involves supplementing the training data with synthetic samples generated by state-of-the-art diffusion models. This technique, proven effective for empirical methods, is shown to significantly improve the performance of certified defenses. The paper highlights a notable difference in the scaling behavior between empirical and certified methods, showing that certified robustness gains saturate with a relatively smaller amount of generated data than empirical approaches. This finding underscores the importance of analyzing and understanding the specific characteristics of each robustness technique when applying data augmentation strategies. The effectiveness of augmentation is demonstrably linked to the reduction of the generalization gap, improving both certified accuracy and clean accuracy. The paper meticulously explores various parameters, including the balance between real and generated data and training epochs, to optimize the augmentation process and achieve state-of-the-art results in certifying adversarial robustness.
Scaling Behavior#
The paper reveals interesting discrepancies in the scaling behavior of certified versus empirical adversarial robustness methods. Certified robustness, unlike empirical methods, shows diminishing returns with increasing amounts of generated data. While empirical methods benefit substantially from more data, certified methods plateau beyond a certain point, indicating a fundamental difference in how they leverage additional training examples. This highlights the importance of data efficiency in certified training, where carefully selected or generated data is paramount, unlike its empirical counterpart that seemingly benefits from a larger volume of data. The study also underscores the need for a deeper investigation into the scaling dynamics of different certified defenses. This is essential to identify the factors driving scalability differences and thus optimize robustness-enhancing strategies for certified approaches.
Empirical vs. Cert.#
The core of the ‘Empirical vs. Cert.’ comparison lies in contrasting the approaches to achieving and demonstrating robustness in machine learning models. Empirical methods, like adversarial training, focus on improving model performance against attacks through observation and experimentation. They lack formal guarantees; what works in one setting might fail in another. In contrast, certified methods provide mathematically provable robustness bounds. They offer stronger assurances but often come with limitations in terms of scalability and achievable robustness levels. The paper likely highlights the trade-offs between these approaches, suggesting that while empirical methods offer higher current robustness, certified methods provide greater reliability, and the integration of generated data benefits both. A key insight would be how advancements in data generation affect the scaling characteristics of each, potentially bridging the gap between their performance and reliability.
Future Directions#
Future research should explore scaling laws for both certified and empirical adversarial robustness, aiming to definitively characterize the relationship between data quantity, model capacity, and achieved robustness. Investigating the theoretical properties of certifiably robust models, perhaps drawing parallels to known graph properties, could yield valuable insights. Furthermore, it’s crucial to address the issue of over-robustness in certified methods, potentially by employing adaptive certification objectives that only target truly vulnerable samples. Finally, a thorough investigation into the applicability of data augmentation techniques to diverse certified robustness methodologies beyond Lipschitz-bound methods is warranted. This should include a comprehensive comparison across different approaches, exploring factors like computational cost and generalization performance.
More visual insights#
More on figures

The figure shows how the certified accuracy of four different models (l∞-dist Net, SortNet, LOT, and GloroNet) changes with the total number of training images used. The total number of images is the sum of original CIFAR-10 images and generated images from an elucidating diffusion model. The x-axis represents the total number of images (original + generated), while the y-axis represents the certified accuracy. The figure shows that the increase in certified accuracy plateaus after around 1 million generated images, indicating that adding more generated data provides diminishing returns.

This figure shows the correlation between generalization gap and certified accuracy improvement. Panel (a) demonstrates a positive correlation, showing that reducing the generalization gap (difference between training and testing accuracy) leads to greater improvements in certified accuracy. Panel (b) displays the generalization gap for different amounts of auxiliary data used during training across four different models. Panel (c) illustrates the effect of varying the ratio of generated to original data on both clean and certified accuracy for two models, revealing that a 70/30 ratio is optimal for achieving the best certified accuracy.

This figure shows the cumulative distribution of certification radii for the best models (SortNet without dropout and LOT-L) trained with and without auxiliary data generated by diffusion models. The x-axis represents the certification radius, and the y-axis represents the number of images. Separate curves are shown for correctly and incorrectly classified images. The figure illustrates that for the SortNet model, the use of auxiliary data leads to a wider distribution of certification radii, indicating improved robustness even for misclassified samples, despite a slight decrease in overall clean accuracy. For the LOT-L model, the difference between models trained with and without auxiliary data is less pronounced.

This figure visualizes the relationship between the amount of auxiliary data used in training, the number of epochs between the best and last epoch in terms of certified accuracy, and the difference in certified accuracy between those two epochs. The x-axis shows the number of epochs between the best and last epoch. The y-axis shows the difference in certified accuracy between the best and last epoch. Different colors represent different amounts of auxiliary data used (None, 1m, 5m, and 10m generated images). The figure aims to show the impact of auxiliary data on overfitting during certified training. It indicates that the difference between best and last epochs remains relatively small regardless of the amount of auxiliary data used, suggesting that overfitting is not a significant issue in the experimental setup.

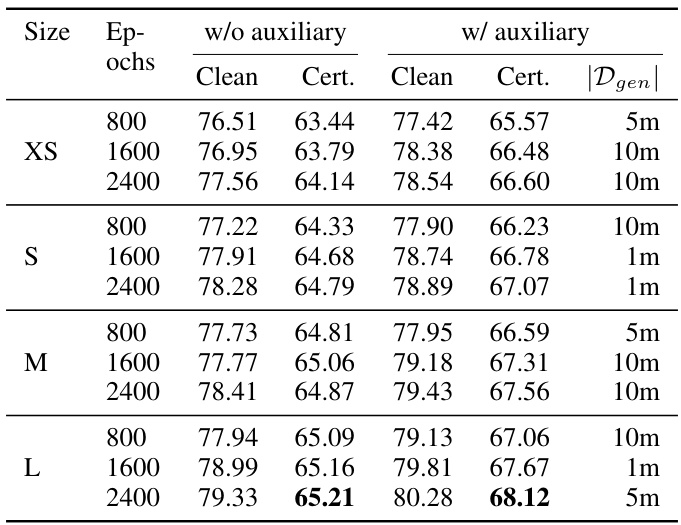
This figure shows the influence of model size and the number of training epochs on the certified accuracy improvement when using additional generated data. It presents a heatmap for two architectures, LOT and GloroNet, displaying the percentage point increase in certified accuracy achieved for different model sizes (XS, S, M, L) and numbers of epochs (x1, x2, x3, where x represents the original number of epochs for each model). The color intensity represents the magnitude of improvement, with darker shades indicating larger gains. The results highlight that increasing both model size and the number of training epochs leads to higher improvements in certified robustness when using auxiliary data.

This figure shows confusion matrices comparing the classification and certification results for models trained with and without auxiliary data. It illustrates how many images are correctly classified and certified, correctly classified but not certified, incorrectly classified but certified, and incorrectly classified and not certified for both the models trained with and without auxiliary data. The matrices are shown separately for the L-infinity norm (epsilon=8/255) and L2 norm (epsilon=36/255) threat models, which are used to assess the robustness of the models.
More on tables

This table presents the clean and certified test accuracy results for the LOT model on the CIFAR-10 dataset with the l2 norm and epsilon value of 36/255. It shows the performance with and without the use of auxiliary data generated by an elucidating diffusion model (EDM). The number of EDM-generated images used to achieve the highest accuracy is also indicated for each configuration.

This table presents the clean and certified test accuracy results for the LOT model on the CIFAR-10 dataset using the l2 norm with epsilon equal to 36/255. It shows the performance with and without the use of auxiliary data generated by an elucidating diffusion model (EDM). The table also indicates the number of EDM-generated images used to achieve the highest accuracy for each configuration. Bold formatting highlights the best model in each category (with and without auxiliary data).

This table presents the clean and certified test accuracy achieved on the CIFAR-100 dataset using four different neural network architectures (l∞-dist Net, SortNet, LOT-L, and GloroNet-L). The results are shown for both the l∞ and l2 threat models with perturbation levels of є = 8/255 and є = 36/255 respectively. The table compares performance with and without the addition of auxiliary data generated using diffusion models. The best overall model for each architecture is highlighted in bold.

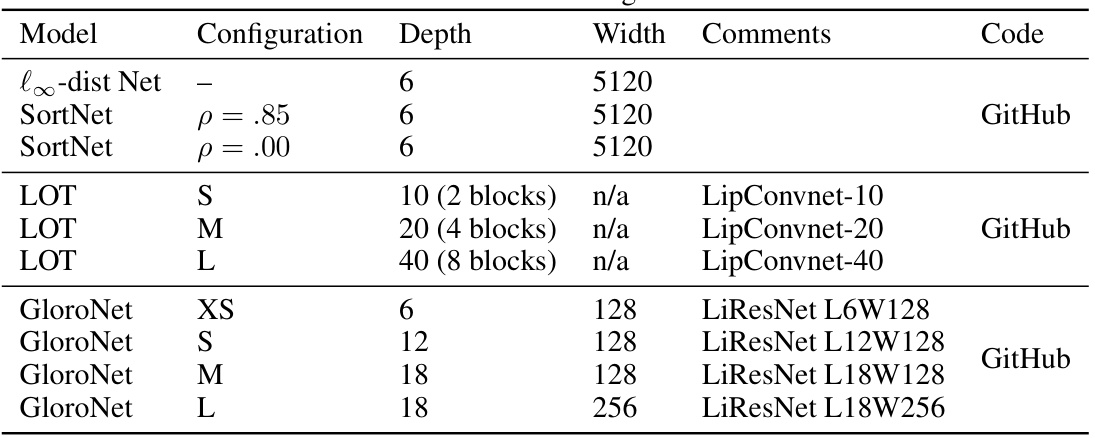
This table lists the different model configurations used in the experiments. It includes the model name, configuration details (depth, width, comments, and code availability). The configurations represent a variety of models with varying depths, widths and architectures from different papers. This allows the authors to compare how different models and configurations respond to their methodology of using generated data for improving certified robustness.

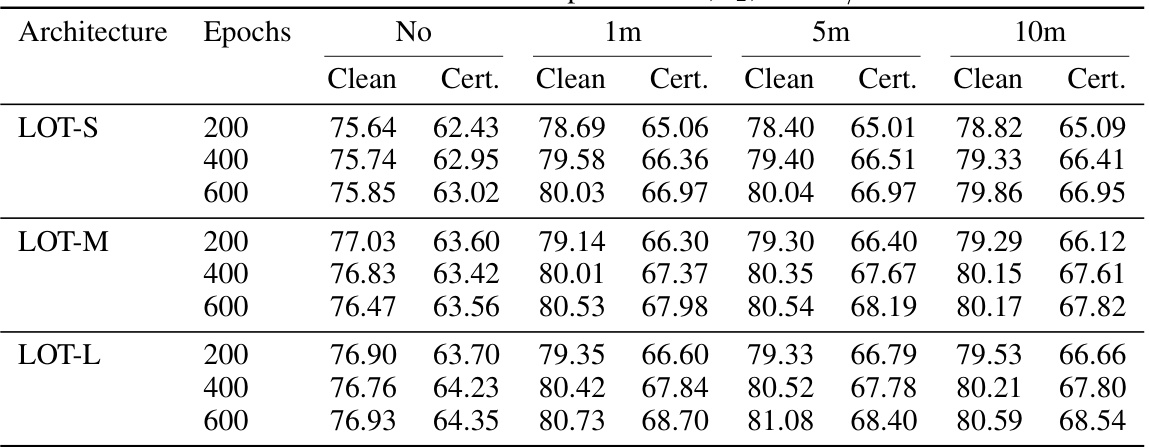
This table presents the results of the LOT model trained with a multi-step learning rate scheduler, comparing its performance to the cyclic learning rate scheduler. It shows the clean and certified test accuracy for different model sizes (S, M, L) and training epochs (200, 400, 600). The results are approximately 0.5% lower than with a cyclic learning rate.

This table shows the clean and certified test accuracy on CIFAR-10 for the l∞ threat model (epsilon=8/255) for two different architectures: l∞-dist Net and SortNet. The results are presented for different amounts of generated auxiliary data (1m, 5m, 10m images) and different numbers of training epochs (e). The best models with and without auxiliary data are highlighted, as well as the overall best-performing model. The column ‘ACert’ provides the absolute increase in certified accuracy achieved by using auxiliary data.

This table presents the clean and certified test accuracy results for two different neural network architectures (l∞-dist Net and SortNet) on the CIFAR-10 dataset under the l∞ threat model with epsilon = 8/255. It shows the performance with different amounts of generated auxiliary data (1m, 5m, and 10m images) and compares them to the models trained without any auxiliary data. The best performing models with and without auxiliary data are highlighted, along with the absolute increase in certified accuracy achieved using auxiliary data for each model. The number of training epochs used in each case is also specified.

This table presents the clean and certified test accuracy results on the CIFAR-100 dataset for four different neural network architectures. The results are shown for two different threat models (l∞ and l2) with varying amounts of generated auxiliary data (1m, 5m, and 10m images). The best performing model for each architecture is highlighted in bold.

This table presents the clean and certified test accuracy results on the CIFAR-10 dataset for two different neural network architectures: l∞-dist Net and SortNet. The models are evaluated under the l∞ threat model with epsilon equal to 8/255. The table shows the performance of each model both without any auxiliary data and with different amounts of auxiliary data generated using an elucidating diffusion model (EDM). The best performing models in each category (with and without auxiliary data) are highlighted in bold, and the amount of EDM generated images used for the best result is also included. The column ‘Dgen’ indicates the number of generated images used to obtain the highest accuracy for each model.
Full paper#


