TL;DR#
Deep reinforcement learning (RL) policies are complex and challenging to test thoroughly. Existing testing methods often struggle with scalability, making it difficult to ensure that policies meet safety and performance criteria across all possible situations. This is particularly crucial in safety-critical applications where even rare failures can have severe consequences. The lack of efficient verification methods poses a significant challenge to widespread adoption of RL in high-stakes domains.
This paper introduces a novel model-based testing approach called Importance-driven Model-Based Testing (IMT). IMT addresses the scalability problem by efficiently targeting the most critical states in the state space—states where the agent’s decisions have the greatest impact on safety and performance. This importance ranking is rigorously computed, allowing the method to focus its testing efforts on these key areas. By using probabilistic model checking, IMT provides formal verification guarantees about the policy’s behaviour, ensuring that certain safety properties are rigorously verified. The method has been shown to discover unsafe policy behavior with significantly reduced testing effort compared to existing methods, thus improving the reliability and safety of RL policies.
Key Takeaways#
Why does it matter?#
This paper is important for researchers because it presents a novel model-based testing framework that offers formal verification guarantees for deep reinforcement learning policies, efficiently focusing on crucial states impacting safety and performance. This rigorously addresses the scalability challenge in formal verification of RL policies, opening avenues for safer and more reliable AI systems in critical applications.
Visual Insights#

🔼 The figure shows a high-level overview of the importance-driven testing algorithm for reinforcement learning policies. It starts with an environment model (MDP), a safety specification, and the RL policy itself. The algorithm iteratively computes optimistic and pessimistic safety estimates, ranks states by importance, and restricts the MDP based on the policy’s decisions in the most important states. This process continues until a convergence criterion is met, resulting in a final classification of states as safe or unsafe.
read the caption
Figure 1: High-level view of the algorithm for importance-driven testing for RL.

🔼 This table presents the average time taken for policy synthesis using two different methods (IMT and MT) across various noise levels (η). The times are presented in seconds, with standard deviations shown in parentheses. IMT generally shows significantly faster synthesis times compared to MT.
read the caption
Table 1: Average synthesis times for the different policies.
In-depth insights#
Importance-Driven Testing#
Importance-driven testing, as discussed in the research paper, offers a powerful approach to address the challenges of testing complex systems such as those found in deep reinforcement learning. The core idea is to prioritize testing efforts on the most critical states within the system, those where the agent’s decisions have the most significant impact on safety or performance. This contrasts with traditional methods which often rely on random sampling or less strategic approaches. By focusing on high-impact states, resources are optimized, and potential failures are identified more efficiently. The paper’s proposed method utilizes model-based techniques to rigorously compute a ranking of state importance, enabling a focused and effective testing strategy. This ranking allows for optimal test-case selection, maximizing the information gained from each test. The approach is further strengthened by its ability to provide formal verification guarantees, ensuring that identified safety properties are formally proven to hold. This significantly increases confidence in the tested system. The use of clustering further enhances scalability, enabling the method to be applied to larger, more complex systems.
Model-Based Approach#
A model-based approach in the context of a research paper on deep reinforcement learning (RL) would likely involve using a formal model of the environment to analyze and test the learned policies. This contrasts with model-free approaches which directly interact with the environment. The core advantage is that model-based methods offer the potential for formal verification and rigorous analysis, allowing for stronger guarantees about the safety and performance of the RL agent than purely empirical evaluation. The model could be a Markov Decision Process (MDP) or a similar formalism capturing the state space, actions, transitions, and rewards. The testing process might involve analyzing the model’s properties, such as computing optimistic and pessimistic safety estimates over all possible policy executions. This is beneficial for establishing confidence that the policy functions correctly in all scenarios, not just the ones tested. A key challenge with model-based testing is scalability; creating and analyzing models for complex environments can be computationally expensive. However, methods like the one described in the paper aim to mitigate this by focusing testing efforts on the most critical states, enhancing efficiency without sacrificing the rigor of the model-based approach. The paper likely demonstrates the effectiveness of this method through experiments showcasing its ability to find safety violations with significantly less testing effort compared to traditional methods.
RL Policy Evaluation#
Reinforcement Learning (RL) policy evaluation is crucial for assessing the performance and safety of trained agents. Off-policy evaluation (OPE) methods are commonly used to estimate a policy’s performance using data from a different policy, offering efficiency but often facing bias issues. Model-based evaluation provides a more controlled setting, enabling the assessment of policies in specific scenarios and potentially offering stronger guarantees. Importance-driven testing, as presented in the paper, aims to optimize this evaluation, focusing testing efforts on the most critical states for performance or safety. This targeted approach aims to enhance efficiency and potentially reveal weaknesses that broader methods might miss. A key challenge in RL policy evaluation is the inherent complexity of RL policies, requiring robust evaluation methodologies capable of handling uncertainty and complexity. Formal verification techniques could add rigor, but their scalability often proves to be a bottleneck. Thus, finding the balance between comprehensive evaluation, rigor, and scalability remains an important area of future research.
IMT Algorithm Analysis#
An IMT algorithm analysis would delve into its computational complexity, focusing on the time and space efficiency of its core components such as the model-based state ranking, optimistic/pessimistic estimate computation, and the MDP restriction process. A key aspect would be evaluating its scalability with respect to state space size and the complexity of the underlying MDP. The analysis would assess the convergence properties, determining how quickly and reliably the algorithm achieves the desired level of accuracy in its safety/performance estimates. Furthermore, a rigorous investigation into the algorithm’s sensitivity to parameter settings (e.g., sampling rate, safety threshold) and its robustness against noise or uncertainty in the model would be essential. Finally, the analysis should explore potential improvements to enhance its efficiency and practical applicability, perhaps through advanced optimization techniques or innovative data structures. Trade-offs between accuracy and computational cost would be a central theme, seeking to identify optimal settings for specific applications.
Future Research#
The paper’s core contribution is a novel model-based testing framework for deep reinforcement learning (RL) policies, focusing on safety verification. Future research could significantly expand this work by addressing the limitations of the current approach. Specifically, extending the framework to handle stochastic policies, a common characteristic of real-world RL systems, is crucial. This would involve adapting the model restriction and verification processes to account for the inherent uncertainty introduced by stochasticity. Another important direction is to enhance scalability, potentially using advanced techniques like abstraction or approximate methods for larger state spaces. Exploring different ways to define and prioritize importance, beyond the current safety-centric ranking, could lead to a more general-purpose testing method applicable to diverse RL performance goals. Furthermore, integrating explainable AI (XAI) techniques to provide insights into the testing process and the policy’s behavior would enhance usability and trustworthiness. Finally, empirical evaluation on more diverse and complex RL tasks, beyond the illustrative examples provided, is necessary to fully assess the robustness and practical applicability of this promising approach.
More visual insights#
More on figures

🔼 This figure shows the Slippery Gridworld environment used in the experiments. The left panel displays the environment’s layout, including the agent’s starting position, the goal, and the hazardous lava areas. The middle panel visualizes the evaluation of policy π₁ using the IMT algorithm. Each sub-figure shows the highest-ranked states at each iteration, with the color intensity representing the importance ranking. This demonstrates how IMT iteratively focuses on states with the most critical decisions for safety. The right panel presents the results for policy π₂, showcasing how quickly IMT can verify this policy’s safety. In both the middle and right panels, the color-coding shows the states classified as safe (green), unsafe (red), and undetermined (blue).
read the caption
Figure 2: Slippery Gridworld example: setting (left), visualization of evaluating π₁ (middle), and π2 (right).

🔼 This figure shows the evaluation results for policy π1 in the Slippery Gridworld environment. It contains three subfigures: (a) Verified States: This plot shows the number of verified safe (green), unsafe (red), and undetermined (blue) states over the number of policy queries. The solid lines represent the results from the Importance-driven Model-based Testing (IMT) approach, while the dashed lines and shaded area show the results from the Model-based Testing (MT) approach (averaged over 10 runs with min/max values indicated). (b) Average safety estimates: This plot displays the average optimistic (green/solid) and pessimistic (red/solid) safety estimates from IMT, along with those from the MT approach (dashed lines). This illustrates how the estimates converge over the number of policy queries. (c) Results for random testing: This plot shows the cumulative number of failed tests encountered when using random testing. This provides a baseline comparison to the IMT and MT results.
read the caption
Figure 3: Slippery Gridworld example: Evaluation results of π1.

🔼 This figure presents the results of the UAV Reach-Avoid experiment. (a) shows the setting used in the experiment, which involves a drone navigating through a space with buildings. (b) illustrates the evaluation results in terms of the number of verified safe states over the number of policy queries, with separate lines representing the optimistic, pessimistic, and final estimates for both IMT and MT methods. The results show that IMT converges faster than MT, and that the estimates from IMT are tighter than those of MT. (c) shows the number of safety violations discovered for policies under different noise levels, highlighting that IMT efficiently detects unsafe behaviors.
read the caption
Figure 4: UAV Task: setting (4a), verified states (4b), and number of identified safety violations (4c).

🔼 This figure shows three parts. The leftmost part is the setting of the Slippery Gridworld environment, which shows the layout of the world with the agent (a triangle) starting at the bottom-left, a goal at the top-right, and lava in between. The middle part visualizes the evaluation of policy π₁ using the importance-driven model-based testing (IMT) method. The rightmost part visualizes the evaluation of policy π₂ using the same method. Each part shows how the IMT method iteratively identifies safe and unsafe regions of the state space, by highlighting states where decisions are crucial.
read the caption
Figure 2: Slippery Gridworld example: setting (left), visualization of evaluating π₁ (middle), and π2 (right).

🔼 This figure presents the evaluation results for the Atari Skiing policy testing using three different methods: IMTc (Importance-driven Model-Based Testing with Clustering), IMT (Importance-driven Model-Based Testing), and RT (Random Testing). The results are shown in three sub-figures. The leftmost subfigure shows the number of verified states over the number of executed tests using a logarithmic scale for the y-axis (number of states). The middle subfigure presents the number of tested safe and failed states, categorized by the average cluster size used in the IMTc method. The rightmost subfigure displays the number of implied safe and failed states, also categorized by average cluster size, showing how many states are inferred to be safe or unsafe based on the tested subset within each cluster.
read the caption
Figure 6: Atari Skiing Example: Evaluation results for the tested policy.

🔼 This figure shows the evaluation results for the UAV Reach-Avoid task under four different noise levels (0.25, 0.5, 0.75, and 1.0). Each subplot represents a different noise level and displays the number of states classified as safe (Ss), unsafe (Sf), and undetermined (Su) over the course of the testing process using two methods: IMT (Importance-driven Model-based Testing) and MT (Model-based Testing without importance ranking). The graphs show how the number of safe and unsafe states changes as more policy queries are made, illustrating the convergence of IMT and the effectiveness of the importance-driven approach in quickly identifying unsafe regions of the state space.
read the caption
Figure 7: Evaluation results for the UAV Reach-Avoid task under noise levels 0.25, 0.5, 0.75 and 1.0.

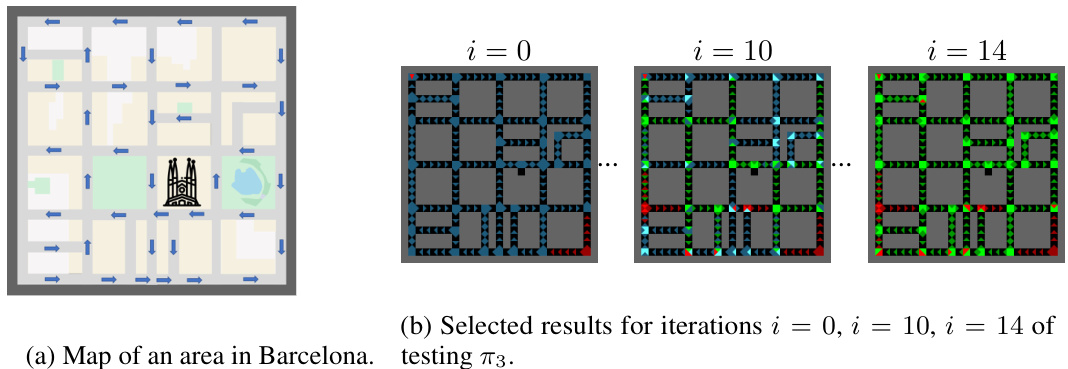
🔼 This figure shows a map of an area in Barcelona and the results of evaluating policy π3 using the Importance-driven Model-Based Testing (IMT) method. The left panel depicts a simplified map of streets, highlighting the one-way streets with arrows. The right panel displays visualizations at different iterations (i=0, i=10, i=14) of the IMT algorithm, showing the states categorized as safe (green), unsafe (red), and undetermined (blue). The intensity of the colors represents the states where the policy’s decisions were sampled, with brighter colors indicating higher importance based on the impact of decisions on the expected overall performance or safety.
read the caption
Figure 8: Urban navigation example: setting (left) and visualization of evaluating π3 (right).

🔼 This figure presents the evaluation results for policy π₁ in the Slippery Gridworld environment. It consists of three subfigures: (a) Verified States: Shows the number of verified safe states (green), unsafe states (red), and undetermined states (blue) over the number of policy queries. The solid lines represent the results from the Importance-driven Model-Based Testing (IMT) method, while the dashed lines show the results from the Model-Based Testing (MT) method (without importance ranking). The shaded area represents the variability of the MT results over multiple runs. (b) Average Safety Estimates: Shows the average optimistic (green) and pessimistic (red) safety estimates over all states as a function of policy queries. Again, solid lines are IMT results and dashed lines show the MT results. The shaded area depicts the variability for MT. (c) Results for Random Testing: Demonstrates the number of failed tests over the number of policy queries using a random testing (RT) approach, highlighting the efficiency of the IMT method in identifying unsafe states.
read the caption
Figure 3: Slippery Gridworld example: Evaluation results of π₁.

🔼 This figure shows three parts. The leftmost part is a visual representation of the Slippery Gridworld environment used in the experiment. The middle part visualizes the evaluation of policy π₁, showing how the algorithm iteratively identifies unsafe states. The rightmost part visualizes the evaluation of policy π₂, demonstrating a faster and complete verification.
read the caption
Figure 2: Slippery Gridworld example: setting (left), visualization of evaluating π₁ (middle), and π₂ (right).

🔼 This figure shows three subfigures related to a Slippery Gridworld example. The leftmost subfigure displays the setting of the environment. The middle subfigure visualizes the evaluation of policy π₁, showing how the algorithm iteratively identifies unsafe regions. The rightmost subfigure shows a similar visualization but for policy π₂.
read the caption
Figure 2: Slippery Gridworld example: setting (left), visualization of evaluating π₁ (middle), and π₂ (right).

🔼 This figure presents the evaluation results for policy π₁ in the Slippery Gridworld environment. It shows three subfigures: (a) Verified States: This plot shows the number of verified safe states (green), unsafe states (red), and undetermined states (blue) over the number of policy queries made by the IMT (Importance-driven Model-based Testing) algorithm and MT (Model-based Testing without importance ranking). The solid lines represent IMT while the dashed lines and shaded area represent MT (average and range of 10 runs). (b) Average safety estimates: This plot illustrates the average optimistic (green) and pessimistic (red) safety estimates for IMT and MT over all states. The estimates represent the probability of satisfying the safety objective (avoiding the lava). (c) Results for random testing: This plot displays the number of failed tests resulting from a random testing approach over the number of policy queries. This plot serves as a baseline comparison for IMT and MT.
read the caption
Figure 3: Slippery Gridworld example: Evaluation results of π₁.

🔼 This figure shows three parts. The leftmost part is a visual representation of the Slippery Gridworld environment used in the experiments. The middle part visualizes the evaluation of policy π₁, showing how the algorithm iteratively identifies unsafe states (red) and safe states (green), with the intensity of the color representing the importance ranking of the states. The rightmost part shows the evaluation of policy π₂, demonstrating its superior performance by requiring fewer iterations to identify safe and unsafe regions.
read the caption
Figure 2: Slippery Gridworld example: setting (left), visualization of evaluating π₁ (middle), and π₂ (right).

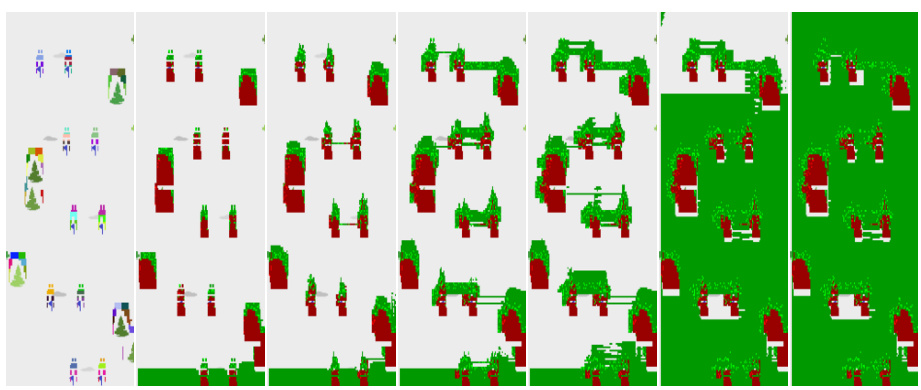
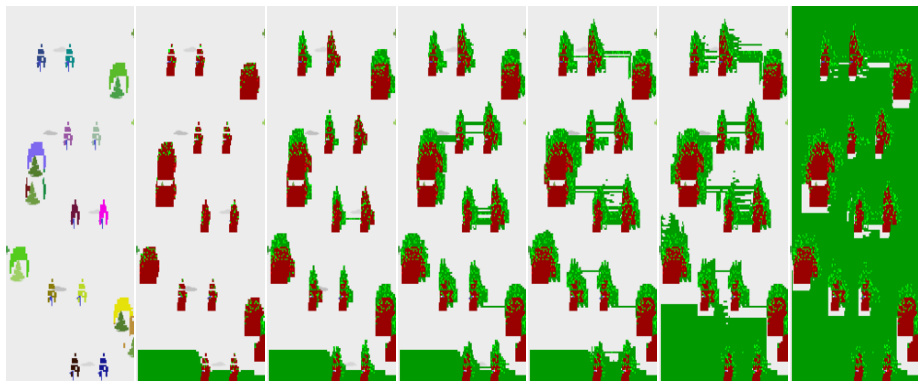
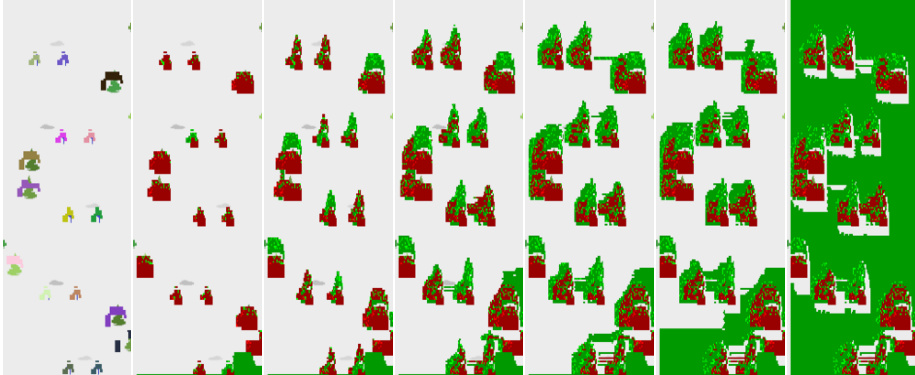
🔼 This figure visualizes the initial clustering and the iterations of the importance-driven model-based testing with clustering algorithm (IMT with clustering). The visualization shows how the algorithm progresses through several iterations, refining its understanding of the state space. Different colors represent states classified as safe (green), unsafe (red), and undetermined (blue). The intensity of the color indicates the importance rank of the state, showing the algorithm’s focus on critical areas of the state space. The average cluster size used in this visualization is 25. The figure provides a visual representation of how IMT with clustering efficiently partitions the state space and focuses testing on important states.
read the caption
Figure 5: The initial clustering and iterations of the algorithm for an average cluster size of 25.

🔼 This figure shows three parts. The leftmost part shows the setting of the Slippery Gridworld environment. The middle part visualizes the evaluation of the policy π₁ using the proposed Importance-driven Model-Based Testing (IMT) method. Brighter colors indicate states where the policy decisions were sampled, showing the focus on the states that matter most for safety. The rightmost part shows the evaluation of policy π₂ with a similar visualization.
read the caption
Figure 2: Slippery Gridworld example: setting (left), visualization of evaluating π₁ (middle), and π₂ (right).

🔼 This figure shows three parts of the Slippery Gridworld experiment. The leftmost part shows the setting of the environment, including the layout of the grid, the position of the goal, the lava, and the slippery tiles. The middle part visualizes the evaluation of policy π₁ using the proposed importance-driven testing method. The rightmost part visualizes the evaluation of policy π₂ using the same method. Each visualization shows the states in which the policy’s decisions were sampled, with the intensity of the color representing the importance ranking. The visualizations help to understand how the method discovers unsafe policy behavior.
read the caption
Figure 2: Slippery Gridworld example: setting (left), visualization of evaluating π₁ (middle), and π₂ (right).

🔼 The figure shows three subfigures. The leftmost subfigure displays the setting of the Slippery Gridworld environment. The middle subfigure visualizes the evaluation of policy π₁, showing how the algorithm iteratively identifies and ranks important states, eventually classifying them as safe (green), unsafe (red), or undetermined (blue). The rightmost subfigure shows the evaluation of policy π₂, indicating a more efficient verification process compared to π₁.
read the caption
Figure 2: Slippery Gridworld example: setting (left), visualization of evaluating π₁ (middle), and π₂ (right).

🔼 This figure visualizes the initial clustering and iterations of the Importance-driven Model-Based Testing with Clustering (IMT) algorithm for an average cluster size of 25 in the Atari Skiing environment. Each image represents a state in the game, with color-coding showing the classification of states as safe (green), unsafe (red), or undetermined (other colors). The progression of iterations demonstrates how IMT refines its understanding of safe and unsafe regions through iterative sampling and restriction of the model.
read the caption
Figure 5: The initial clustering and iterations of the algorithm for an average cluster size of 25.

🔼 This figure shows three parts. The left part shows the setting of the Slippery Gridworld environment. The middle part visualizes the evaluation of policy π₁ using the proposed Importance-driven Model-Based Testing (IMT) method. The right part visualizes the evaluation of policy π₂ using the IMT method. The visualization shows the states where decisions were sampled, categorized into safe, unsafe, and undetermined states, using different colors.
read the caption
Figure 2: Slippery Gridworld example: setting (left), visualization of evaluating π₁ (middle), and π2 (right).

🔼 This figure shows three parts. The leftmost part shows the setting of the Slippery Gridworld environment. The middle part visualizes the evaluation of policy π₁ using the IMT algorithm. The rightmost part shows the evaluation of policy π₂ using the IMT algorithm. Each visualization shows the states (as triangles) colored based on their importance ranking, with brighter colors indicating higher importance. The visualizations illustrate how IMT identifies important states for testing and updates its estimates of safe and unsafe regions iteratively.
read the caption
Figure 2: Slippery Gridworld example: setting (left), visualization of evaluating π₁ (middle), and π₂ (right).

🔼 This figure shows three subfigures related to a Slippery Gridworld example. The left subfigure displays the setting of the environment. The middle subfigure visualizes the evaluation of policy π₁, showing how the algorithm iteratively identifies unsafe regions. The right subfigure shows the evaluation of policy π₂, demonstrating a case where the policy is quickly verified as safe across the entire state space.
read the caption
Figure 2: Slippery Gridworld example: setting (left), visualization of evaluating π₁ (middle), and π₂ (right).

🔼 This figure shows three parts: the leftmost part shows the setting of the Slippery Gridworld environment. The middle part visualizes the evaluation process of policy π₁ by showing states that the algorithm sampled, and their importance rank using color intensity. The rightmost part shows the evaluation of policy π₂.
read the caption
Figure 2: Slippery Gridworld example: setting (left), visualization of evaluating π₁ (middle), and π₂ (right).
Full paper#


