↗ OpenReview ↗ NeurIPS Homepage ↗ Chat
TL;DR#
Deep Neural Networks (DNNs) have struggled to match the performance of Gradient Boosting Decision Trees (GBDTs) on tabular data. This is partly due to the difficulty of incorporating the inherent sparsity of tree-based models into the DNN architecture, which usually involves a dense selection of features. This research introduces a novel DNN architecture, namely DOFEN, which aims to improve performance by achieving on-off sparse selection of columns, a technique that helps mitigate overfitting and improve the diversity of features used in each ’tree’ within the ensemble.
DOFEN uses a two-step process to achieve this: first, it generates a large pool of differentiable ‘relaxed Oblivious Decision Trees’ (rODTs) that capture sparse column selections. Second, it uses a two-level ensemble strategy to aggregate the predictions from the rODTs and learn their weights. The two-level ensemble not only improves performance, but also improves the model’s robustness. Experiments on the Tabular Benchmark demonstrate that DOFEN surpasses other DNNs and approaches the performance of GBDTs, particularly on datasets with exclusively numerical features. The findings suggest that DOFEN’s unique architecture addresses a critical limitation of existing tabular DNNs and offers a potentially transformative approach to improve performance in this critical domain.
Key Takeaways#
Why does it matter?#
This paper is crucial for researchers working with tabular data, a common yet challenging data format in many domains. It directly addresses the persistent performance gap between Gradient Boosting Decision Trees (GBDTs) and deep learning models on tabular data. By introducing a novel and effective method for on-off sparse column selection, DOFEN offers a potentially transformative solution for improving the accuracy and efficiency of deep learning on this significant type of data. The proposed method inspires a new path for future research in combining the strengths of tree-based algorithms and DNNs for tabular data, potentially leading to superior predictive models across various applications.
Visual Insights#

This figure presents the evaluation results of various models on the Tabular Benchmark. The x-axis represents the number of random search iterations, and the y-axis represents the normalized test accuracy (for classification tasks) or R2 score (for regression tasks). Each line represents a different model, and their relative positions indicate their performance. The average performance across multiple datasets within each benchmark (medium-sized, large-sized, classification and regression) is shown.

This table shows the mean and standard deviation of DOFEN’s performance across 15 different random seeds, for four distinct datasets representing different classification and regression tasks. The purpose is to demonstrate the stability and consistency of DOFEN’s performance across multiple runs.
In-depth insights#
Tabular DNNs#
Deep neural networks (DNNs) have achieved remarkable success in various domains, yet their performance on tabular data lags behind traditional tree-based models like Gradient Boosting Decision Trees (GBDTs). Tabular DNNs, designed to address this limitation, represent a significant area of research. However, challenges remain. Many tabular DNNs, while showing promise, require significantly more computational resources than GBDTs. Furthermore, they often fail to effectively incorporate the inherent sparsity found in tree-based methods. Sparsity, which refers to the selection of only a subset of features in each tree, is a crucial aspect of tree-based methods’ performance and robustness, mitigating overfitting and improving generalization. Innovative architectures that effectively mimic this sparsity, without sacrificing differentiability critical for DNN training, are actively being investigated. Ultimately, the goal is to create tabular DNNs that achieve comparable accuracy to GBDTs while maintaining or improving efficiency. Novel approaches integrating tree-inspired components or utilizing attention mechanisms with sparsity-inducing techniques are crucial steps to bridge the performance gap and achieve this goal.
DOFEN Design#
The DOFEN design is a novel deep neural network architecture inspired by oblivious decision trees. Its core innovation lies in its ability to achieve on-off sparse column selection, a characteristic typically associated with tree-based models but largely absent in DNNs for tabular data. This sparsity is crucial for improving performance and mitigating overfitting. DOFEN cleverly addresses the non-differentiability of traditional ODTs by employing a two-step process. First, it generates a pool of differentiable relaxed ODTs (rODTs) by randomly selecting features and using a sigmoid subnetwork to produce soft conditions. Secondly, it uses a two-level ensemble: an importance weighting scheme applied to a subset of rODTs forming individual forests, followed by aggregation of these forests using a second level ensemble. This unique architecture combines the strengths of both tree-based methods and DNNs, resulting in a model that surpasses other DNNs on tabular data while achieving competitive results against GBDTs. The random selection process ensures diversity and helps avoid overfitting, although the authors acknowledge that this randomness impacts convergence speed, requiring more epochs to reach optimal performance.
Relaxed ODT#
The concept of “Relaxed ODT” presented in the paper is crucial for bridging the gap between the efficiency of oblivious decision trees (ODTs) and the differentiability required for deep learning integration. Traditional ODTs rely on non-differentiable operations, such as the Heaviside step function and entropy-based column selection, hindering their direct use in gradient-based optimization. The innovation lies in the relaxation of these constraints. The paper replaces the Heaviside function with a differentiable approximation using a neural network (sub-network Δ1), thereby introducing soft conditions instead of hard decisions. This allows for a smooth, differentiable transition between ODT nodes, crucial for effective backpropagation. Furthermore, the column selection process, instead of being a predefined, non-differentiable criterion, becomes a learnable parameter integrated within the neural network architecture, allowing the model to dynamically adjust column weights according to the data. This relaxation technique is essential for training an ODT-based deep learning model using standard backpropagation algorithms, enabling DOFEN to achieve state-of-the-art performance on tabular datasets. The key contribution is the seamless integration of the inherently non-differentiable nature of ODTs within a differentiable deep learning framework.
Two-Level Ensemble#
The two-level ensemble method is a crucial innovation in the DOFEN architecture, designed to address the challenge of effectively combining multiple relaxed oblivious decision trees (rODTs). A single large ensemble of rODTs risks overfitting, hence, DOFEN employs a two-stage approach. The first level involves randomly selecting a subset of rODTs and combining them into individual forests. This introduces diversity and prevents overfitting. The second level then combines these individual forests through another ensemble step, much like a standard ensemble method. This two-level strategy combines the advantages of both single forest methods and multiple forest ensembles; namely, the effectiveness of the individual forest in mitigating overfitting and the enhanced performance of the multi-forest ensemble. This hierarchical arrangement not only improves predictive performance but also enhances model stability and robustness, ultimately contributing to DOFEN’s superior performance on tabular datasets.
DOFEN Limits#
Analyzing potential limitations of a hypothetical “DOFEN Limits” section in a research paper, we might expect discussion on computational cost. DOFEN, being a deep learning model, likely demands significant computational resources for training and inference, especially when dealing with large datasets, a common issue in deep learning applications. Another potential limitation could be data dependency. The performance of DNNs is heavily influenced by the characteristics of the training data; if the test data differs significantly from the training data, DOFEN’s generalization ability could be compromised. Interpretability presents a persistent challenge for deep learning models. Although the paper might incorporate methods to enhance DOFEN’s interpretability, fully understanding its decision-making process can be difficult. Finally, a comprehensive “DOFEN Limits” section would likely explore potential scalability issues. While the architecture might work well for medium-sized datasets, scaling to extremely large datasets or high-dimensional data could pose significant challenges in terms of memory usage, training time, and overall performance.
More visual insights#
More on figures

This figure illustrates the three main modules of the DOFEN model: Condition Generation, Relaxed ODT Construction, and Forest Construction. The Condition Generation module uses sub-networks (Δ1i) to generate conditions for each column (xi) of the input data, resulting in a matrix M. The Relaxed ODT Construction module shuffles and reshapes this matrix M into a matrix O representing NrODT relaxed oblivious decision trees (rODTs), each with depth d. Finally, the Forest Construction module uses sub-networks (Δ2i) to calculate weights (wi) for each rODT, paired with embedding vectors (ei), which are then aggregated to form w and E respectively. This process creates differentiable counterparts to ODTs which are then combined into a final model.

This figure illustrates the two-level ensemble process in DOFEN. (a) shows how Nestimator pairs of weights (wi) and embedding vectors (ei) are randomly sampled from a larger pool to construct an rODT forest. These weights are then processed through a softmax function to obtain a weighted sum of the embeddings, resulting in a forest embedding (f). (b) shows how multiple rODT forests are created, each with its own embedding (f), and then combined via a shared sub-network (Δ3) to produce a final prediction. The final prediction is the average of the individual predictions from each forest, and the loss is the sum of the individual losses.

This figure illustrates the two-level ensemble process used in DOFEN. (a) shows how individual rODT forests are constructed by randomly sampling weights and embeddings and using a softmax function to obtain the final forest embedding. (b) shows how these forest embeddings are used to make predictions using a shared sub-network, and the final prediction is the average of all predictions.

This figure shows the performance of DOFEN and other baseline models on the Tabular Benchmark. The x-axis represents the number of random search iterations, while the y-axis shows the normalized test accuracy (for classification) or R2 score (for regression). The lines represent the different models, with their names ordered by performance after hyperparameter optimization. The results are averaged across multiple datasets within each benchmark category (medium classification, medium regression, large classification, large regression). The detailed number of datasets in each category can be found in Appendix B.1 of the paper.

This figure shows the average weights of true positives (TP) and true negatives (TN) for the top 25 rODTs, sorted by the standard deviation of their weights. Figure 5a demonstrates a clear separation between TP and TN weights, indicating that rODTs with high weight variation are more influential in classification. Figure 5b contrasts this, showing little difference in average weights between TP and TN for rODTs with low weight variation, meaning these are less impactful in the classification process.
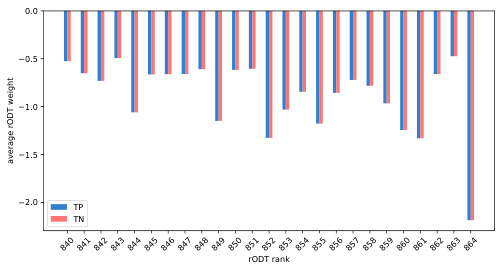
This figure visualizes the average weights of true positives (TP) and true negatives (TN) for relaxed oblivious decision trees (rODTs) in the covertype dataset. Figure 5a shows a significant difference in average weights between TP and TN for rODTs with large weight variations, indicating that these rODTs play a more crucial role in classification. In contrast, Figure 5b demonstrates that this difference is minimal for rODTs with small weight variations.

This figure illustrates the three main modules of the DOFEN model: Condition Generation, Relaxed ODT Construction, and Forest Construction. The Condition Generation module uses sub-networks (Δ1) to generate soft conditions for each column. These are aggregated into matrix M. The Relaxed ODT Construction module shuffles and reshapes M into matrix O, creating a pool of relaxed oblivious decision trees (rODTs). Finally, the Forest Construction module uses sub-networks (Δ2) and embedding vectors (ei) to compute weights for each rODT and combines them into a forest embedding.
This figure illustrates the three main modules of DOFEN model: Condition Generation, Relaxed ODT Construction, and Forest Construction. (a) shows how individual sub-networks process each column to generate multiple soft conditions, which are then aggregated into a matrix M. (b) demonstrates how the conditions in M are randomly shuffled and reshaped to create a pool of relaxed oblivious decision trees (rODTs). (c) details how a two-level ensemble process uses sub-networks to compute weights and embedding vectors for each rODT, which are used in subsequent layers to enhance predictive performance.

This figure illustrates the three main modules of the DOFEN model: Condition Generation, Relaxed ODT Construction, and Forest Construction. The Condition Generation module uses sub-networks (Δ1i) to generate soft conditions for each column (xi) in the input data. These conditions are aggregated into a matrix (M). The Relaxed ODT Construction module shuffles and reshapes the condition matrix (M) to create a pool of relaxed oblivious decision trees (rODTs), each with a depth (d). Finally, the Forest Construction module uses sub-networks (Δ2i) and embedding vectors (ei) to compute weights (wi) for each rODT. These weights and embeddings are combined into vectors (w and E) for the next stage of the DOFEN model.

This figure compares the training and testing performance of DOFEN with and without sampling in the forest ensemble. The left panel shows the results for classification tasks, while the right panel shows the results for regression tasks. Both panels show that when sampling is not used, the model overfits the training data, leading to a significant gap between training and testing performance. In contrast, when sampling is used, the training and testing performance are more closely aligned, indicating that the ensemble of forests helps to mitigate overfitting.

This figure shows the average weights of true positives (TP) and true negatives (TN) for relaxed oblivious decision trees (rODTs) in the covertype dataset. Figure 5a displays a significant difference in average weights between TP and TN rODTs with large weight variation, indicating that these rODTs are crucial for classification. Figure 5b, in contrast, shows little to no difference for rODTs with small weight variation, suggesting that these rODTs play a less crucial role in the classification process.

This figure visualizes the average weights assigned to relaxed oblivious decision trees (rODTs) in a binary classification task (covertype dataset). Two sub-figures are presented: (a) shows rODTs with large weight variation, where the average weights of true positives (TP) are distinctly different from those of true negatives (TN); (b) shows rODTs with small weight variation, where the difference in average weights between TP and TN is less pronounced. This highlights how the variability of rODT weights correlates with their importance in classification, where rODTs with higher weight variation play a more crucial role.

This figure shows the performance comparison of DOFEN and other state-of-the-art models on the Tabular Benchmark. The x-axis represents the number of iterations during the hyperparameter random search, and the y-axis represents the normalized test accuracy or R2 score. Each line represents a different model. The figure is divided into four subfigures, each representing a different combination of dataset size (medium or large) and task type (classification or regression). The results demonstrate that DOFEN achieves state-of-the-art performance on the Tabular Benchmark, particularly for medium-sized datasets.

This figure shows the performance comparison of DOFEN with other state-of-the-art models on the Tabular Benchmark. The models are sorted by their performance after hyperparameter tuning using a random search. The results are averaged across multiple datasets within each benchmark category (medium classification, medium regression, large classification, and large regression). The figure helps illustrate DOFEN’s competitive performance against established methods, especially Gradient Boosting Decision Trees (GBDTs), on tabular data.

The figure shows the performance of DOFEN and other models on the medium-sized datasets in the Tabular Benchmark. The models are grouped by their performance after hyperparameter tuning, with tree-based models generally performing best, followed by DOFEN and a group of other DNN models. The figure shows that DOFEN is highly competitive with the tree-based methods in numerical datasets, and also shows the struggle that DNNs have when compared to tree-based methods in heterogeneous datasets.

This figure presents the evaluation results of various machine learning models on the Tabular Benchmark. The models are ranked based on their average performance across multiple datasets within each benchmark category (medium classification, medium regression, large classification, and large regression). The graph visually compares the performance of DOFEN against other tree-based models (e.g., CatBoost, XGBoost, LightGBM) and various deep learning models (e.g., Trompt, SAINT, FT-Transformer). The detailed number of datasets used in each benchmark is available in Appendix B.1. This is a key result showing DOFEN’s state-of-the-art performance on tabular data.

This figure shows the performance comparison of DOFEN with other state-of-the-art models on the Tabular Benchmark. The benchmark includes 73 datasets covering a wide variety of domains and tasks (classification and regression). The models are ranked based on their average performance across the datasets after hyperparameter tuning using random search. DOFEN achieves state-of-the-art results, outperforming other deep neural networks (DNNs) and competitive with gradient boosting decision tree (GBDT) models.

This figure presents the results of the model evaluation on the Tabular Benchmark. The models are compared based on their performance after a random hyperparameter search. The results are presented as average performance across multiple datasets within each benchmark category (medium classification, medium regression, large classification, large regression). Each plot displays the normalized test accuracy (or R-squared for regression) as a function of the number of random search iterations. The model names on the x-axis are sorted according to their performance at the end of the random search process, providing a clear visualization of the ranking.

This figure shows the performance comparison of different models on the Tabular Benchmark. The models are grouped by their performance, with the best performing models listed first. The results are averaged across multiple datasets within each benchmark category (medium classification, medium regression, large classification, large regression). Appendix B.1 provides the exact number of datasets in each category.

The figure shows the performance of various machine learning models on the Tabular Benchmark dataset. The models include tree-based models (Random Forest, Extra Trees, Gradient Boosting Decision Trees like XGBoost, LightGBM, and CatBoost) and deep neural network models (Deep Forest, NODE, TabNet, SAINT, FT-Transformer, Trompt, MLP, ResNet). The models are compared across four sub-benchmarks: medium and large datasets for both classification and regression tasks. The y-axis represents the normalized test accuracy (for classification) and R-squared score (for regression). The x-axis shows the number of random search iterations for hyperparameter tuning. The figure demonstrates that DOFEN outperforms other DNNs and is comparable to GBDTs.

The figure shows the performance of various models (DOFEN, XGBoost, Catboost, etc.) on the Tabular Benchmark dataset. The models are sorted by performance after hyperparameter tuning. The results are averaged across multiple datasets within each benchmark (medium classification, medium regression, large classification, large regression). Appendix B.1 provides details on the number of datasets in each benchmark category.
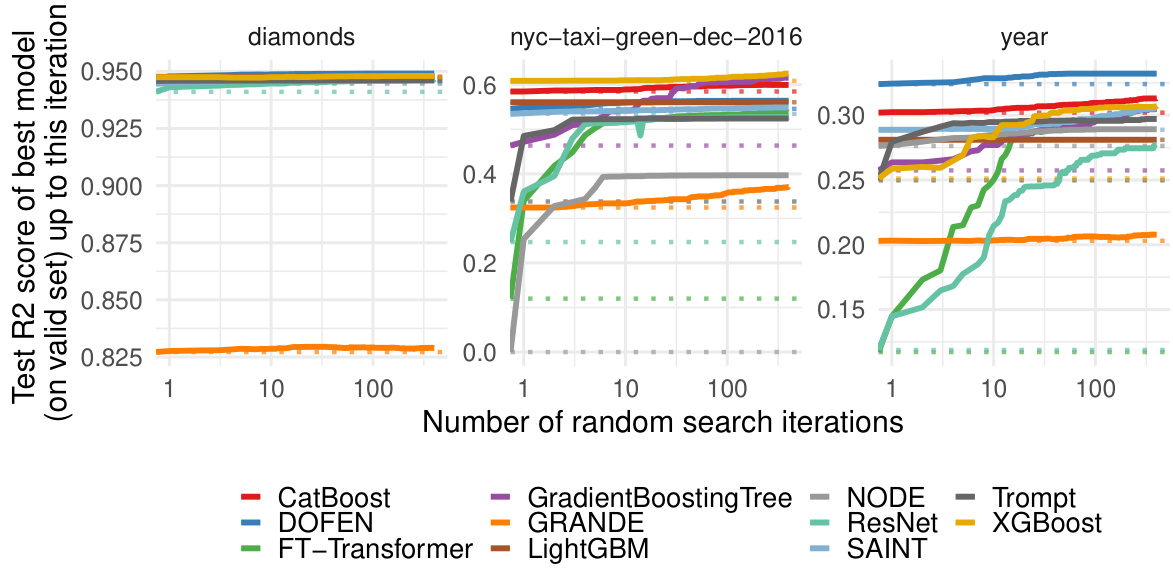
The figure displays the performance of various models on the Tabular Benchmark dataset. The models are ranked by their performance after hyperparameter tuning via random search. The results presented are averages across multiple datasets within each benchmark (medium-sized, large-sized, and categorized by task type). Appendix B.1 provides a detailed breakdown of the number of datasets in each benchmark category.
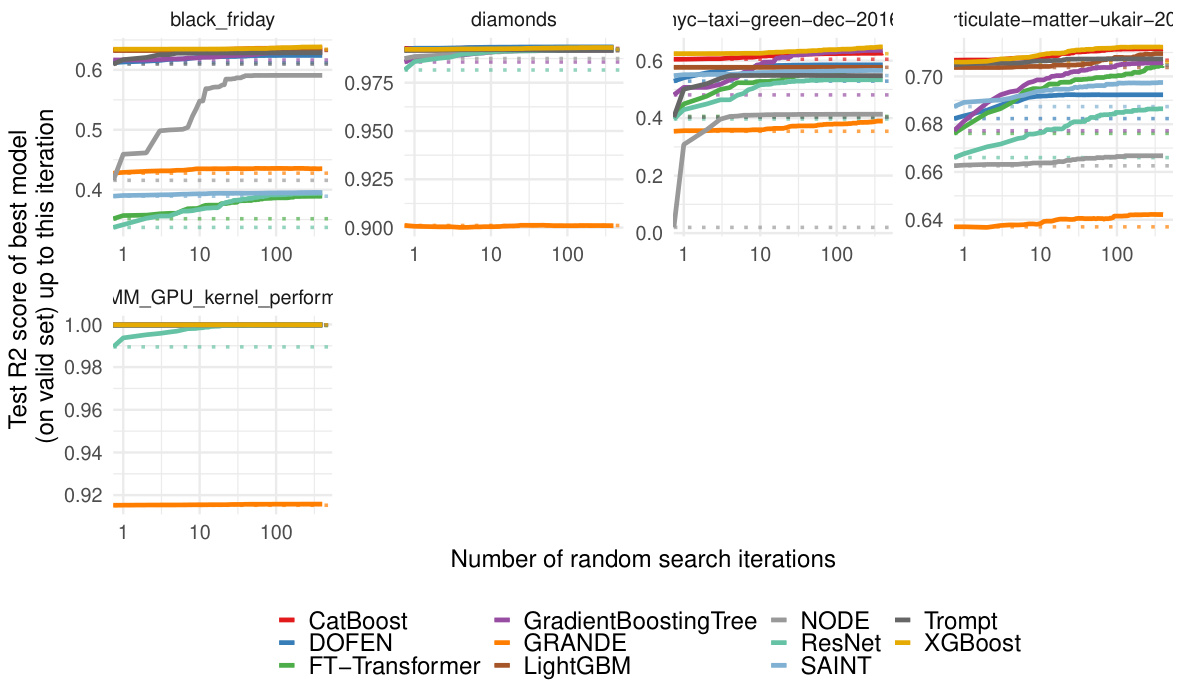
This figure presents the performance comparison of various models on the Tabular Benchmark across four different tasks: medium-sized classification, medium-sized regression, large-sized classification, and large-sized regression. Each plot shows the normalized test accuracy or R-squared score achieved by each model as a function of the number of random search iterations. This provides an overview of the relative performance of different models on diverse tabular datasets, showcasing DOFEN’s strong performance across the board.
More on tables
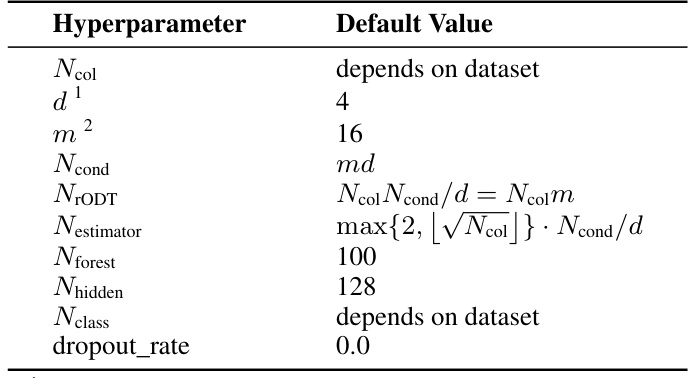
This table lists the number of columns (Ncol), the number of relaxed oblivious decision trees (NrODT), and the number of estimators (Nestimator) used in the DOFEN model for each dataset in the Tabular Benchmark. The Nestimator value is calculated using a formula based on Ncol and NrODT. This table provides a detailed breakdown of the model’s configuration for each dataset.

This table shows the calculated Nestimator for each dataset using the default hyperparameters from the paper. It also lists the number of columns (Ncol) and the number of relaxed oblivious decision trees (NrODT) for each dataset. Nestimator is a hyperparameter in DOFEN that controls the number of tree instances sampled in each iteration of the forest construction process.

This table shows the number of estimators (Nestimator), number of columns (Ncol), and number of relaxed oblivious decision trees (NrODT) for each dataset used in the experiments. The Nestimator value is calculated using a formula involving Ncol and NrODT. This information is crucial for understanding the configuration of the DOFEN model for each dataset.

This table lists the OpenML Task IDs and corresponding dataset names for classification tasks that use only numerical features. The OpenML ID is a unique identifier used to access datasets from the OpenML platform. The dataset names are provided for clarity and context.

This table lists the OpenML Task IDs and their corresponding dataset names for classification tasks where the datasets contain both numerical and categorical features. It provides a cross-reference for accessing the datasets using the OpenML IDs.

This table shows the number of estimators (Nestimator), the number of columns (Ncol), and the number of relaxed oblivious decision trees (NrODT) for each dataset used in the experiments. These values are calculated based on formulas and hyperparameters specified in the paper. The OpenML ID is also provided to identify each dataset.

This table shows the calculated Nestimator value for each dataset from the Tabular Benchmark. Nestimator is a hyperparameter of the DOFEN model, related to the number of relaxed oblivious decision trees (rODTs) in the forest. The table also provides the number of columns (Ncol) in each dataset and the number of rODTs (NrODT) generated.

This table presents a comparison of the computational efficiency of various models (DOFEN, Trompt, FT-Transformer, NODE, XGBoost, LightGBM, and CatBoost) on medium-sized classification datasets using default hyperparameters. The metrics compared include performance (accuracy), floating point operations (FLOPs), the number of parameters, and inference time. Note that FLOPs and parameter counts are only applicable to the DNN-based models (DOFEN, Trompt, FT-Transformer, and NODE), while the other models (XGBoost, LightGBM, and CatBoost) use tree-based algorithms with different computational characteristics. The table provides a useful comparison of how various models balance accuracy with computational resource requirements.

This table presents a comparison of different machine learning models’ performance, computational efficiency (FLOPs), and parameter sizes on medium-sized classification datasets. The optimal hyperparameters for each model were used to obtain the results, resulting in the highest accuracy achieved by each model. The table shows that DOFEN achieves a good balance between performance and efficiency, significantly outperforming others in terms of FLOPs while maintaining competitive accuracy.

This table presents a computational efficiency analysis for various models on medium-sized classification datasets using default hyperparameters. It compares the performance (accuracy), floating point operations (FLOPs), number of parameters (in millions), and inference time (in seconds) for different models, including DOFEN, Trompt, FT-Transformer, NODE, XGBoost, LightGBM, and CatBoost. The results highlight the trade-offs between model complexity, performance, and efficiency.

This table presents a comparison of the computational efficiency of various models on medium-sized regression datasets, focusing on FLOPs (floating point operations), the number of parameters, and inference time. The models compared include DOFEN, Trompt, FT-Transformer, NODE, XGBoost, LightGBM, and CatBoost. The results highlight the computational efficiency of DOFEN, particularly with respect to FLOPs and inference time, while also noting the trade-off between model size, computation, and performance.

This table shows the proportion of inference time spent on each module of the DOFEN model across 59 medium-sized datasets. The modules are Condition Generation, Relaxed ODT Construction, Forest Construction, and Forest Ensemble. The mean and standard deviation of the proportions are given for each module. The table shows that the Forest Construction module takes up the most inference time (87.39%), highlighting it as an area for potential optimization.

This table presents a breakdown of the average inference time proportions for each module within the DOFEN model across 59 medium-sized datasets. It shows that the Forest Construction module takes up the majority (87.39%) of the inference time, with the sub-modules within Forest Construction taking up most of the time.

This table compares the training time of various models, including DOFEN, Trompt, FT-Transformer, and NODE. Two training times are presented for each model: one using default hyperparameters and one using optimal hyperparameters. The results show the time taken to train each model on 50 medium-sized datasets, demonstrating the relative training efficiency of each.

This table presents the results of an experiment analyzing the impact of varying the hyperparameter ’m’ on the performance and efficiency of the DOFEN model. The experiment was conducted on medium-sized datasets from the Tabular Benchmark and reports performance (Accuracy for classification and R2 score for regression), model parameters (in millions), and floating point operations (FLOPS, in millions) for different values of ’m’ (4, 8, 16, 32, and 64). The default value of ’m’ is 16.

This table shows the results of experiments conducted to analyze the scalability of DOFEN by varying the hyperparameter ’m’. The hyperparameter ’m’ influences the number of conditions (Ncond), the total number of relaxed oblivious decision trees (rODTs; NrODT), and the number of rODTs within each rODT forest (Nestimator). The table presents the performance (accuracy for classification and R2 score for regression), the number of parameters (in millions), and the number of floating point operations (FLOPs; in millions) for different values of ’m’, including the default value of 16. The results indicate how the model’s performance, parameter count, and computational cost change as ’m’ is increased, providing insights into DOFEN’s scalability.

This table presents the results of experiments conducted to analyze the impact of varying the depth (d) of the relaxed oblivious decision trees (rODTs) within the DOFEN model on medium-sized datasets. The table shows the performance (accuracy for classification and R2 score for regression), the number of parameters (in millions), and the number of floating point operations (FLOPS, in millions) for different depths (d = 2, 3, 4, 6, 8). Depth 4 is the default setting used in the paper. The results help to understand the trade-off between model complexity and performance at different depths.

This table presents the results of experiments conducted to analyze the impact of varying the depth (d) of relaxed oblivious decision trees (rODTs) within the DOFEN model on medium-sized datasets. The table displays the performance (accuracy for classification and R2 score for regression), the number of parameters (in millions), and the number of floating-point operations (FLOPs, in millions) for different values of d, ranging from 2 to 8. The default setting of d=4 is highlighted.

This table shows the performance (accuracy for classification and R2 score for regression) and efficiency (parameters and FLOPs) of the DOFEN model on medium-sized datasets with different settings of the hyperparameter ’m’. The hyperparameter ’m’ influences the number of conditions (Ncond) and the number of rODTs in a forest (Nestimator). The table helps to assess the effect of ’m’ on model performance and computational cost.

This table presents the results of experiments conducted to evaluate the impact of varying the number of layers in the neural networks (Δ1, Δ2, and Δ3) of the DOFEN model on large-sized datasets. It shows how changes in the number of layers affect the model’s performance (accuracy for classification, R2 score for regression), the number of parameters, and the number of floating point operations (FLOPs). The results are presented for three different configurations: the default setting (one layer each), twice the default (two layers each), and three times the default (three layers each).

This table compares the top three most important features identified by DOFEN and other tree-based models (Random Forest, XGBoost, LightGBM, CatBoost, GradientBoosting Tree, and Trompt) on the mushroom dataset. The feature importance is represented as a percentage, indicating the relative contribution of each feature to the model’s prediction. The results show a high degree of agreement between DOFEN and the other models, suggesting that DOFEN is able to capture similar information as other tree-based models.

This table presents the top three most important features identified by DOFEN, compared with other tree-based models and Trompt, on the red wine dataset. The features are ranked by importance percentage, providing insights into the model’s interpretability and alignment with other methods.

This table presents the top three most important features identified by the DOFEN model, along with those identified by other tree-based models (Random Forest, XGBoost, LightGBM, CatBoost, GradientBoosting Tree) and a deep learning model (Trompt) for the white wine quality dataset. The results show a high degree of agreement between DOFEN and the other models, indicating that DOFEN is able to identify key features while maintaining interpretability despite its deep learning architecture.

This table compares the performance of DOFEN with and without using sampling in the forest ensemble. It shows the average accuracy for classification tasks and the average R-squared score for regression tasks, broken down by dataset type (numerical only and heterogeneous). The results demonstrate a significant improvement in DOFEN’s performance when using the sampling technique (the default setting).

This table presents the results of an experiment comparing the performance of the DOFEN model with and without an additional layer of bagging ensemble (seed ensemble). The experiment was conducted on medium-sized tabular datasets with varying number of forests (Nforest = 10, 20, 50, 100, 300). The results show the performance in classification and regression tasks, illustrating how the seed ensemble impacts the model’s accuracy and R-squared score.

This table compares the performance of three different column selection strategies for constructing rODTs within the DOFEN model. The first strategy is the default ‘Shuffle’ approach, while the second and third strategies use a CatBoost model to initialize the column selection (‘Catboost-Init’ and ‘CatBoost*’). The table shows that the CatBoost-Init approach achieves comparable performance to a fully trained CatBoost model and outperforms the shuffle approach. This suggests that more sophisticated methods for column selection can lead to better results, but end-to-end differentiability is prioritized in the paper.

This table compares the performance of the Two-level Relaxed ODT Ensemble module in DOFEN using two different weight selection methods: random sampling (default) and sliding window selection. The results show the average performance across various datasets for classification and regression tasks. It highlights the relative effectiveness of the two approaches in achieving good predictive performance.

This table shows the performance of DOFEN model with different pruning ratios of rODTs. The weights are sorted by their standard deviations, and the pruning is applied from the lower end. The results show that a small degree of pruning can improve the performance, especially for classification tasks. The optimal pruning ratios are 0.02 for classification and 0.1 for regression. The
by datasetapproach tailors the pruning ratio for each dataset and shows a better performance.

This table presents the results of an experiment that explores the impact of pruning relaxed oblivious decision trees (rODTs) in the DOFEN model. Specifically, it shows the performance (classification accuracy and regression R-squared) achieved at different pruning ratios. The pruning ratios indicate the proportion of rODTs with the lowest standard deviation of weights that are removed. The results demonstrate that modest pruning can even improve performance.

This table shows the results of experiments on pruning rODTs with varying ratios. The pruning is based on the standard deviations of the weights for each rODT. The table shows that pruning a small portion of rODTs (with lower standard deviation weights) doesn’t hurt the performance and may even improve it slightly. However, when pruning rODTs with higher standard deviation weights, the performance decreases as the pruning ratio increases.

This table presents the results of an experiment where the weights (wi) of Relaxed Oblivious Decision Trees (rODTs) with lower standard deviations are pruned. The experiment is conducted to investigate the impact of pruning on the model’s performance. The table shows the performance of the model (classification and regression) under different pruning ratios. The results suggest that pruning these rODTs does not negatively affect the performance and, in some cases, enhance the performance.

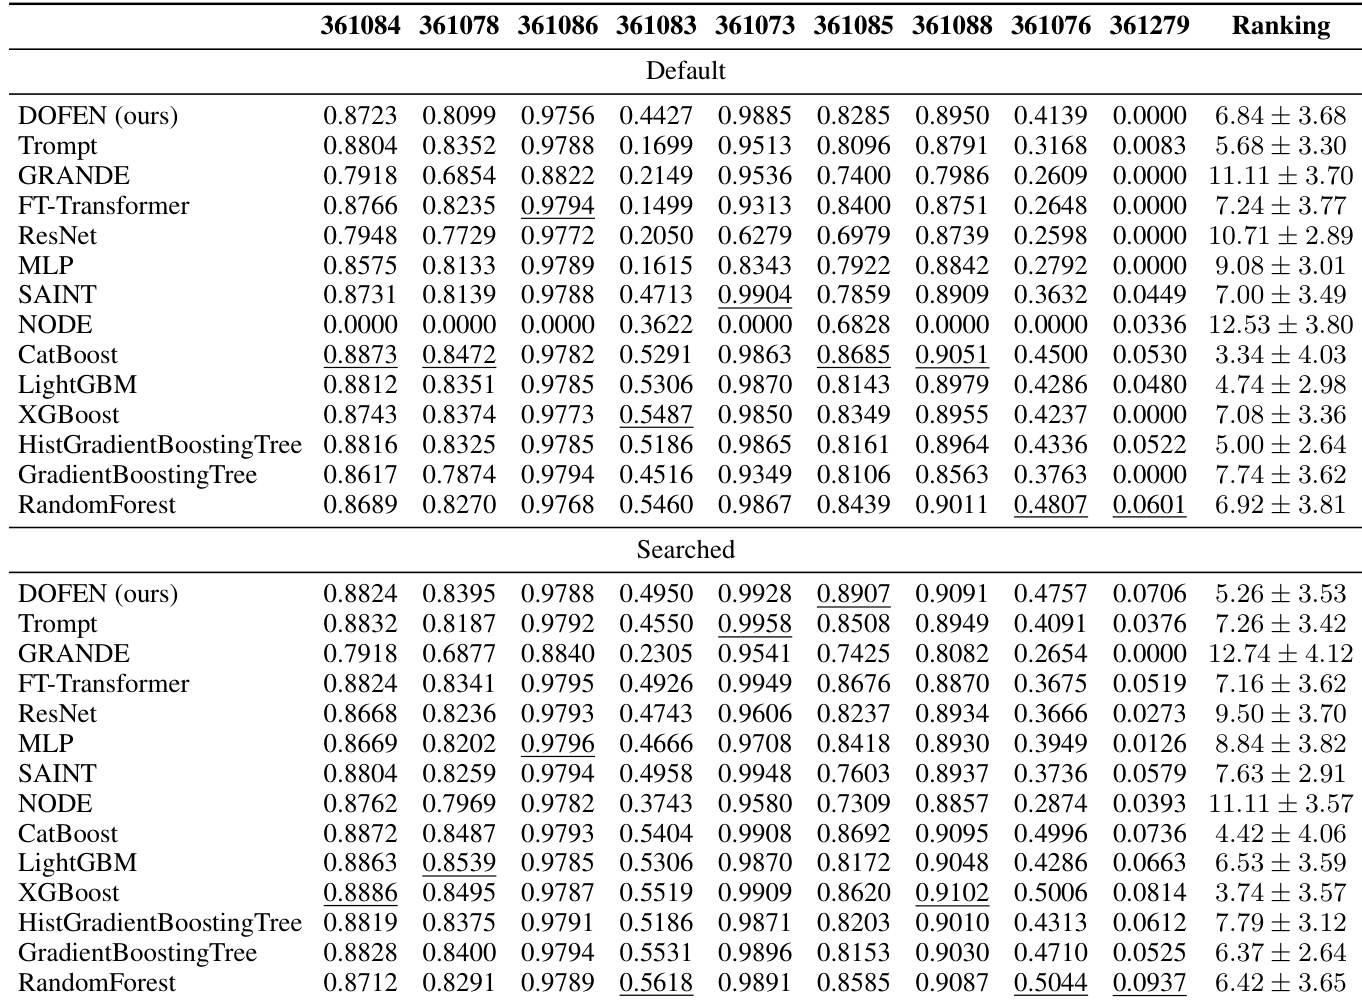
This table presents the performance of different models on the medium-sized classification datasets with only numerical features. It shows the accuracy achieved by each model on 10 different datasets, providing a detailed comparison of DOFEN against several tree-based models (CatBoost, LightGBM, XGBoost, HistGradientBoosting Tree, GradientBoosting Tree, Random Forest) and other DNN models (Trompt, GRANDE, FT-Transformer, ResNet, MLP, SAINT, NODE). The table includes both default and searched hyperparameter results for each model.
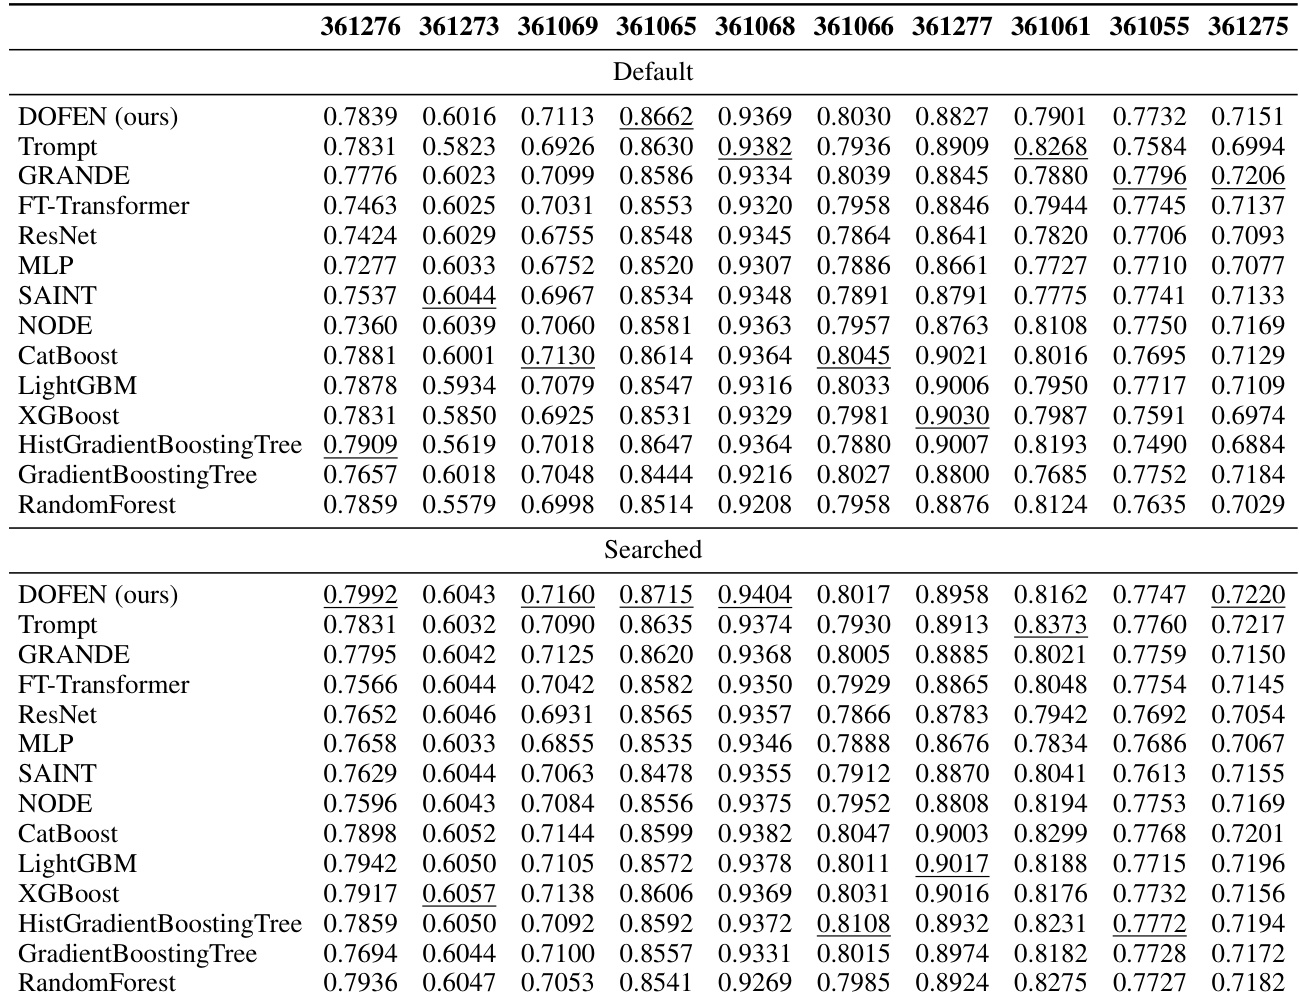
This table presents the detailed performance of various models on a subset of medium-sized classification datasets from the Tabular Benchmark, focusing only on datasets with exclusively numerical features. The table shows the performance metrics (likely accuracy) for each model on 10 different datasets, allowing for a granular comparison of model effectiveness across diverse datasets. The table includes both default and searched hyperparameters, providing insights into the impact of hyperparameter tuning on model performance.
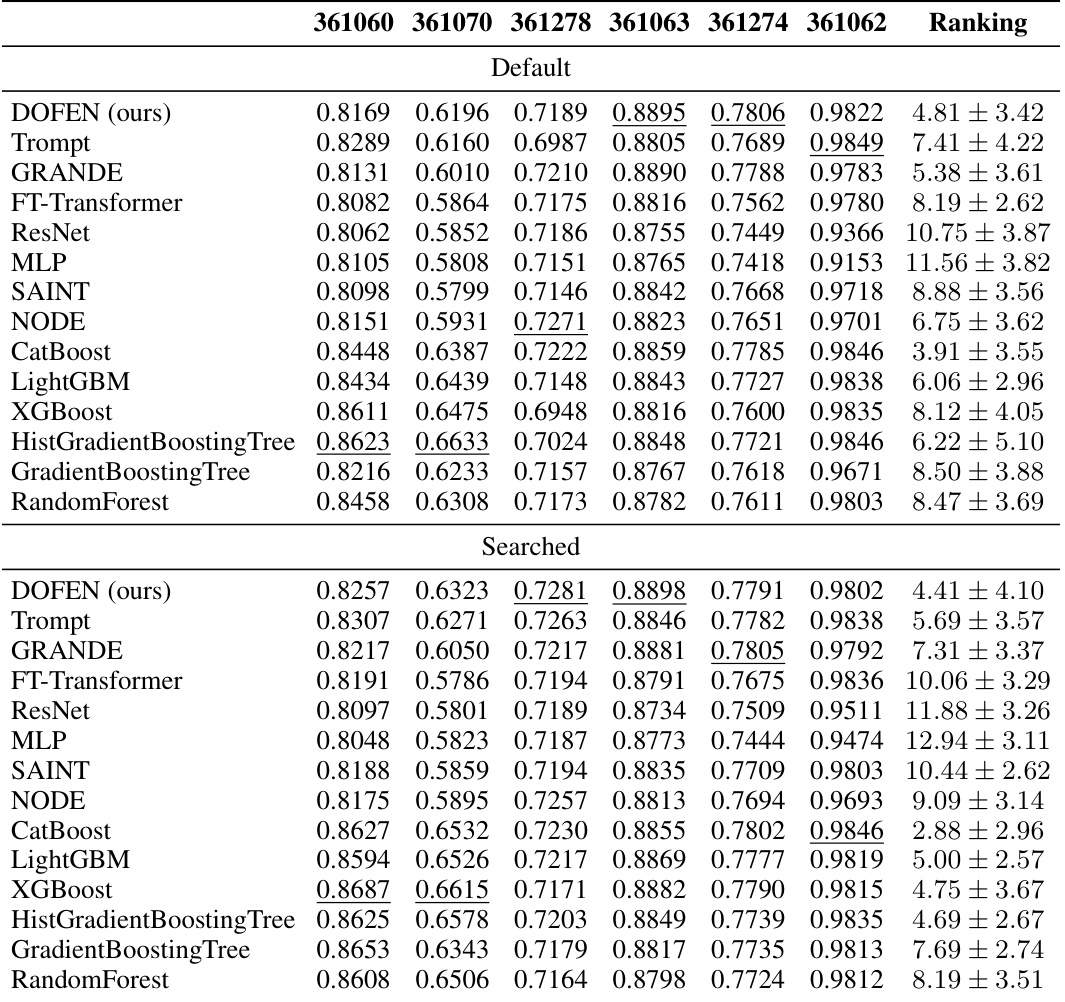
This table presents the performance of various models on medium-sized classification datasets with only numerical features. The performance is evaluated using accuracy and reported for each model on multiple datasets. The table shows both default hyperparameter settings and results from a hyperparameter search. The ranking of the models is also provided based on the average rank across datasets.

This table presents the performance of various models on medium-sized classification datasets with only numerical features. The table shows the performance (accuracy) of different models across 10 datasets. The ‘Default’ row shows the performance of models using their default hyperparameters, and the ‘Searched’ row shows the performance after hyperparameter search. The table helps demonstrate the effectiveness of DOFEN (ours) compared to other models in this specific setting.
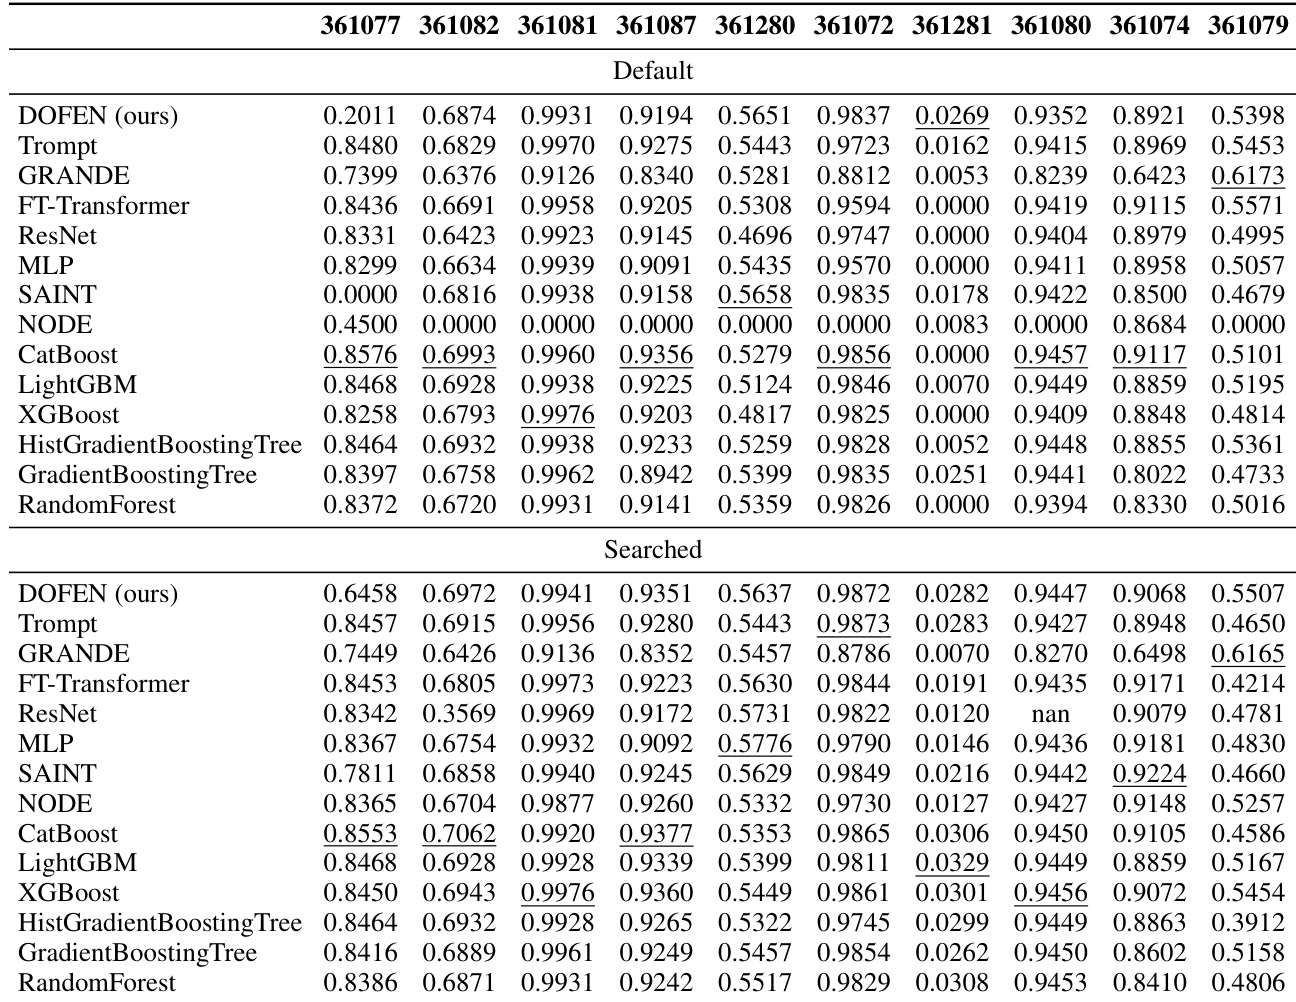
This table presents the performance of various models on medium-sized classification datasets containing only numerical features. The table shows the performance (accuracy) of each model on 10 different datasets, providing a detailed breakdown of the results. The models compared include DOFEN, Trompt, GRANDE, FT-Transformer, ResNet, MLP, SAINT, NODE, CatBoost, LightGBM, XGBoost, HistGradientBoosting Tree, GradientBoosting Tree, and Random Forest. Both default and searched hyperparameter settings are reported for each model.
This table shows the number of estimators (Nestimator), number of columns (Ncol), and number of relaxed oblivious decision trees (NrODT) for each dataset used in the paper’s experiments. It provides specific hyperparameter settings for the DOFEN model used in the evaluation. The Nestimator value is calculated using a formula which depends on the dataset size.

This table presents the performance of various models on medium-sized classification datasets with only numerical features. The table shows the performance metrics (likely accuracy) for each model on a set of datasets (identified by their OpenML IDs). The ‘Default’ and ‘Searched’ rows likely represent results using default hyperparameters and hyperparameters found via a search, respectively. The table provides a comparison of DOFEN against other tree-based and deep learning methods.
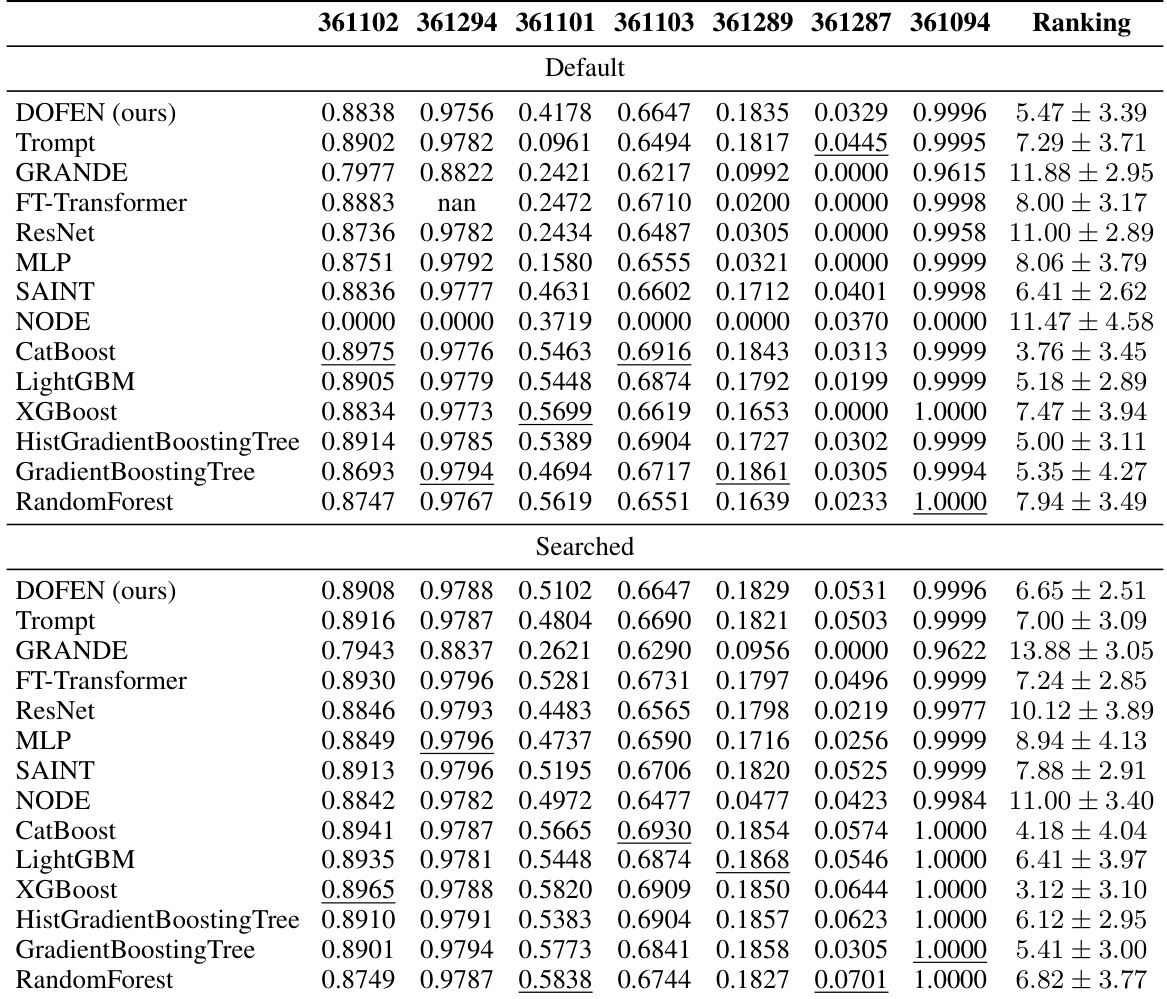
This table presents the performance of various models on medium-sized classification datasets with only numerical features. The table shows the performance (accuracy) of different models on a specific set of datasets. Each column represents a different dataset, and each row represents a different model. The table is divided into two parts: ‘Default’ and ‘Searched,’ representing the model performance with default and searched hyperparameters respectively. The ‘Ranking’ column provides the average rank across all datasets for each model.

This table presents the performance of various machine learning models on a subset of medium-sized classification datasets containing only numerical features. The table shows the performance (accuracy) of each model on 10 specific datasets. The datasets are identified by their OpenML IDs. The results are presented for both the default and searched hyperparameter settings for each model. The ranking of each model across all datasets is also included, providing a summary of their relative performance.
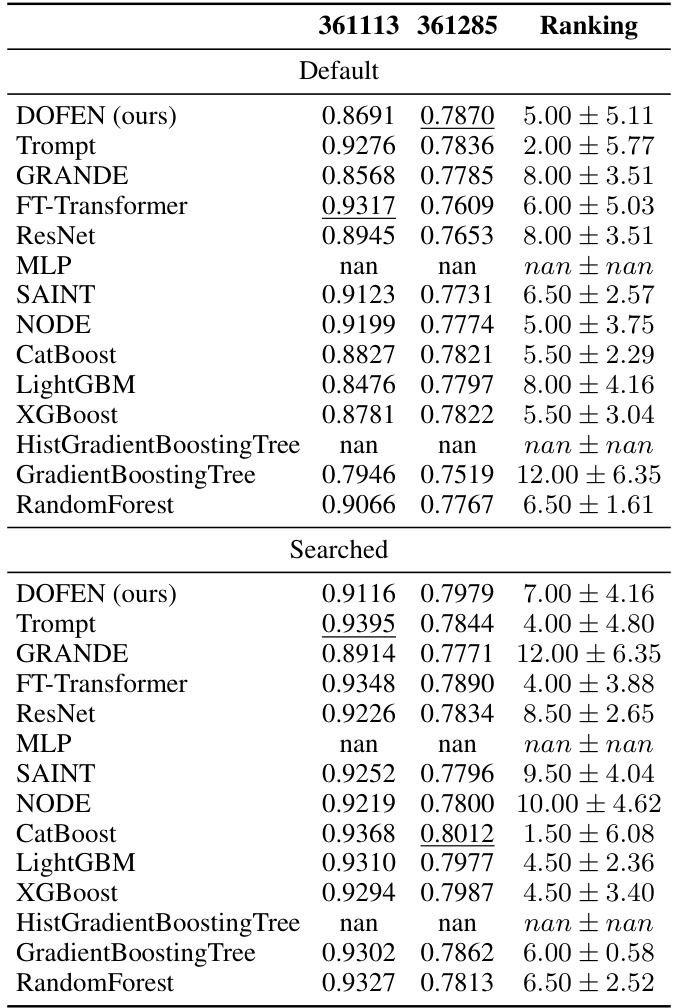
This table presents the performance of various models on medium-sized classification datasets with heterogeneous features. The table shows the performance (accuracy) of each model on each dataset in the benchmark, and then shows the average rank of each model across all the datasets and their standard deviations. This provides a comprehensive comparison of the models’ performance on this specific task and feature type.

This table presents the performance of various models on medium-sized classification datasets containing only numerical features. The results are organized to show the performance of each model across different datasets. The table includes metrics to assess the performance of each model, allowing for a comparison of their effectiveness on this specific type of dataset.

This table presents the detailed performance of various models on medium-sized classification datasets containing only numerical features. It shows the performance (accuracy) of each model on 10 datasets, along with the ranking of each model across all 10 datasets. The table includes results for both default and searched hyperparameters, allowing for a comparison of performance with default settings versus optimized settings. The models evaluated include DOFEN, Trompt, GRANDE, FT-Transformer, ResNet, MLP, SAINT, NODE, CatBoost, LightGBM, XGBoost, HistGradientBoosting Tree, GradientBoosting Tree, and Random Forest. The ranking is a mean and standard deviation across the 10 datasets.

This table presents a computational efficiency analysis of various models, including DOFEN, on medium-sized classification datasets. It compares the performance (accuracy), FLOPS (floating point operations), number of parameters, and inference time for each model using the default hyperparameter settings. The results offer insights into the computational trade-offs of different models for tabular data classification.
This table lists the calculated Nestimator values for each dataset used in the study. It also shows the number of columns (Ncol) and the number of relaxed oblivious decision trees (NrODT) for each dataset. Nestimator is a hyperparameter in the DOFEN model, representing the number of pairs of weights and embedding vectors randomly sampled to form an rODT forest.

This table lists the calculated Nestimator values for each dataset used in the study, along with the corresponding number of columns (Ncol) and the number of relaxed oblivious decision trees (NrODT). Nestimator is a hyperparameter that determines the number of (weight, embedding) pairs sampled to form each relaxed ODT forest during training. The values are calculated using a pre-defined formula, and the datasets are identified by their OpenML IDs. This information is crucial for understanding and reproducing the experimental setup and results.

This table shows the calculated number of estimators (Nestimator) for each dataset in the Tabular Benchmark. It also provides the number of columns (Ncol) and the number of relaxed oblivious decision trees (NrODT) for each dataset. The Nestimator is calculated using a formula mentioned in the paper, and these values help configure the DOFEN model for optimal performance on the respective dataset.

This table presents a computational efficiency analysis focusing on medium-sized classification datasets. It compares several models (DOFEN, Trompt, FT-Transformer, NODE, XGBoost, LightGBM, and CatBoost) across four key metrics: Performance (Accuracy), FLOPS (Millions), Parameters (Millions), and Inference time (seconds). The analysis utilizes default hyperparameters for each model.
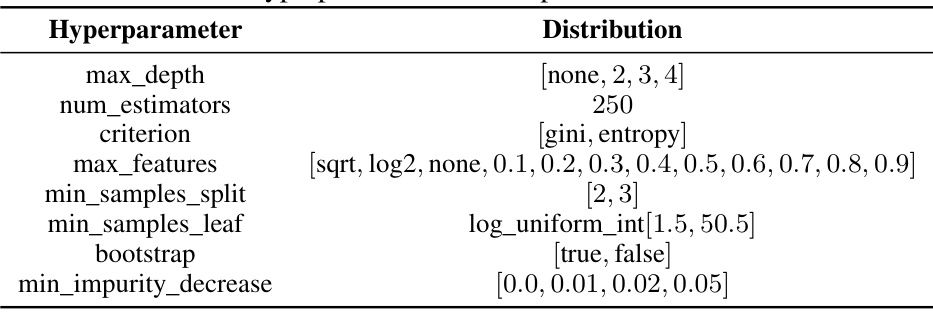
This table shows the calculated Nestimator for each dataset used in the paper’s experiments. The Nestimator value is derived using a formula which takes into account the number of columns (Ncol) and the number of relaxed oblivious decision trees (NrODT). The table is organized by OpenML ID for easy reference to the datasets.

This table shows the number of estimators (Nestimator), the number of columns (Ncol), and the number of relaxed oblivious decision trees (NrODT) for each dataset used in the experiments. These values are calculated using formulas described in the paper and depend on the specific characteristics of each dataset. The table is organized by the OpenML ID of each dataset.
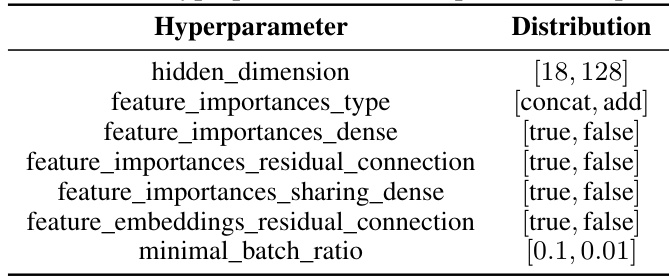
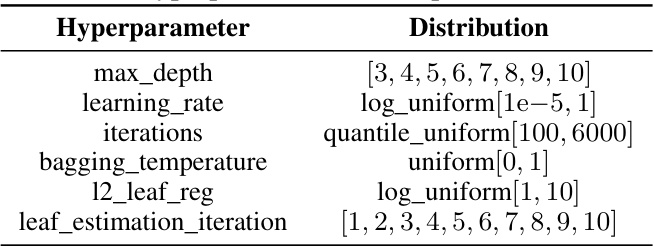
This table shows the hyperparameter search space used for the Trompt model in the paper’s experiments. It lists each hyperparameter (e.g., hidden_dimension, feature_importances_type) and specifies its possible values or distribution (e.g., [18, 128], [concat, add]). These settings were used to tune the model for optimal performance on the Tabular Benchmark datasets.

This table shows the calculated Nestimator for each dataset in the Tabular Benchmark using the default hyperparameters of the DOFEN model. It provides the number of columns (Ncol) and the number of relaxed oblivious decision trees (NrODT) for each dataset, which are hyperparameters used in the DOFEN model construction. The Nestimator, which represents the number of (weight, embedding) pairs sampled for each forest, is also shown. The OpenML IDs are used to identify each dataset.
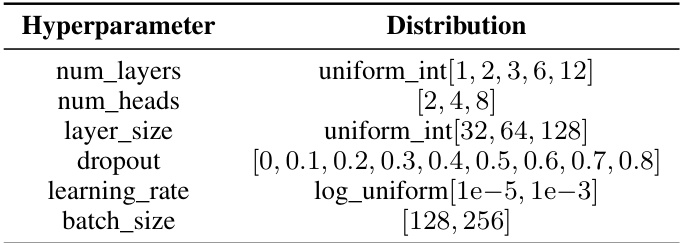
This table lists the number of columns (Ncol), the number of relaxed oblivious decision trees (NrODT), and the number of estimators (Nestimator) for each dataset used in the experiments. Nestimator is a hyperparameter calculated by a formula that depends on Ncol and NrODT. The table provides details on the configuration of the DOFEN model for different datasets.
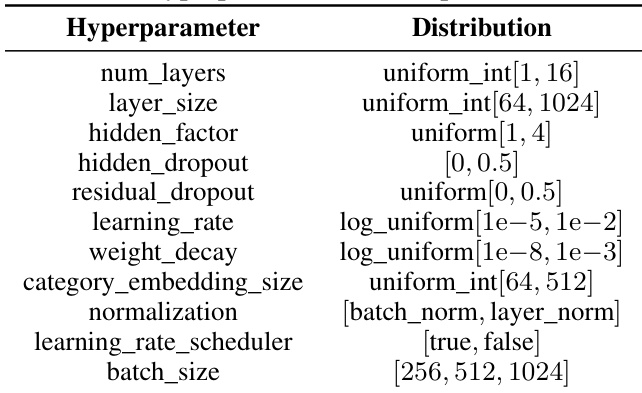
This table presents the performance of various models on medium-sized classification datasets with heterogeneous features. It lists the average accuracy and standard deviation for each model across multiple datasets. The models are categorized into DOFEN (the proposed method) and baseline models.

This table lists the calculated Nestimator value for each dataset used in the study, along with the corresponding number of columns (Ncol) and the number of relaxed oblivious decision trees (NrODT). These values are crucial for understanding the configuration and hyperparameter settings used in the DOFEN model, especially during the two-level relaxed ODT ensemble process. The OpenML ID is also included to help identify each dataset.

This table presents the detailed performance of various models on a subset of medium-sized regression datasets with exclusively numerical features. The performance is evaluated using the R-squared score. The table provides a comparison of DOFEN against several baseline models, including tree-based models (e.g., CatBoost, XGBoost, GradientBoosting Tree, RandomForest) and deep learning models (e.g., Trompt, FT-Transformer, NODE, ResNet, MLP, SAINT, GRANDE). Both default and searched hyperparameter configurations are shown for each model.
Full paper#


