TL;DR#
Building ontologies manually is laborious. While LLMs show promise in automating parts of this process, current methods tackle ontology creation through a series of subtasks, neglecting interactions between them. This leads to suboptimal results. This paper aims to address these issues.
The proposed method, OLLM, uses LLMs to construct an ontology from scratch in an end-to-end fashion. This means modeling entire subcomponents of the ontology at once, improving both scalability and performance. The key contributions include introducing OLLM, a novel suite of deep-learning based evaluation metrics, and demonstrating OLLM’s superior performance on Wikipedia and arXiv datasets.
Key Takeaways#
Why does it matter?#
This paper is crucial for researchers in ontology learning and knowledge representation. It introduces a novel, scalable method for building ontologies using large language models, addresses limitations of existing subtask-based approaches, and proposes new evaluation metrics. This work opens new avenues for research in end-to-end ontology learning and its application to various domains, pushing the boundaries of automated knowledge extraction and management.
Visual Insights#

🔼 This figure illustrates the overall architecture of the OLLM model. The training phase involves using document annotations to train a large language model (LLM) to predict subgraphs of an ontology. A custom regularizer is used to reduce overfitting. The inference phase uses the trained LLM to generate subgraphs for new documents, which are then combined and pruned to create the final ontology. Finally, the generated ontology is evaluated by comparing it to a ground truth ontology.
read the caption
Figure 1: OLLM: Using annotations of documents with their relevant concepts, we train an LLM to model relevant subgraphs of the target ontology with a custom regulariser. During inference, the generated subgraphs for each document are summed and pruned to give the final output ontology. For evaluation, we measure the similarity between the generated ontology and the ground truth.

🔼 This table presents the quantitative results of the experiments conducted on Wikipedia and arXiv datasets to evaluate the performance of OLLM against several baseline methods. The metrics used to assess the quality of the generated ontologies are Literal F1, Fuzzy F1, Continuous F1, Graph F1, and Motif Distance. Higher values for Literal F1, Fuzzy F1, Continuous F1, and Graph F1 generally indicate better performance, while a lower Motif Distance value indicates better structural integrity. The table shows that OLLM outperforms other methods, particularly in semantic similarity (Fuzzy F1 and Continuous F1), while remaining competitive in syntactic and structural similarity. The results are separated for Wikipedia (in-domain evaluation) and arXiv (out-of-domain evaluation).
read the caption
Table 1: Evaluation metrics of OLLM and baselines on Wikipedia and arXiv. OLLM performs particularly well in modelling semantics, and remains competitive syntactically and structurally.
In-depth insights#
LLM-based Ontology#
LLM-based ontology learning represents a significant advancement in automating the creation of ontologies, traditionally a labor-intensive process. Large language models (LLMs), with their vast knowledge bases and pattern recognition capabilities, are uniquely positioned to tackle various subtasks such as concept discovery and relation extraction. However, a crucial aspect is moving beyond treating these as isolated tasks and instead developing end-to-end methods. This holistic approach allows the LLM to understand the intricate relationships between different components, resulting in more semantically accurate and structurally sound ontologies. Challenges remain, including dealing with noisy data, ensuring the scalability of the method for large-scale ontologies, and evaluating the quality of the generated ontology using appropriate metrics beyond simple syntactic comparisons. Future research should focus on addressing these challenges and exploring the potential of LLMs to build more complex ontologies, incorporating reasoning and axioms, and extending capabilities to other knowledge representation formats beyond taxonomic relationships.
OLLM Architecture#
A hypothetical “OLLM Architecture” for end-to-end ontology learning would likely involve a multi-stage pipeline. It would begin with data preprocessing, transforming raw text or other unstructured data into a structured format suitable for LLM processing. This might include techniques for named entity recognition (NER), relation extraction, and potentially knowledge graph embedding. The core of the architecture would be a finetuned large language model (LLM), trained on a dataset of ontology examples. The LLM would take as input the preprocessed data and generate ontology subgraphs. A crucial design choice is how to represent these subgraphs—as sequences of nodes and edges, graph adjacency matrices, or some other suitable formalism. A novel regularizer might be incorporated into the LLM training to mitigate overfitting on high-frequency concepts. After LLM generation, a post-processing stage would be necessary to combine and refine the subgraphs, handling inconsistencies and ensuring structural integrity (e.g., acyclicity). Finally, the resulting ontology would be evaluated using a comprehensive set of metrics, including semantic and structural similarity measures, to assess its quality against a gold standard.
Ontology Evaluation#
Ontology evaluation is a critical yet challenging aspect of ontology engineering. Traditional methods often rely on syntactic similarity, comparing ontologies based on literal text matching or edit distance, which are insufficient for capturing semantic meaning. More advanced approaches use semantic similarity measures based on vector embeddings or graph kernels, comparing the meaning of concepts and their relationships, which yields more robust evaluation. The choice of metrics significantly impacts the results; structural metrics assess the graph’s topology, while semantic metrics evaluate concept meanings. A comprehensive evaluation should employ a suite of diverse metrics to provide a holistic view of ontology quality. The selection of appropriate metrics depends on the specific ontology and its intended application. The availability of ground truth ontologies also influences the evaluation methodology; when ground truth is absent, alternative approaches like task-based evaluation must be considered. Data scarcity and bias can affect evaluation results, highlighting the importance of using diverse and representative datasets for fair evaluation.
OLLM Limitations#
The OLLM model, while innovative in its end-to-end approach to ontology learning, exhibits several limitations. Scalability to extremely large ontologies remains a challenge, as the subgraph modelling approach, while efficient for smaller subcomponents, might struggle with the computational demands of massive datasets. The reliance on a pre-trained language model introduces biases and limitations inherent to the model’s training data, potentially affecting the accuracy and generalizability of the generated ontologies. Furthermore, the evaluation metrics, while novel, may not fully capture the nuanced complexities of semantic similarity between ontologies, necessitating further refinement. Finally, the model’s reliance on specific document annotations for training limits its applicability to datasets lacking such structured metadata, thus hindering its potential for broader use. Addressing these limitations would significantly enhance the robustness and applicability of OLLM in practical ontology construction scenarios.
Future of OLLM#
The future of OLLM (Ontology Learning with Large Language Models) is promising, particularly given its demonstrated ability to surpass traditional subtask-based methods in constructing ontologies. Further research should focus on expanding OLLM’s capabilities to handle more complex ontologies and diverse relation types beyond taxonomic relations. Improving scalability and efficiency is crucial, as is addressing the limitations of current evaluation metrics. The development of robust metrics that capture semantic and structural similarity more comprehensively is key. Exploring the integration of OLLM with other data sources like images and videos could unlock new applications and further enhance ontology construction. Addressing potential biases and ensuring fairness in the generated ontologies will be critical for ethical considerations. Ultimately, OLLM’s continued development and refinement has the potential to revolutionize the field of ontology engineering and significantly impact various knowledge-intensive applications.
More visual insights#
More on figures

🔼 This figure shows the overall architecture of the OLLM model. The training phase involves using document annotations and a custom regularizer to fine-tune a large language model (LLM). During inference, the LLM generates subgraphs for each document. These subgraphs are combined and then pruned to create the final ontology. Finally, the generated ontology is evaluated by comparing it against a gold standard ontology.
read the caption
Figure 1: OLLM: Using annotations of documents with their relevant concepts, we train an LLM to model relevant subgraphs of the target ontology with a custom regulariser. During inference, the generated subgraphs for each document are summed and pruned to give the final output ontology. For evaluation, we measure the similarity between the generated ontology and the ground truth.

🔼 The figure shows the number of overlapping concepts among the train, validation, and test sets for both the Wikipedia and arXiv datasets. It illustrates the data split strategy used to prevent data leakage, ensuring that the test set contains unseen concepts and relations. The Venn diagrams visually represent the number of concepts unique to each set and the number shared between them.
read the caption
Figure 3: Intersection of concepts among the train, validation and test splits of the datasets.

🔼 This figure compares the per-token loss on a test set example for two models: one trained with a custom masked loss objective and another trained without it. The stronger red color indicates a higher cross-entropy loss. The figure highlights that the masked loss objective helps improve generalization on high-level relations while maintaining performance on lower-level relations. This is achieved by selectively masking the loss contributions from high-frequency concepts during training, thereby preventing overfitting.
read the caption
Figure 4: Per token loss on a test set example of the final model trained with and without the custom masked loss objective. A stronger red colour represents a higher cross-entropy loss. Within the top-level concepts (children of the root) shown here, “Culture” and “Humanities” are in the training set while others are not. Using the masked loss objective improves generalisation on the high-level relations (e.g., “Main topic classifications” → “Academic disciplines”) while maintaining performance on lower-level relations.

🔼 This figure illustrates the overall pipeline of the OLLM model. It shows how the model is trained using document annotations and a custom regularizer to learn subgraphs of an ontology. During inference, the model generates subgraphs for each document, these are then combined and pruned to produce the final ontology. The model’s performance is evaluated by comparing the generated ontology to a ground truth ontology.
read the caption
Figure 1: OLLM: Using annotations of documents with their relevant concepts, we train an LLM to model relevant subgraphs of the target ontology with a custom regulariser. During inference, the generated subgraphs for each document are summed and pruned to give the final output ontology. For evaluation, we measure the similarity between the generated ontology and the ground truth.

🔼 This figure illustrates the overall architecture of the OLLM model. It shows the training phase where an LLM is fine-tuned using document annotations and a custom regularizer to learn relevant subgraphs of the target ontology. The inference phase depicts how these subgraphs are combined and pruned to generate the final ontology. Finally, it highlights the evaluation process, comparing the generated ontology to a gold standard for quality assessment.
read the caption
Figure 1: OLLM: Using annotations of documents with their relevant concepts, we train an LLM to model relevant subgraphs of the target ontology with a custom regulariser. During inference, the generated subgraphs for each document are summed and pruned to give the final output ontology. For evaluation, we measure the similarity between the generated ontology and the ground truth.

🔼 This figure illustrates the overall architecture of OLLM, an end-to-end ontology learning method. The training process involves using document annotations to train a large language model (LLM) to create subgraphs of an ontology. A custom regulariser helps prevent overfitting. During inference, these subgraphs are combined and refined to produce a complete ontology, which is then evaluated against a gold standard ontology for accuracy. The diagram clearly shows the input (dataset), the training and inference stages, and the output (ontology).
read the caption
Figure 1: OLLM: Using annotations of documents with their relevant concepts, we train an LLM to model relevant subgraphs of the target ontology with a custom regulariser. During inference, the generated subgraphs for each document are summed and pruned to give the final output ontology. For evaluation, we measure the similarity between the generated ontology and the ground truth.

🔼 This figure illustrates the overall architecture of the OLLM model. It shows the training phase, where an LLM is trained on document-concept annotations using a custom regularizer to prevent overfitting. The inference phase shows how the model generates ontology subgraphs for each document, which are then combined and pruned to create the final ontology. Finally, the evaluation phase shows how the generated ontology is compared to a ground truth ontology for assessing its quality.
read the caption
Figure 1: OLLM: Using annotations of documents with their relevant concepts, we train an LLM to model relevant subgraphs of the target ontology with a custom regulariser. During inference, the generated subgraphs for each document are summed and pruned to give the final output ontology. For evaluation, we measure the similarity between the generated ontology and the ground truth.

🔼 This figure visualizes the node matching results from the Graph F1 metric, comparing an ontology generated by the OLLM model against a ground truth ontology. The color-coding and opacity of the edges represent the similarity scores between matched nodes, providing a visual representation of the semantic relationships between the two ontologies. The layout highlights the clustering of similar concepts (Mathematics, Biology, and Economics) in both ontologies, demonstrating a high degree of semantic alignment.
read the caption
Figure 9: Highest scoring node matching from the Graph F1 metric between the ontology generated by OLLM (teal) and the ground truth ontology (black). The matching between nodes is shown in red, where the opacity of the edge indicates the similarity score (weaker links are more transparent). Visually, the matching defines a clear alignment of the two graphs: from the centre to the left we have the Mathematics-related concepts; at the top right we have Biology-related concepts; and at the bottom right we have Economics-related concepts.

🔼 This figure visualizes the node matching results from the Graph F1 metric, which measures the semantic similarity between the ontology generated by the OLLM model and the ground truth ontology. Nodes are represented as circles, with teal representing nodes from the OLLM ontology and black representing nodes from the ground truth. The thickness and opacity of the edges connecting the nodes indicate the similarity score, with thicker, more opaque edges suggesting higher similarity. The layout of the graph visually demonstrates a high degree of semantic alignment between the two ontologies, grouping related concepts together (e.g., Mathematics, Biology, Economics).
read the caption
Figure 9: Highest scoring node matching from the Graph F1 metric between the ontology generated by OLLM (teal) and the ground truth ontology (black). The matching between nodes is shown in red, where the opacity of the edge indicates the similarity score (weaker links are more transparent). Visually, the matching defines a clear alignment of the two graphs: from the centre to the left we have the Mathematics-related concepts; at the top right we have Biology-related concepts; and at the bottom right we have Economics-related concepts.

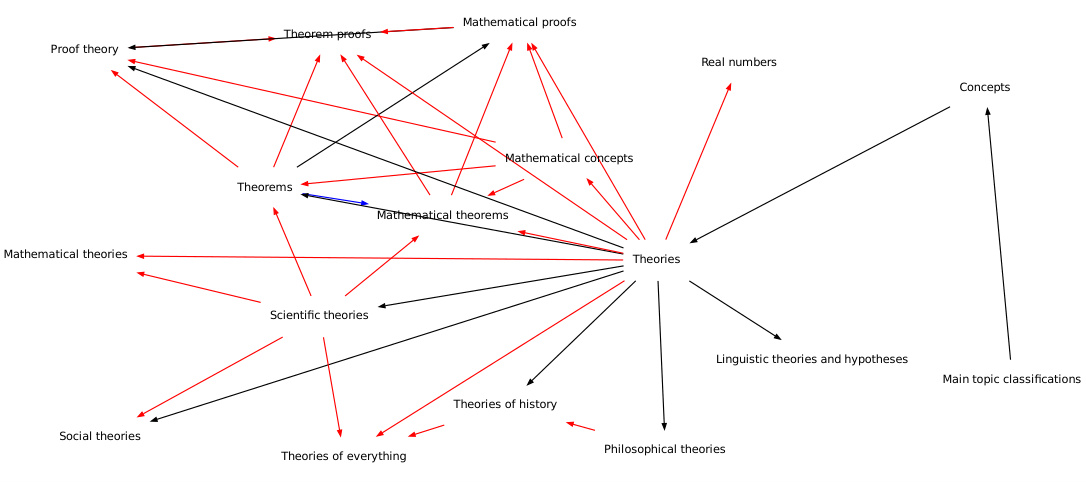
🔼 This figure visualizes sub-ontologies generated by the OLLM model for three different Wikipedia topics: Biology, Language Policy, and Mathematical Structures. Each sub-ontology is a directed acyclic graph where nodes represent concepts and edges represent taxonomic relationships (is-a or is-subclass-of). The visualization helps to understand the model’s ability to capture the hierarchical structure and semantic relationships within a domain. The color-coding of the edges might indicate the source of the relationships (e.g., training data, test data, or newly generated relationships).
read the caption
Figure 11: Sub-ontologies for Wikipedia generated by OLLM, centred on various topics.

🔼 This figure visualizes sub-ontologies generated by the OLLM model for three different topics from Wikipedia: Biology, Language Policy, and Mathematical Structures. Each sub-ontology is a subgraph of the larger Wikipedia ontology, showing a focused section of the knowledge structure. The visualization helps to understand how OLLM organizes concepts and relationships within specific domains, demonstrating the model’s ability to create semantically meaningful and structurally coherent ontologies.
read the caption
Figure 11: Sub-ontologies for Wikipedia generated by OLLM, centred on various topics.

🔼 This figure shows the pipeline of the OLLM model. The model takes as input a dataset of documents annotated with relevant concepts. It uses a large language model (LLM) fine-tuned with a custom regularizer to generate subgraphs representing parts of the target ontology. These subgraphs are then combined and pruned to produce the final ontology. The ontology’s quality is assessed by comparing it to a gold standard ontology.
read the caption
Figure 1: OLLM: Using annotations of documents with their relevant concepts, we train an LLM to model relevant subgraphs of the target ontology with a custom regulariser. During inference, the generated subgraphs for each document are summed and pruned to give the final output ontology. For evaluation, we measure the similarity between the generated ontology and the ground truth.

🔼 This figure shows the overall architecture of the OLLM model. It consists of a training phase where an LLM is fine-tuned using document annotations and a custom regularizer to predict relevant subgraphs of an ontology. In the inference phase, these subgraphs are combined and pruned to form the final ontology. The process concludes with a gold standard evaluation measuring the similarity between the generated and ground truth ontologies.
read the caption
Figure 1: OLLM: Using annotations of documents with their relevant concepts, we train an LLM to model relevant subgraphs of the target ontology with a custom regulariser. During inference, the generated subgraphs for each document are summed and pruned to give the final output ontology. For evaluation, we measure the similarity between the generated ontology and the ground truth.
🔼 This figure visualizes the node matching results from the Graph F1 metric, which measures the semantic similarity between the ontology generated by OLLM and the ground truth ontology. Nodes are color-coded (teal for OLLM, black for ground truth) and edges representing matches are shown in red, with transparency indicating the strength of the match (higher transparency = weaker match). The layout visually demonstrates strong alignment of semantically similar concepts between the generated and ground truth ontologies, grouped by mathematical, biological, and economic themes.
read the caption
Figure 9: Highest scoring node matching from the Graph F1 metric between the ontology generated by OLLM (teal) and the ground truth ontology (black). The matching between nodes is shown in red, where the opacity of the edge indicates the similarity score (weaker links are more transparent). Visually, the matching defines a clear alignment of the two graphs: from the centre to the left we have the Mathematics-related concepts; at the top right we have Biology-related concepts; and at the bottom right we have Economics-related concepts.

🔼 This figure visualizes sub-ontologies generated by the Memorisation method for Wikipedia. Three different topics are shown: Artificial objects, Fraud, and Nature and religion. Each sub-ontology is a subgraph, representing a portion of the larger Wikipedia ontology. The nodes represent concepts, and the edges represent taxonomic relationships between them. The figure provides a qualitative assessment of the Memorisation method’s ability to capture semantic relationships within the data.
read the caption
Figure 13: Sub-ontologies for Wikipedia generated by Memorisation, centred on various topics.

🔼 This figure visualizes sub-ontologies generated by the Memorisation baseline method for three different Wikipedia topics: Artificial objects, Fraud, and Nature and religion. Each sub-ontology is represented as a graph where nodes represent concepts and edges represent taxonomic relations. The graphs illustrate how the model connects various concepts within a specific topic, demonstrating its ability to identify and link related themes.
read the caption
Figure 13: Sub-ontologies for Wikipedia generated by Memorisation, centred on various topics.
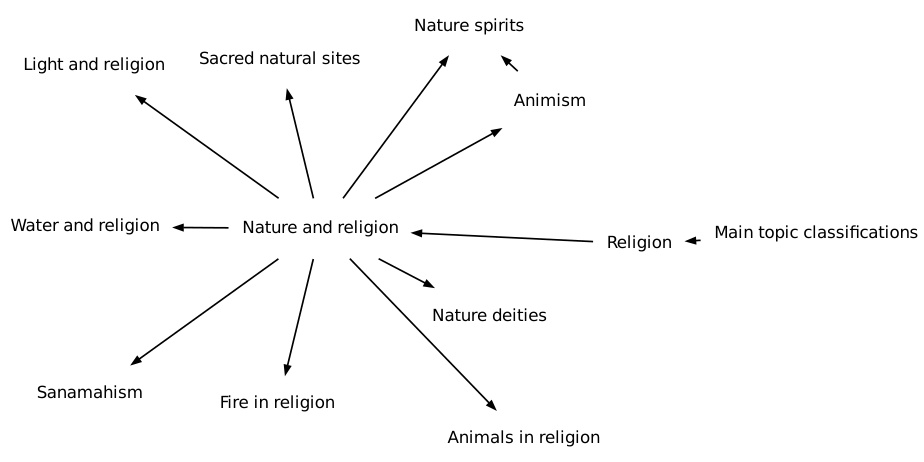
🔼 This figure visualizes sub-ontologies generated by the Memorisation baseline method for Wikipedia, focusing on three different central topics: Artificial Objects, Fraud, and Nature and Religion. Each sub-ontology shows a subgraph of the Wikipedia category graph, illustrating the relationships between various concepts related to the central topic. The figure highlights the structural differences in the ontologies produced by different methods, particularly revealing oversimplification or poor organization in the Memorisation-generated ontologies.
read the caption
Figure 13: Sub-ontologies for Wikipedia generated by Memorisation, centred on various topics.

🔼 This figure illustrates the overall pipeline of the OLLM model. The training phase involves using annotated documents (linking documents to relevant concepts) to fine-tune a large language model (LLM). A custom regularizer is employed to mitigate overfitting. During inference, the LLM generates subgraphs representing portions of the target ontology for each input document. These subgraphs are then combined and refined through a pruning process to create the final ontology. The model’s performance is assessed by comparing the generated ontology to a ground truth ontology.
read the caption
Figure 1: OLLM: Using annotations of documents with their relevant concepts, we train an LLM to model relevant subgraphs of the target ontology with a custom regulariser. During inference, the generated subgraphs for each document are summed and pruned to give the final output ontology. For evaluation, we measure the similarity between the generated ontology and the ground truth.

🔼 This figure visualizes sub-ontologies generated by the Hearst method for three different Wikipedia topics: Drugs, Government, and Society. Each sub-ontology is represented as a graph where nodes represent concepts and edges represent taxonomic relationships. The graphs show how the Hearst method organizes concepts within these topics, highlighting the hierarchical relationships and connections between concepts.
read the caption
Figure 14: Sub-ontologies for Wikipedia generated by Hearst, centred on various topics.

🔼 This figure visualizes sub-ontologies generated by the Hearst method for three different Wikipedia topics: Drugs, Government, and Society. Each sub-ontology is a graph where nodes represent concepts and edges represent taxonomic relationships. The visualization helps to understand the structure and relationships between concepts within each topic as identified by the Hearst pattern-based ontology learning method. The visualization shows differences in the structure and organization of concepts across these different topics.
read the caption
Figure 14: Sub-ontologies for Wikipedia generated by Hearst, centred on various topics.
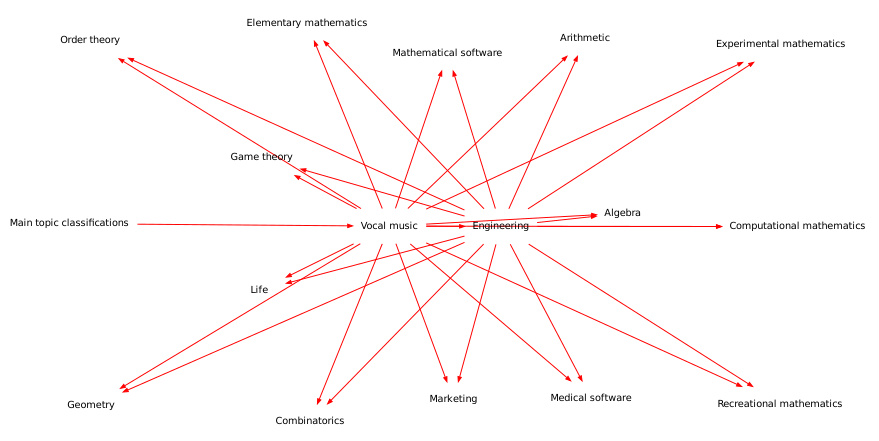
🔼 This figure visualizes sub-ontologies generated by the REBEL model for various Wikipedia topics. Each sub-ontology is a graph where nodes represent concepts and edges represent relationships. The graphs illustrate the model’s ability to generate structural relationships between concepts related to different themes such as ‘Elections’, ‘Money’, and ‘Vocal music’. The visualization helps in understanding the model’s performance in capturing hierarchical relationships between related concepts within a domain.
read the caption
Figure 15: Sub-ontologies for Wikipedia generated by REBEL, centred on various topics.

🔼 This figure illustrates the overall architecture of the OLLM model. The training phase involves using document annotations and a custom regulariser to fine-tune a large language model (LLM). This LLM learns to generate subgraphs representing parts of the target ontology. During inference, these subgraphs are combined and refined to produce a complete ontology. Finally, the quality of the generated ontology is assessed by comparing it against a gold standard ontology.
read the caption
Figure 1: OLLM: Using annotations of documents with their relevant concepts, we train an LLM to model relevant subgraphs of the target ontology with a custom regulariser. During inference, the generated subgraphs for each document are summed and pruned to give the final output ontology. For evaluation, we measure the similarity between the generated ontology and the ground truth.
🔼 This figure illustrates the overall pipeline of the OLLM model. It starts with a dataset containing documents annotated with relevant concepts. An LLM is trained on this data using a mask-regularised loss function to learn how to generate subgraphs (parts) of the target ontology. During inference, these generated subgraphs are combined and pruned using a sum and prune step to produce the final predicted ontology. The model’s performance is then evaluated by comparing the generated ontology to a gold standard ground truth ontology. The diagram highlights the training, inference, and evaluation phases of the model.
read the caption
Figure 1: OLLM: Using annotations of documents with their relevant concepts, we train an LLM to model relevant subgraphs of the target ontology with a custom regulariser. During inference, the generated subgraphs for each document are summed and pruned to give the final output ontology. For evaluation, we measure the similarity between the generated ontology and the ground truth.
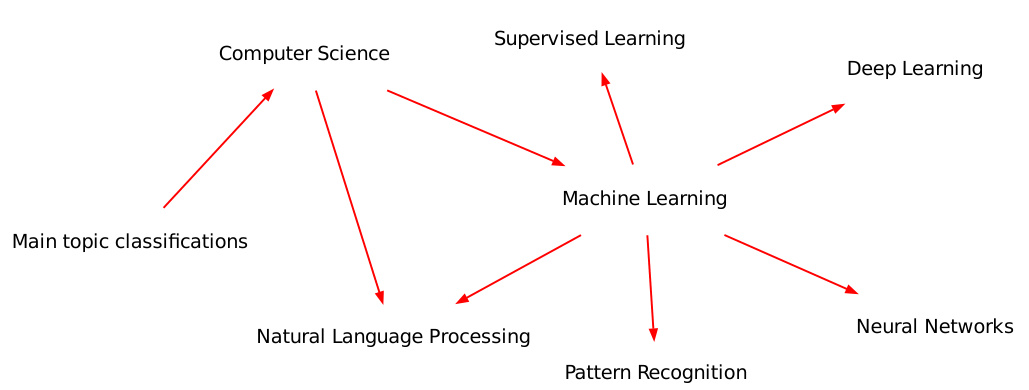
🔼 This figure illustrates the overall architecture of the OLLM model. The training phase involves using document annotations (linking documents to concepts) to train a large language model (LLM). A custom regularizer is used during training to prevent overfitting. In the inference phase, the LLM generates subgraphs for each document, which are then combined and refined using a pruning process. Finally, the generated ontology is evaluated against a ground truth ontology to assess its quality.
read the caption
Figure 1: OLLM: Using annotations of documents with their relevant concepts, we train an LLM to model relevant subgraphs of the target ontology with a custom regulariser. During inference, the generated subgraphs for each document are summed and pruned to give the final output ontology. For evaluation, we measure the similarity between the generated ontology and the ground truth.

🔼 This figure illustrates the overall pipeline of the OLLM model. It starts with a dataset of documents annotated with relevant concepts. These are used to train a Large Language Model (LLM) to generate subgraphs representing parts of the target ontology. A custom regulariser helps prevent overfitting. During inference, the LLM produces subgraphs for new documents. These subgraphs are combined and pruned to create the final ontology. Finally, the generated ontology is evaluated by comparing it to a ground truth ontology.
read the caption
Figure 1: OLLM: Using annotations of documents with their relevant concepts, we train an LLM to model relevant subgraphs of the target ontology with a custom regulariser. During inference, the generated subgraphs for each document are summed and pruned to give the final output ontology. For evaluation, we measure the similarity between the generated ontology and the ground truth.
🔼 This figure shows the overall architecture of the OLLM model. It takes as input a dataset consisting of documents annotated with relevant concepts. An LLM is then fine-tuned using a custom regulariser (to reduce overfitting), which learns to map documents to relevant subgraphs of the target ontology. During inference, these subgraphs are aggregated and pruned using a simple process, resulting in the final predicted ontology. Finally, the model is evaluated by comparing this predicted ontology with a ground truth ontology.
read the caption
Figure 1: OLLM: Using annotations of documents with their relevant concepts, we train an LLM to model relevant subgraphs of the target ontology with a custom regulariser. During inference, the generated subgraphs for each document are summed and pruned to give the final output ontology. For evaluation, we measure the similarity between the generated ontology and the ground truth.

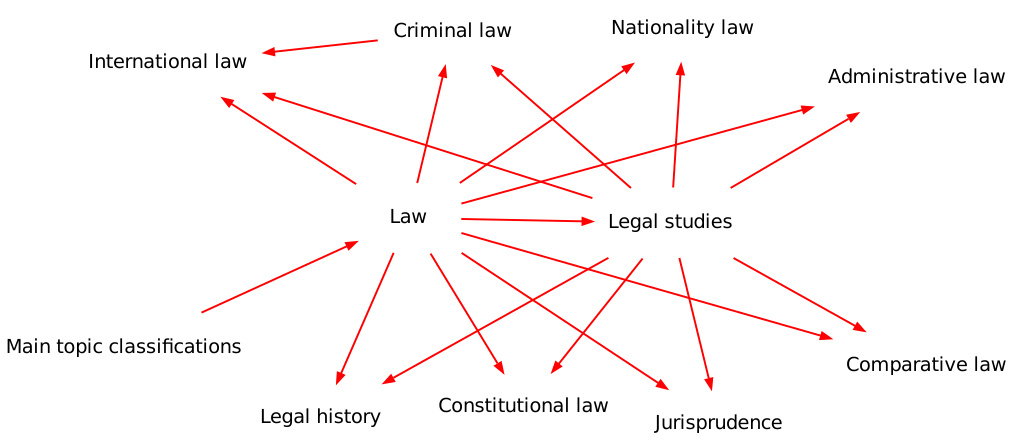
🔼 This figure visualizes sub-ontologies generated by the One-shot method on Wikipedia. Three different topics are shown: Athletics, Legal Studies, and Physiology. Each sub-ontology is a small subgraph of the overall Wikipedia category graph, showing the relationships between the concepts within a specific domain. The visualization shows the hierarchical structure of the ontologies with the concepts and taxonomic relations between them. The edges are colored red to indicate the connections identified by the model, showcasing the structure and the relationships that the One-shot approach has learned.
read the caption
Figure 17: Sub-ontologies for Wikipedia generated by One-shot, centred on various topics.

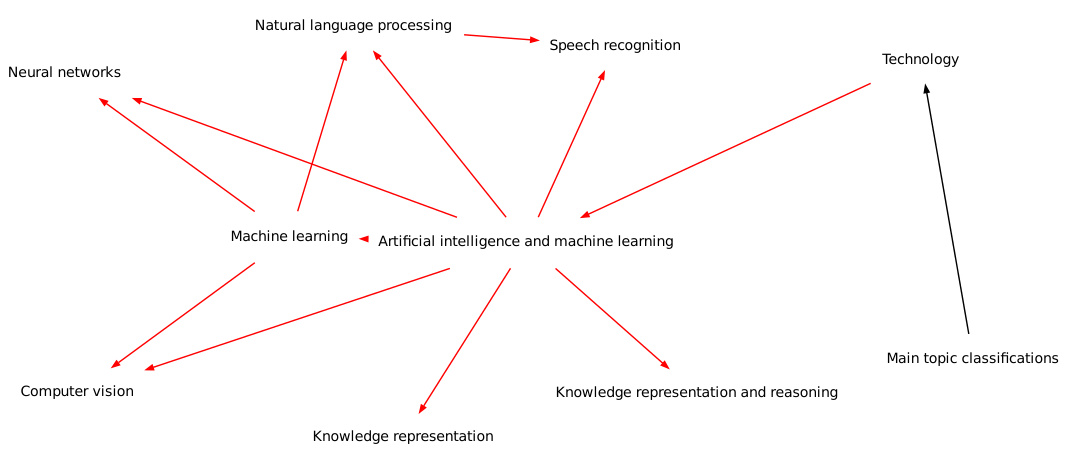
🔼 This figure visualizes sub-ontologies generated by the Three-shot method for Wikipedia. Three examples are shown, focusing on ‘Aerospace technology’, ‘Artificial intelligence and machine learning’, and ‘Elections’. Each sub-ontology is a directed graph where nodes represent concepts and edges represent taxonomic relations. The graphs illustrate how the Three-shot method structures concepts within these domains, revealing the hierarchical relationships and connections between various terms. The visualization helps to understand the model’s ability to capture semantic relationships and the overall structure of generated ontologies.
read the caption
Figure 18: Sub-ontologies for Wikipedia generated by Three-shot, centred on various topics.
🔼 This figure illustrates the overall pipeline of the OLLM model. The training phase involves using document annotations and a custom regularizer to fine-tune a large language model (LLM) to generate relevant subgraphs of a target ontology. In the inference phase, these subgraphs are combined and refined to produce the final ontology. Finally, the model evaluates the generated ontology by comparing it to a ground truth ontology.
read the caption
Figure 1: OLLM: Using annotations of documents with their relevant concepts, we train an LLM to model relevant subgraphs of the target ontology with a custom regulariser. During inference, the generated subgraphs for each document are summed and pruned to give the final output ontology. For evaluation, we measure the similarity between the generated ontology and the ground truth.

🔼 This figure illustrates the overall architecture of the OLLM model. It shows how the model is trained using document annotations and a custom regularizer to generate subgraphs representing parts of the target ontology. During inference, these subgraphs are combined and refined to create the final ontology. The evaluation process compares the generated ontology to a ground truth ontology to assess its quality.
read the caption
Figure 1: OLLM: Using annotations of documents with their relevant concepts, we train an LLM to model relevant subgraphs of the target ontology with a custom regulariser. During inference, the generated subgraphs for each document are summed and pruned to give the final output ontology. For evaluation, we measure the similarity between the generated ontology and the ground truth.

🔼 This figure visualizes the node matching results from the Graph F1 metric, which measures the semantic similarity between the generated ontology by OLLM and the ground truth ontology. The color intensity of the edges indicates the strength of the match between nodes. The visual layout shows a clear alignment of semantically similar concepts in both ontologies, highlighting the effectiveness of the OLLM model.
read the caption
Figure 9: Highest scoring node matching from the Graph F1 metric between the ontology generated by OLLM (teal) and the ground truth ontology (black). The matching between nodes is shown in red, where the opacity of the edge indicates the similarity score (weaker links are more transparent). Visually, the matching defines a clear alignment of the two graphs: from the centre to the left we have the Mathematics-related concepts; at the top right we have Biology-related concepts; and at the bottom right we have Economics-related concepts.

🔼 This figure illustrates the overall pipeline of the OLLM model. The training phase involves using document annotations to train a large language model (LLM) on relevant subgraphs of the target ontology. A custom regularizer is used to mitigate overfitting. During inference, the LLM generates subgraphs for each document, which are combined and pruned to form the final ontology. The evaluation process compares this generated ontology to a ground truth ontology.
read the caption
Figure 1: OLLM: Using annotations of documents with their relevant concepts, we train an LLM to model relevant subgraphs of the target ontology with a custom regulariser. During inference, the generated subgraphs for each document are summed and pruned to give the final output ontology. For evaluation, we measure the similarity between the generated ontology and the ground truth.
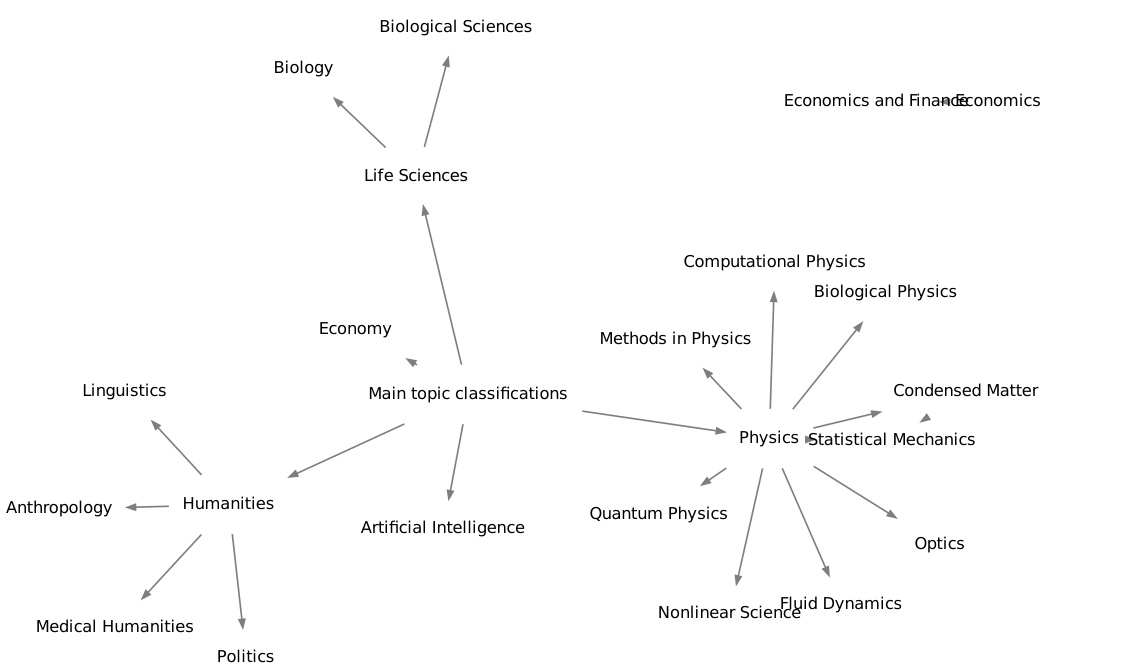
🔼 This figure visualizes the node matching results from the Graph F1 metric, a method used to evaluate the similarity between the ontology generated by the OLLM model and the ground truth ontology. The visualization uses color-coding and opacity to represent the strength of the matches, providing a clear visual representation of the semantic similarity between the two ontologies. The layout of the matched nodes intuitively groups related concepts together (Mathematics on the left, Biology on the top right, and Economics on the bottom right).
read the caption
Figure 9: Highest scoring node matching from the Graph F1 metric between the ontology generated by OLLM (teal) and the ground truth ontology (black). The matching between nodes is shown in red, where the opacity of the edge indicates the similarity score (weaker links are more transparent). Visually, the matching defines a clear alignment of the two graphs: from the centre to the left we have the Mathematics-related concepts; at the top right we have Biology-related concepts; and at the bottom right we have Economics-related concepts.

🔼 This figure illustrates the overall architecture of the OLLM model. It shows the training phase where an LLM is fine-tuned using document annotations and a custom regularizer to learn subgraphs of the target ontology. The inference phase depicts how the model generates subgraphs for each document, which are then combined and pruned to form the final ontology. Finally, the evaluation process assesses the similarity between the generated ontology and the ground truth.
read the caption
Figure 1: OLLM: Using annotations of documents with their relevant concepts, we train an LLM to model relevant subgraphs of the target ontology with a custom regulariser. During inference, the generated subgraphs for each document are summed and pruned to give the final output ontology. For evaluation, we measure the similarity between the generated ontology and the ground truth.

🔼 This figure visualizes the node matching results from the Graph F1 metric, comparing the ontology generated by the OLLM model to the ground truth ontology. Nodes are represented as circles, with teal representing the OLLM generated ontology and black representing the ground truth. Matching nodes are connected by red edges, where edge opacity represents the strength of the match (stronger matches have more opaque red edges). The visualization shows a clear alignment between the generated ontology and ground truth, particularly grouping semantically similar concepts (mathematics, biology, economics) into distinct clusters.
read the caption
Figure 9: Highest scoring node matching from the Graph F1 metric between the ontology generated by OLLM (teal) and the ground truth ontology (black). The matching between nodes is shown in red, where the opacity of the edge indicates the similarity score (weaker links are more transparent). Visually, the matching defines a clear alignment of the two graphs: from the centre to the left we have the Mathematics-related concepts; at the top right we have Biology-related concepts; and at the bottom right we have Economics-related concepts.
🔼 This figure illustrates the overall pipeline of OLLM, an end-to-end ontology learning method. It begins with a dataset of documents annotated with concepts. The core component is an LLM which is trained using a custom regularizer to produce relevant subgraphs of an ontology. During inference, the model produces subgraphs for each document, which are then combined (summed) and simplified (pruned) to create the complete ontology. The final ontology is evaluated against a ground truth ontology to assess quality.
read the caption
Figure 1: OLLM: Using annotations of documents with their relevant concepts, we train an LLM to model relevant subgraphs of the target ontology with a custom regulariser. During inference, the generated subgraphs for each document are summed and pruned to give the final output ontology. For evaluation, we measure the similarity between the generated ontology and the ground truth.
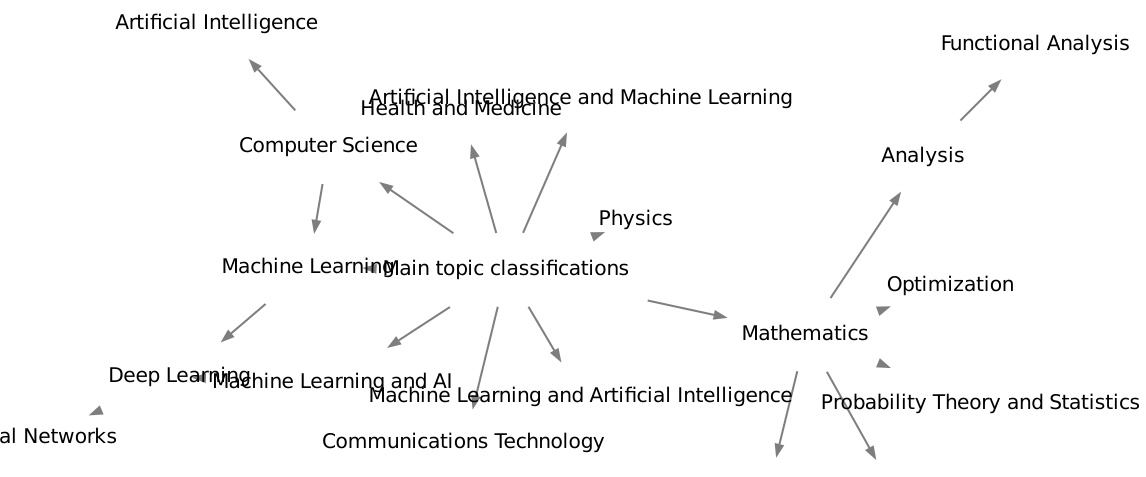
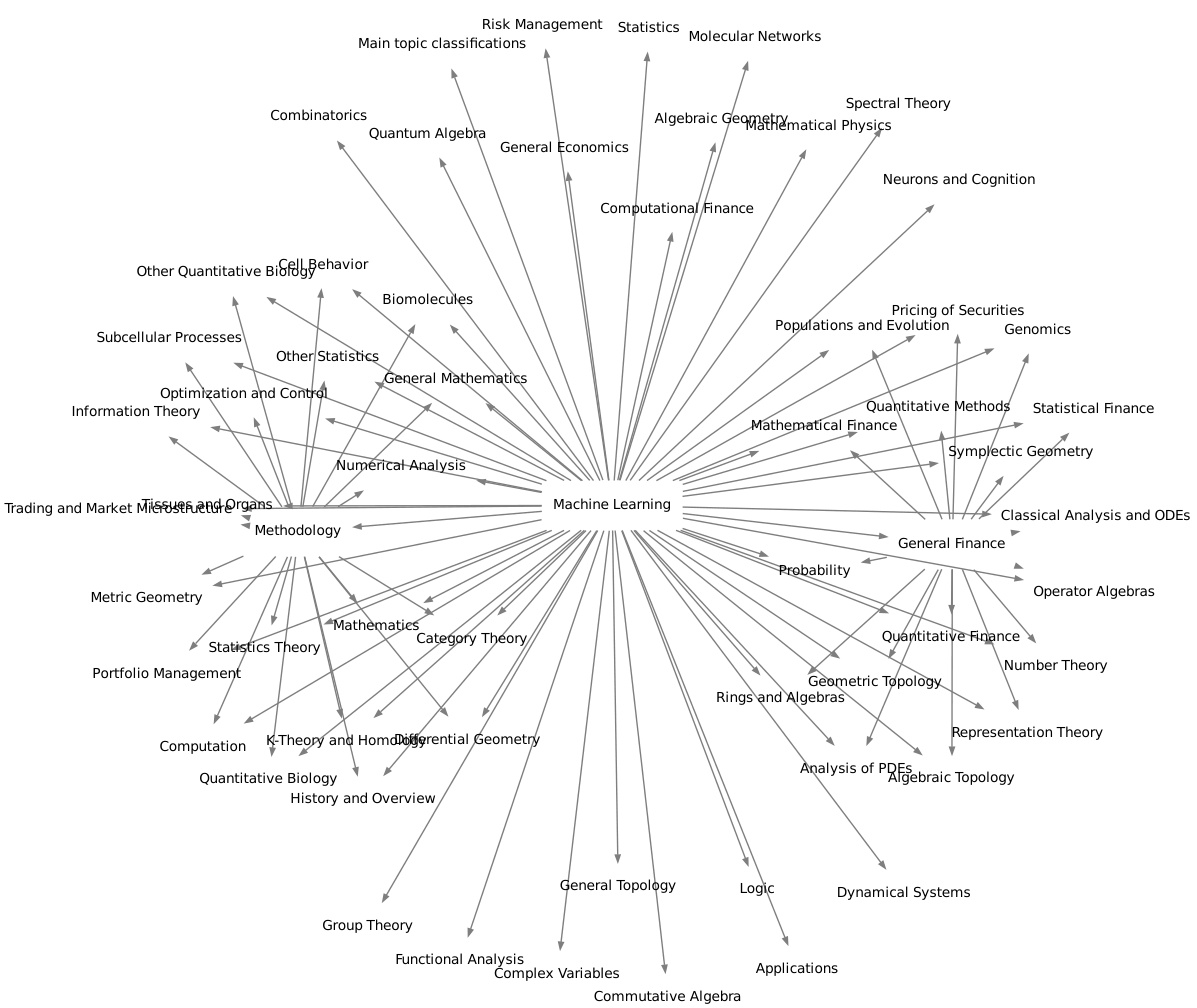
🔼 This figure visualizes sub-ontologies generated by the OLLM model for three different Wikipedia topics: Biology, Language policy, and Mathematical structures. Each sub-ontology is a subgraph of the larger Wikipedia ontology, focusing on concepts and relationships relevant to the specific topic. The visualizations highlight the hierarchical structure of the ontologies, showing how concepts are connected through taxonomic relationships. The nodes represent concepts, and the edges represent the is-a or subclass-of relationship. The figure demonstrates the model’s ability to generate semantically meaningful and structurally sound ontologies for different domains.
read the caption
Figure 11: Sub-ontologies for Wikipedia generated by OLLM, centred on various topics.

🔼 This figure visualizes sub-ontologies generated by the OLLM model for three different topics from Wikipedia: Biology, Language policy, and Mathematical structures. Each sub-ontology is a subgraph, showing a section of the broader Wikipedia category hierarchy. The nodes represent concepts, and the edges represent taxonomic relationships (e.g., is-a or subclass-of). The visualization helps to understand how OLLM structures the knowledge within each topic and connects related concepts.
read the caption
Figure 11: Sub-ontologies for Wikipedia generated by OLLM, centred on various topics.
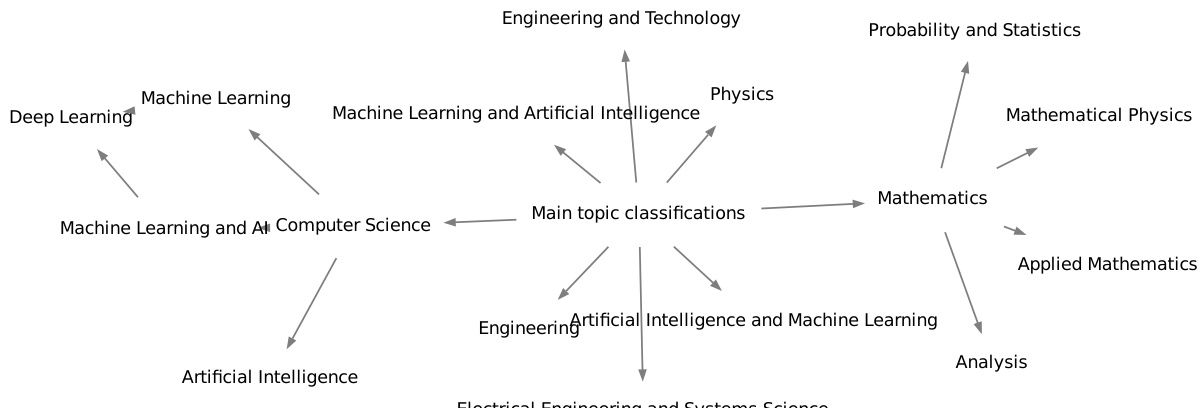
🔼 This figure shows a high-level overview of the OLLM pipeline. First, the model is trained using document annotations and a custom regularizer to learn relevant subgraphs of the ontology. During inference, subgraphs are generated for each document, combined and then pruned to produce a complete ontology. Finally, the generated ontology is evaluated by comparing it to a gold standard.
read the caption
Figure 1: OLLM: Using annotations of documents with their relevant concepts, we train an LLM to model relevant subgraphs of the target ontology with a custom regulariser. During inference, the generated subgraphs for each document are summed and pruned to give the final output ontology. For evaluation, we measure the similarity between the generated ontology and the ground truth.
More on tables

🔼 This table presents the performance of the OLLM model and several baseline methods on two datasets: Wikipedia and arXiv. The performance is measured using five metrics: Literal F1, Fuzzy F1, Continuous F1, Graph F1, and Motif Distance. Higher scores are better for all metrics except Motif Distance, where a lower score is better. The table highlights that OLLM generally outperforms the baselines, especially in terms of semantic similarity (Fuzzy F1 and Continuous F1), while maintaining competitive performance on syntactic and structural similarity. This demonstrates the effectiveness of OLLM in building accurate ontologies.
read the caption
Table 1: Evaluation metrics of OLLM and baselines on Wikipedia and arXiv. OLLM performs particularly well in modelling semantics, and remains competitive syntactically and structurally.

🔼 This table presents a comparison of the performance of OLLM and several baseline methods on two datasets: Wikipedia and arXiv. The performance is evaluated using five different metrics: Literal F1, Fuzzy F1, Continuous F1, Graph F1, and Motif Distance. Each metric assesses a different aspect of ontology quality, such as semantic similarity (Fuzzy F1) or structural similarity (Graph F1). The table highlights OLLM’s superior performance in semantic modelling, while maintaining competitive results in terms of syntax and structure.
read the caption
Table 1: Evaluation metrics of OLLM and baselines on Wikipedia and arXiv. OLLM performs particularly well in modelling semantics, and remains competitive syntactically and structurally.

🔼 This table presents the quantitative results of the experiments conducted on Wikipedia and arXiv datasets. It compares the performance of the proposed method, OLLM, against several baseline methods across five evaluation metrics: Literal F1, Fuzzy F1, Continuous F1, Graph F1, and Motif Distance. Higher scores are better for the first four metrics, while a lower score is better for Motif Distance. The results demonstrate that OLLM achieves state-of-the-art performance in terms of semantic similarity (Fuzzy F1 and Continuous F1) while maintaining relatively strong performance across other metrics.
read the caption
Table 1: Evaluation metrics of OLLM and baselines on Wikipedia and arXiv. OLLM performs particularly well in modelling semantics, and remains competitive syntactically and structurally.
Full paper#


