↗ OpenReview ↗ NeurIPS Homepage ↗ Hugging Face ↗ Chat
TL;DR#
Decoding speech from brain signals using less invasive methods like intracranial stereo-electroencephalography (sEEG) is challenging due to the desynchronized nature of brain activity across regions. Existing methods either pre-train models on whole brain-level tokens, ignoring regional differences, or use channel-level tokens without testing on complex tasks like speech decoding. This paper addresses these issues by developing a new model named Du-IN.
Du-IN employs discrete codex-guided mask modeling to extract contextual embeddings based on region-level tokens from language-related brain networks. This approach proves superior, achieving state-of-the-art results on a 61-word classification task using a newly collected Chinese word-reading sEEG dataset. The model’s success highlights the importance of region-specific processing in decoding speech and showcases the potential of neuro-inspired AI in brain-computer interfaces. The paper’s findings have significant implications for less invasive BCI development.
Key Takeaways#
Why does it matter?#
This paper is crucial for researchers in brain-computer interfaces and speech decoding due to its novel approach of using discrete units-guided mask modeling on region-level tokens extracted from sEEG signals. It advances the feasibility of less invasive BCIs for speech decoding, improving performance and opens new avenues for neuro-inspired AI approaches. The publicly available code and dataset further enhance the research’s reproducibility and impact.
Visual Insights#

This figure provides a visual overview of the study’s experimental setup. The left side depicts the process: a subject reads words displayed on a screen, while their intracranial sEEG signals are recorded. This data is then input into the Du-IN model, which performs a 61-word classification task. The right side shows a radar chart comparing the performance of Du-IN against other state-of-the-art (SOTA) baseline methods across 12 subjects. Each point on the radar chart represents a subject, and the distance from the center indicates the model’s accuracy for that subject. This visualization highlights Du-IN’s superior performance compared to existing methods.

This table presents the performance comparison of the Du-IN model with and without electrode selection. The results show a significant improvement in accuracy when using a reduced set of selected electrodes (12.25 on average), compared to using all electrodes (109.75 on average). This highlights the effectiveness of focusing on specific brain regions relevant to speech production for enhanced decoding performance.
In-depth insights#
sEEG Speech Decoding#
sEEG (intracranial stereo-electroencephalography) speech decoding represents a significant advancement in brain-computer interfaces (BCIs). Unlike less precise non-invasive methods, sEEG provides higher-quality recordings with a better signal-to-noise ratio, allowing for more accurate decoding of neural signals associated with speech production. The technique holds immense potential for individuals with severe communication impairments caused by neurological conditions such as ALS or locked-in syndrome. However, the invasive nature of sEEG necessitates careful consideration of ethical implications, and further research is required to refine model architectures, explore appropriate data augmentation strategies, and address the challenge of generalizing these models across different subjects and speech contexts. Self-supervised learning techniques, such as masked sEEG modeling, appear promising for improving efficiency and effectiveness of decoding, especially given the limited availability of labeled sEEG data for training. Ultimately, the success of sEEG speech decoding hinges on the ability to develop robust and generalizable models capable of extracting meaningful information from these highly complex neural signals.
Du-IN Model Design#
The Du-IN model is a novel framework for decoding speech from intracranial neural signals, particularly sEEG. Its discrete codex-guided mask modeling approach is a key innovation, representing a significant departure from existing methods which often pre-train on brain-level or channel-level tokens. Du-IN leverages region-level tokens extracted from language-related brain areas (vSMC and STG) via a spatial encoder and 1D depthwise convolution, capturing both temporal dynamics and spatial relationships more effectively. The use of a self-supervised pre-training stage, employing a vector-quantized variational autoencoder (VQ-VAE) and a masked autoencoder (MAE), is crucial for learning robust contextual representations. This two-stage process maximizes label efficiency and enables effective feature extraction from limited labeled data. The model’s design directly addresses the desynchronization inherent in brain activity during tasks, resulting in state-of-the-art performance in speech decoding.
Region-Level Tokens#
The concept of “Region-Level Tokens” in decoding speech from intracranial neural signals offers a significant advancement over traditional methods. Instead of treating the entire brain’s activity as a single unit (brain-level tokens) or focusing solely on individual channels (channel-level tokens), region-level tokens leverage the inherent spatial organization of the brain. This approach acknowledges that different brain regions contribute distinctly to specific cognitive functions like speech, leading to desynchronized activity patterns. By segmenting the brain into functionally relevant regions and representing each region’s activity as a token, the model captures richer, more nuanced information. This approach also improves data efficiency, as it reduces the dimensionality of the input data while retaining crucial spatial context. Self-supervision techniques, such as masked modeling, further refine these representations, helping the model learn contextual relationships within and across different brain regions. This ultimately leads to improved performance in speech decoding, showcasing the effectiveness of incorporating neuroscientific principles into AI models. The focus on specific regions enhances the model’s ability to isolate and leverage the most relevant information for the task.
Self-Supervised Learning#
Self-supervised learning (SSL) in the context of brain-computer interfaces (BCIs) is a powerful technique for leveraging abundant unlabeled neural data to learn meaningful representations. The core idea is to pre-train models on a large dataset of brain recordings without explicit labels, forcing the model to discover inherent structure and patterns. This contrasts with traditional supervised learning, which requires meticulously labeled data, a resource often scarce and expensive to obtain in BCI research. Successful SSL methods in BCIs often employ techniques like masked autoencoding, where parts of the neural signal are masked and the model learns to reconstruct the missing parts. This approach encourages the model to learn robust representations that capture the underlying dynamics of brain activity. However, the choice of masking strategy is crucial and requires careful consideration to optimize model performance. Another challenge lies in determining the appropriate spatial and temporal scales at which to model the brain activity. Different SSL techniques might focus on channel-level tokens or brain-region level tokens, each offering different tradeoffs. The ultimate goal of SSL in BCIs is to improve the performance of downstream tasks such as speech decoding, motor imagery classification, or other cognitive state recognition. Further research should focus on developing more sophisticated masking strategies, exploring the optimal architecture of self-supervised models for BCI, and benchmarking them on a wide range of challenging tasks.
sEEG Data Limitations#
sEEG data limitations are a significant hurdle in advancing brain-computer interface (BCI) research for speech decoding. The invasive nature of sEEG, while offering higher signal quality than non-invasive methods like EEG, also presents challenges. Limited availability of publicly accessible datasets is a major constraint, hindering the development and validation of new models. The spatial and temporal resolution of sEEG, though high, still limits the precision of signal capture, especially concerning the rapid dynamics of brain activity during speech production. Variability in electrode placement and the number of channels across subjects poses another obstacle; inconsistent data acquisition makes it difficult to generalize model findings. Moreover, the need for extensive preprocessing to remove noise and artifacts, along with issues of individual differences in neural signal patterns, further complicates analysis. Finally, ethical considerations, especially around subject recruitment and data privacy, create an additional layer of complexity.
More visual insights#
More on figures

The figure shows the architecture of the Du-IN Encoder, a core component of the Du-IN model for decoding speech from intracranial neural signals. The encoder takes raw sEEG signals as input and processes them through a spatial encoder (fusing channels within brain regions), temporal embedding (adding positional information), and a transformer encoder (capturing temporal relationships). The output is a sequence of contextual embeddings used for downstream tasks. The figure highlights the stages of patch segmentation, spatial encoding (using linear projection and convolution layers), temporal embedding, and the multi-layered transformer encoder.

This figure shows the architecture of the Du-IN VQ-VAE and Du-IN MAE models used for pre-training the Du-IN model. The Du-IN VQ-VAE model is used to discretize sEEG signals into discrete neural tokens by reconstructing the original sEEG signals. The Du-IN MAE model is used to predict masked tokens from visible patches, which helps the model learn contextual representations. Both models utilize the Du-IN encoder, which extracts contextual embeddings based on region-level tokens through discrete codex-guided mask modeling.

This figure shows the results of an analysis performed to determine the contribution of each channel to the overall decoding performance. Panel (a) is a brain map visualizing the contribution scores of different channels, with hotter colors indicating higher contribution. Panel (b) shows a graph plotting the decoding accuracy against the number of channels used, demonstrating the impact of channel selection on model performance. This analysis highlights that only a subset of channels, primarily located in specific brain regions relevant to speech production, are crucial for high decoding accuracy. The findings underscore the localized nature of brain activity related to speech.

This figure provides a visual overview of the experimental setup used for decoding speech from intracranial neural signals recorded via stereo-electroencephalography (sEEG). The left side shows the overall process, from sEEG recordings to the 61-word classification task. The right side presents a comparison of the Du-IN model’s performance against several state-of-the-art (SOTA) baseline methods on the same classification task. The radar chart visually represents the relative performance of each model across different subjects.

This figure shows a schematic of the sEEG decoding setup used in the study. It compares the performance of the proposed Du-IN model against several state-of-the-art (SOTA) baselines on a 61-word classification task using intracranial neural signals. The visual representation highlights the superior performance of Du-IN compared to other methods. The figure includes a visualization of the sEEG data, the Du-IN model, and the performance of various models, showing probability scores for different words.

This figure visualizes the vector-quantized sEEG regression process. Panel (a) shows the reconstruction loss curve during the training of the Du-IN VQ-VAE model. It demonstrates a decrease in loss over epochs, indicating successful learning. Panel (b) compares original and reconstructed sEEG signals, showing that the model can effectively reconstruct the signals while capturing major trends, even though fine details might be missing.

This figure provides a visual summary of the study’s experimental setup and results. The left panel shows a diagram of the intracranial stereo-electroencephalography (sEEG) recordings setup, used for decoding speech from brain signals. The right panel presents a comparison of the model’s performance against state-of-the-art (SOTA) baselines. The figure highlights the superior performance of the proposed Du-IN model in a 61-word classification task.

This figure provides a visual overview of the experimental setup for decoding speech from intracranial neural signals using sEEG. It shows the sEEG recordings being processed by the Du-IN model, and a comparison of its performance against other state-of-the-art (SOTA) baselines on a 61-word classification task. The comparison highlights the Du-IN model’s superior performance. The visual representation includes a schematic of the sEEG recording setup and a polar plot comparing the accuracy of different models for each subject.

This figure provides a visual overview of the study’s experimental setup for decoding speech from intracranial neural signals using stereo-electroencephalography (sEEG). The left side shows a schematic of the sEEG recording setup. The right side displays a comparison of the Du-IN model’s performance against several state-of-the-art (SOTA) baseline models on a 61-word classification task. The polar plot visually represents the classification accuracy of different models for each subject, highlighting the superior performance of the Du-IN model.
This figure shows a schematic of the sEEG decoding setup used in the study. It also presents a comparison of the proposed Du-IN model’s performance against other state-of-the-art (SOTA) baselines on a 61-word classification task using sEEG recordings. The left side illustrates the process: sEEG recordings are used as input, processed by the Du-IN model, and result in a word classification. The right side is a radar chart comparing the accuracy of the Du-IN model against several baselines across different subjects. The chart visually demonstrates that Du-IN outperforms the other models.
This figure provides a visual overview of the study’s experimental setup. The left panel shows the overall sEEG decoding setup, illustrating how sEEG recordings are collected, processed, and used to perform word classification. The right panel presents a comparison of the proposed Du-IN model’s performance against several state-of-the-art (SOTA) baselines on a 61-word classification task. The radar chart visually represents the performance of each model for each subject, highlighting the superior accuracy of Du-IN across various subjects.
This figure shows a schematic of the sEEG decoding setup used in the study. It depicts sEEG recordings being fed into the Du-IN model for speech decoding. The figure also provides a comparison of the Du-IN model’s performance against other state-of-the-art (SOTA) baselines on a 61-word classification task, visually representing the superior performance of the Du-IN model.

The figure shows a schematic diagram of the sEEG decoding setup. The left side depicts the sEEG recordings from the subject during a 61-word classification task, which are then inputted into the Du-IN model for decoding. The right side presents a comparison of the Du-IN model’s performance against state-of-the-art (SOTA) baselines using a polar plot. The plot visualizes the accuracy of different models for each subject, demonstrating the superior performance of the Du-IN model.

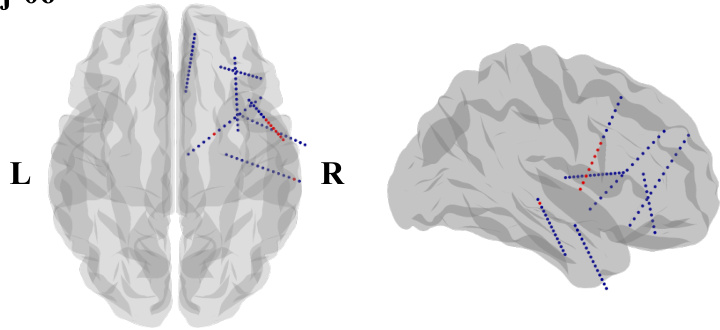
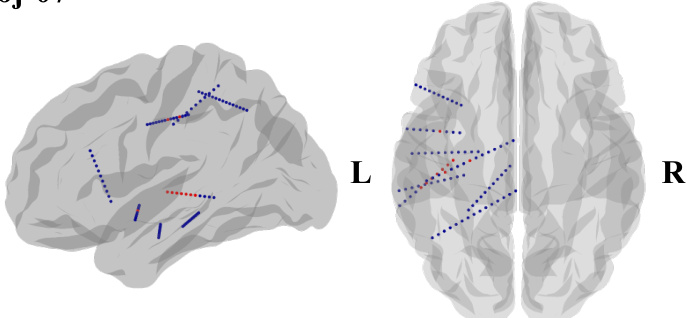
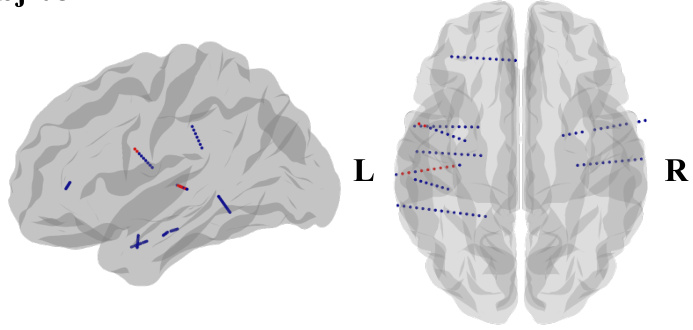
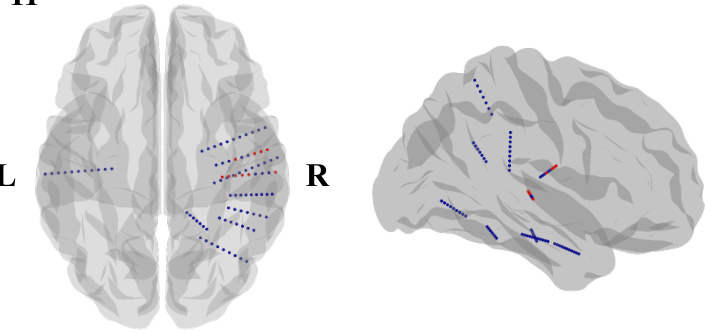
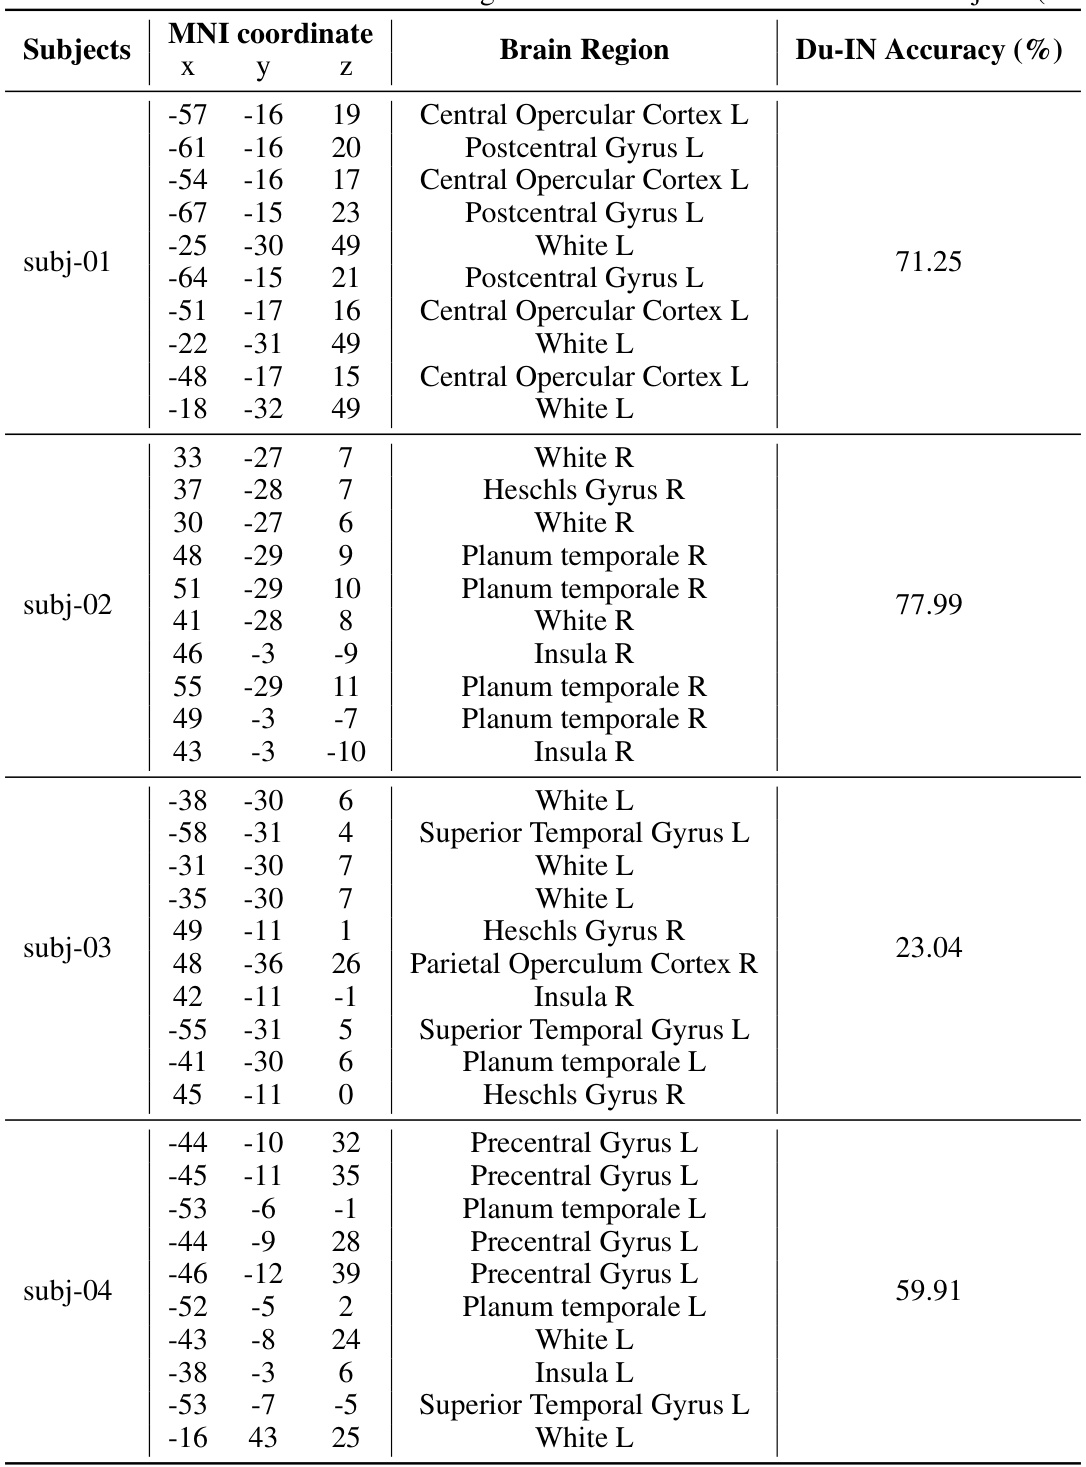
This figure shows the locations of implanted sEEG electrodes for four subjects (subj-01 to subj-04). Red channels represent the top 10 channels selected based on their contribution to speech decoding performance. The figure uses side views of the brain to show electrode placement, as many subjects had electrodes implanted primarily on one side of the brain to target epilepsy sources.
This figure provides a visual overview of the study’s setup for decoding speech from intracranial neural signals using stereo-electroencephalography (sEEG). It shows the overall workflow, including sEEG recordings, the Du-IN model, and a comparison of its performance against state-of-the-art (SOTA) baselines on a 61-word classification task. The figure helps to illustrate the model’s architecture and its superior performance in decoding speech from sEEG data.
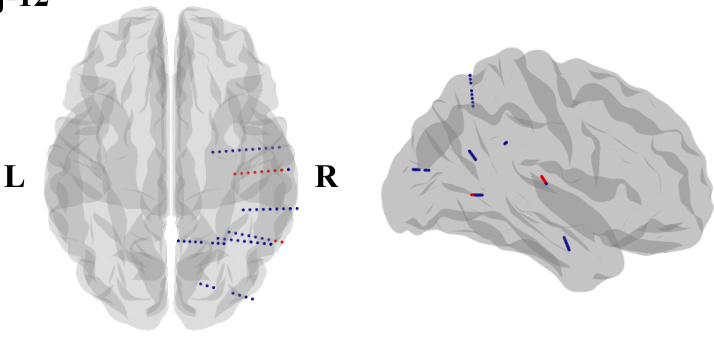
This figure shows a comparison of the proposed Du-IN model’s performance against other state-of-the-art (SOTA) baselines for decoding speech from intracranial neural signals. It provides a visual representation of the sEEG decoding setup, illustrating the process of recording signals and classifying words. The comparison with SOTA baselines highlights the superior performance of the Du-IN model in a 61-word classification task.
More on tables

This table presents the results of the Du-IN model and several advanced baselines designed for either brain signals or general time series. It shows the token level used (region or channel), whether the model was pre-trained (PT), whether pre-training was done across multiple subjects (MS), the model size, and the accuracy with standard error. The table allows for comparison of different approaches to sEEG speech decoding, highlighting the superior performance of Du-IN.

This table presents the ablation study comparing the performance of the Du-IN (mae) model trained with and without the downstream dataset. It shows how including the downstream dataset in pre-training improves the accuracy of speech decoding.

This table presents the results of the Du-IN model and several advanced baseline models designed for either brain signals or general time series. It compares the accuracy of different models on a 61-word speech decoding task using intracranial stereo-electroencephalography (sEEG) data. The models are categorized by their approach to tokenization (region-level or channel-level), pre-training method (if any), and model size. The table highlights the superior performance of the Du-IN model, surpassing all baselines.

This table lists the hyperparameters used during the training of the Du-IN VQ-VAE model. It provides details for each module, including the Du-IN Encoder, Vector Quantizer, and Du-IN Regressor. Specific hyperparameters are listed, such as the number of layers, hidden sizes, kernel sizes, dropout ratios, learning rates, optimizers, and more. These values are critical for reproducing the results reported in the paper.

This table compares the performance of Du-IN against several state-of-the-art (SOTA) baselines on a 61-word speech decoding task using intracranial neural signals. It shows the accuracy achieved by each method, along with details like model size, whether the model was pre-trained, and whether it was pre-trained across multiple subjects. The results highlight Du-IN’s superior performance, especially when compared to methods that utilize channel-level tokens instead of region-level tokens.

This table lists the hyperparameters used for training the Du-IN CLS model. It specifies values for various settings related to the Label Prediction Head (including a Flatten layer and a linear projection) and the Optimizer (including batch size, learning rate, scheduler, type, Adam beta parameters, weight decay, total epochs, and warm-up epochs).

This table presents the mean squared error (MSE) results of three different settings for reconstructing neural signals using the Du-IN VQ-VAE model. Setting 1 uses the top 10 channels most relevant to speech decoding. Setting 2 randomly selects 10 channels. Setting 3 uses all channels. The results demonstrate the impact of selecting region-specific channels for accurate signal reconstruction.
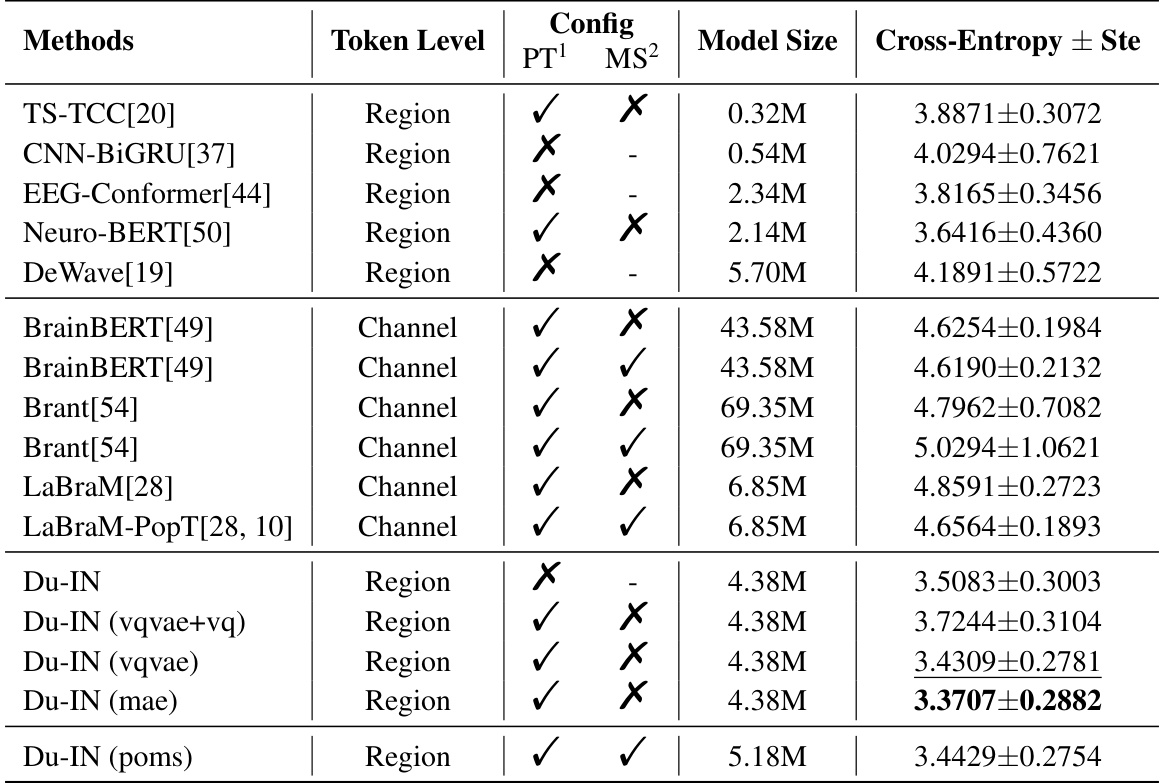
This table presents the cross-entropy loss for various speech decoding methods. It compares the performance of different models, indicating whether they were pre-trained (PT) and whether the pre-training was performed across multiple subjects (MS). The token level (Region or Channel) and model size are also shown. Lower cross-entropy values indicate better performance.

This table presents the subject-wise accuracy of different speech decoding methods. It shows the performance (accuracy and standard deviation) for each of four subjects (subj-01 to subj-04) across several methods. The methods include various baseline models and the proposed Du-IN model with different pre-training configurations. The table allows for a comparison of the effectiveness of the different methods on individual subjects, revealing potential variations in performance due to individual biological differences.

This table presents the results of various speech decoding methods (TS-TCC, CNN-BiGRU, EEG-Conformer, Neuro-BERT, DeWave, BrainBERT, Brant, LaBraM, LaBraM-PopT, and Du-IN with various configurations) evaluated on subjects 05 through 08. The results are presented as accuracy with standard deviation, indicating the performance variability of each model across different subjects. PT and MS columns specify whether the model was pre-trained before evaluation and whether it was pre-trained across multiple subjects, respectively.
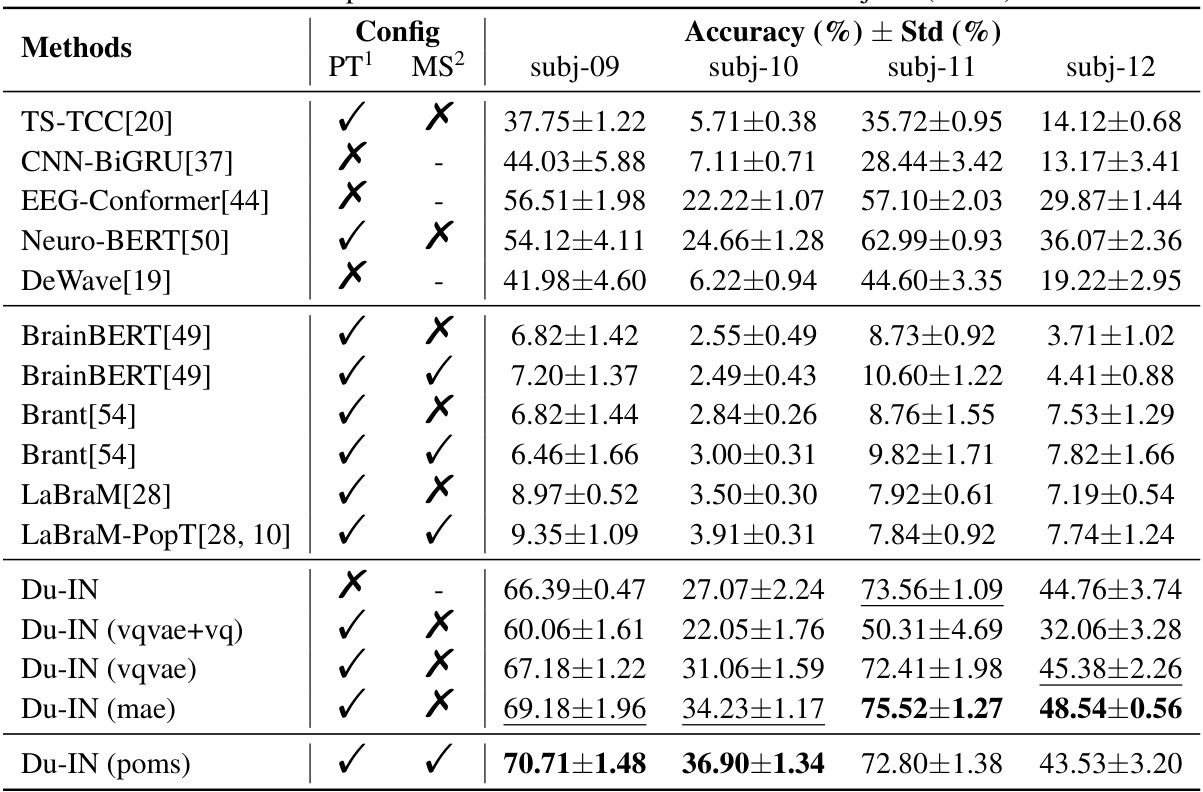
This table presents the results of the Du-IN model and advanced baselines designed for either brain signals or general time series. It compares the accuracy of various methods for a 61-word speech decoding task using sEEG data. The table shows model size, whether the model was pre-trained, whether pre-training was done across multiple subjects, the token level used (region or channel), and the accuracy achieved. The results demonstrate that Du-IN outperforms all baselines.

This table presents the ablation study results on the effectiveness of vector-quantized neural signal prediction. It compares three different model settings: the Du-IN (mae) model, Setting 1 (directly predicting output embeddings of the Du-IN Encoder), and Setting 2 (directly reconstructing raw EEG patches without the encoder). The accuracy (with standard error) is reported for each setting, demonstrating the contribution of vector quantization.

This table compares the performance of the Du-IN model with other state-of-the-art (SOTA) methods on a 61-word classification task using sEEG data. It shows the accuracy of each model, indicating the effectiveness of the Du-IN approach. Various model characteristics are included to help understand performance differences; including whether the model uses region-level or channel-level tokens, whether it is pre-trained, and the model’s size in terms of parameters.

This table presents the ablation study on the number of pre-training epochs for the Du-IN VQ-VAE model. The accuracy with standard error is shown for different numbers of epochs (5, 10, 50, 100, and 400). The results demonstrate the impact of the number of epochs on the final model performance after subsequent fine-tuning of the Du-IN MAE model.

This table compares the performance of the Du-IN model against several other state-of-the-art (SOTA) baselines on a 61-word speech decoding task using intracranial neural signals. It shows the accuracy of each model, along with details such as whether the model was pre-trained and whether the training was done across multiple subjects. The table highlights Du-IN’s superior performance.
This table compares the performance of the Du-IN model against several other state-of-the-art (SOTA) baselines on a 61-word speech decoding task using sEEG data. It shows the accuracy of each model, along with details about whether they used pre-training (PT), multi-subject pre-training (MS), the type of token-level used (Region or Channel), and the model size. The results demonstrate that Du-IN significantly outperforms all baselines, highlighting its effectiveness in decoding speech from sEEG signals.
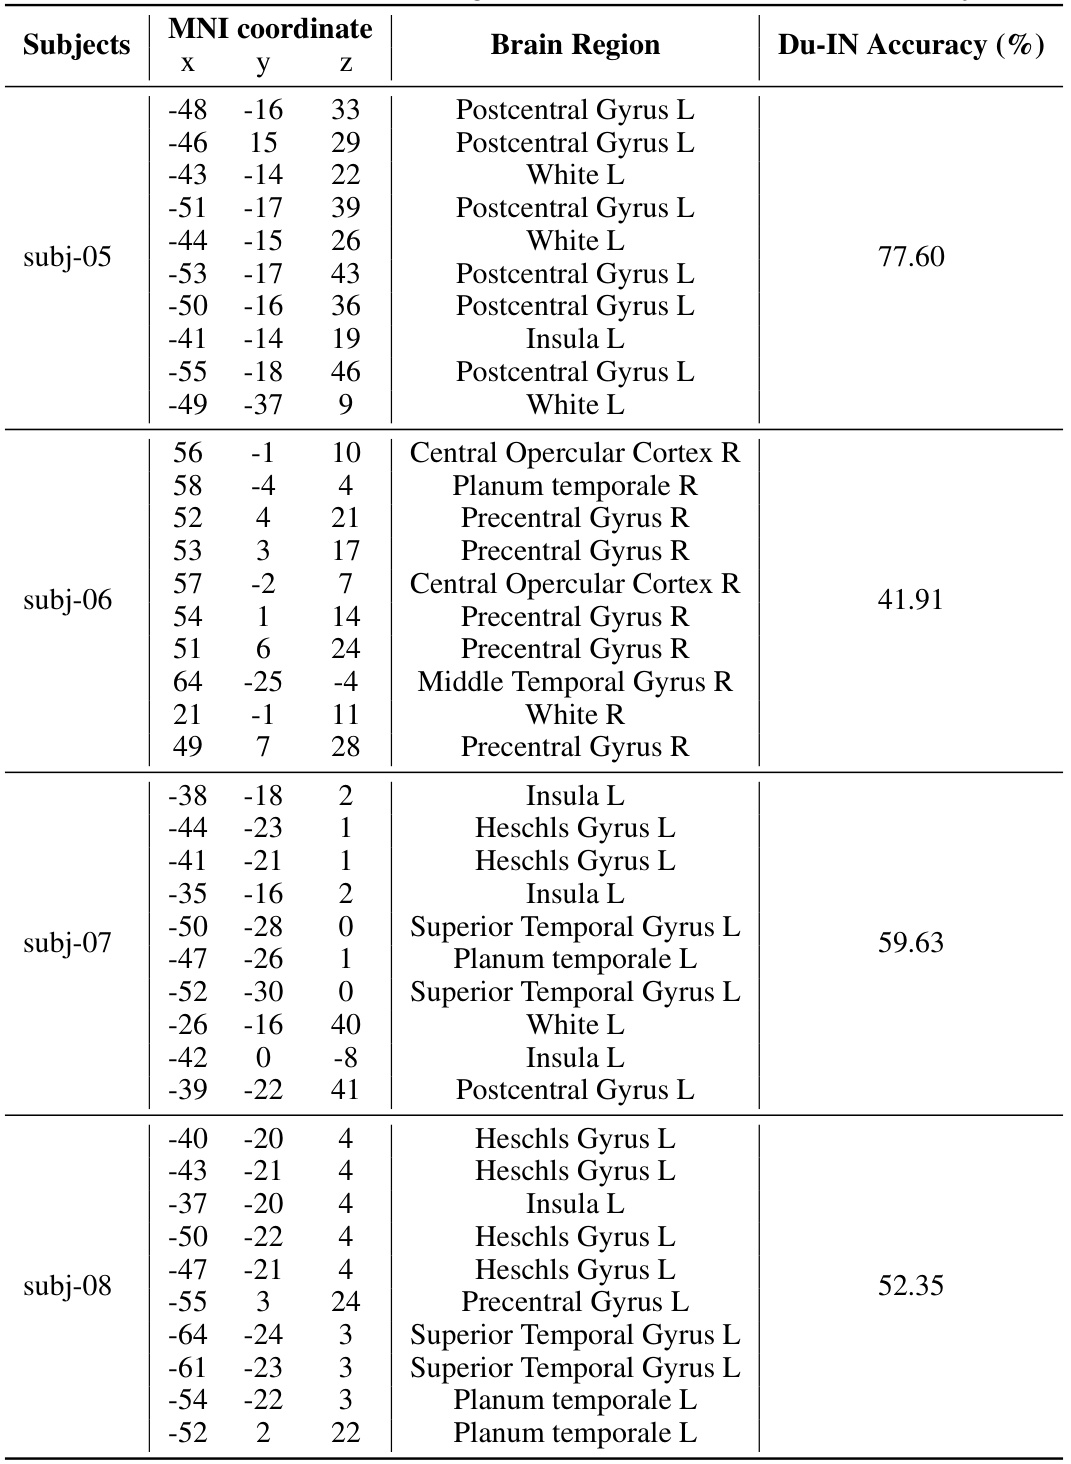
This table presents a comparison of the Du-IN model’s performance against several other state-of-the-art (SOTA) baselines on a 61-word speech decoding task using sEEG data. It shows the accuracy and standard error for each model, indicating whether the model was pre-trained before evaluation and across multiple subjects. The table highlights Du-IN’s superior performance compared to other methods, particularly those based on channel-level tokens instead of region-level tokens.
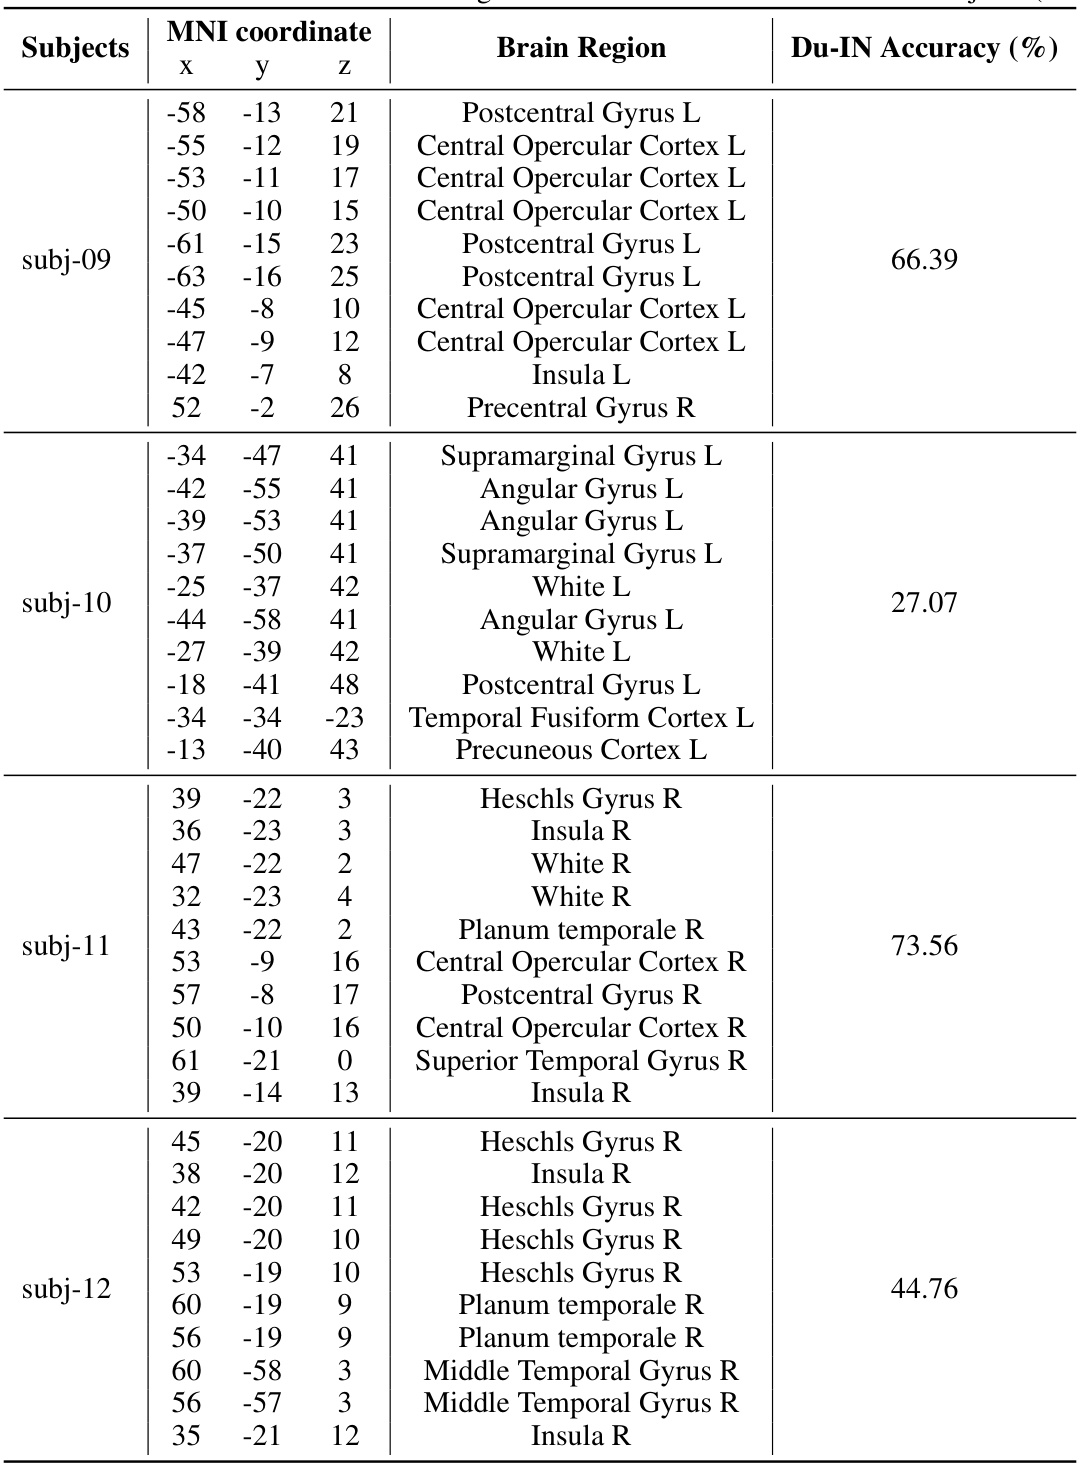
This table presents the results of the Du-IN model and advanced baselines designed for either brain signals or general time series. It shows the token level (region or channel), whether the model was pre-trained, whether it was pre-trained across multiple subjects, model size, and accuracy with standard error for each model. The results demonstrate that the Du-IN model outperforms all baselines.
Full paper#


