TL;DR#
Temporal knowledge graphs (TKGs) model time-evolving relationships between entities, vital for event prediction. Existing TKG representation learning methods, however, fall short in capturing the complex temporal evolution of high-order correlations (i.e., simultaneous relationships among multiple entities). This limitation restricts their ability to accurately predict future events and understand dynamic knowledge evolution.
To address this, the authors propose DECRL, a deep evolutionary clustering approach. DECRL integrates a deep evolutionary clustering module to effectively capture the dynamic nature of these high-order correlations and maintain temporal smoothness. It incorporates a cluster-aware unsupervised alignment mechanism to ensure precise cluster alignment across different timestamps, and an implicit correlation encoder to model the latent connections between clusters. Extensive experiments on various real-world datasets demonstrate that DECRL significantly outperforms state-of-the-art baselines, achieving considerable improvements in event prediction accuracy.
Key Takeaways#
Why does it matter?#
This paper is crucial because it addresses the limitations of existing temporal knowledge graph (TKG) representation learning methods that struggle to capture the temporal evolution of high-order correlations. By introducing a novel deep evolutionary clustering approach, it achieves state-of-the-art performance and opens new avenues for research in dynamic knowledge graph representation learning. This is relevant to researchers working on event prediction, knowledge evolution, and complex temporal data analysis.
Visual Insights#

🔼 The figure illustrates the framework of the proposed DECRL approach. At each timestamp, entity and relation representations are updated by the cluster graph message passing module and merged with input representations from the previous timestamp using a time residual gate. These updated representations are then input to a relation-aware GCN to model multi-relational interactions among entities. A deep evolutionary clustering module captures the temporal evolution of high-order correlations among entities, maintaining temporal smoothness through an unsupervised alignment mechanism. An implicit correlation encoder captures latent correlations between clusters, and an attentive temporal encoder captures temporal dependencies among entity and relation representations across timestamps, integrating them for future event prediction. The figure visually depicts the flow of information and the interactions between the various modules of the DECRL model.
read the caption
Figure 1: The framework of DECRL.

🔼 This table presents a comparison of the performance of the proposed DECRL model against 12 other state-of-the-art (SOTA) Temporal Knowledge Graph (TKG) representation learning approaches on two datasets: ICEWS14 and ICEWS14C. The metrics used for comparison are Mean Reciprocal Rank (MRR) and Hits@1, Hits@3, and Hits@10. The table shows that DECRL outperforms all other methods across all metrics on both datasets.
read the caption
Table 1: The performance of DECRL and the compared approaches on ICEWS14 and ICEWS14C
In-depth insights#
Temporal Correlation#
Analyzing temporal correlations within knowledge graphs is crucial for understanding dynamic systems. Temporal knowledge graph representation learning focuses on capturing how entities and their relationships evolve over time. A key challenge lies in effectively modeling high-order temporal correlations, which describe the simultaneous relationships among multiple entities at different timestamps. Simple pairwise models are insufficient; capturing the complex interactions necessitates advanced techniques. Deep evolutionary clustering shows promise for capturing these complex dynamics. By identifying clusters of entities that evolve together, it can uncover latent patterns and temporal trends otherwise missed by traditional approaches. The use of an implicit correlation encoder and unsupervised alignment mechanisms help maintain temporal smoothness and accuracy in cluster representations over time, leading to improved event prediction. Future research should focus on handling the continuous influence of high-order correlations and scaling up to extremely large datasets to further enhance predictive accuracy and uncover nuanced insights into temporal dynamics.
Deep Evolutionary Clusters#
Deep evolutionary clustering, in the context of temporal knowledge graphs, presents a powerful paradigm for capturing the dynamic evolution of high-order correlations within the data. Traditional clustering methods struggle with the inherent temporal complexity, often failing to effectively track and represent changes over time. The ‘deep’ aspect likely refers to the use of deep learning architectures, potentially neural networks, to learn intricate and high-dimensional representations of entities and relationships. This allows the algorithm to discover subtle patterns and structures not apparent through simpler techniques. The ’evolutionary’ component suggests an iterative process that adapts to changing data distributions. The model likely incorporates mechanisms for merging, splitting, or refining clusters as new information becomes available, ensuring that cluster assignments accurately reflect the evolution of relationships. This is particularly critical in temporal graphs where the meaning and importance of connections evolve alongside the data itself. The combination of deep learning and evolutionary strategies offers a robust approach capable of handling noisy data, and high dimensionality while providing a nuanced understanding of how complex interactions change over time.
Unsupervised Alignment#
The concept of ‘Unsupervised Alignment’ within the context of temporal knowledge graph representation learning is crucial for maintaining temporal coherence. It addresses the challenge of dynamic cluster evolution across different timestamps. Without this, the changing nature of clusters over time could introduce inconsistencies or abrupt shifts in entity representations, hindering the model’s ability to capture temporal dynamics. An unsupervised approach is important because manually aligning clusters would be extremely laborious and infeasible for large graphs. The method likely involves measuring similarity between clusters at consecutive time steps, and using an algorithm (possibly graph matching or optimization-based) to find the optimal one-to-one mapping that preserves temporal smoothness and avoids major structural changes. The success of this technique hinges on the robustness of the cluster representation and the effectiveness of the chosen alignment algorithm in handling noisy or partially overlapping clusters. The overall goal is to ensure that the model’s understanding of relationships between entities evolves consistently, preserving the temporal continuity inherent in the data.
Implicit Correlation#
The concept of “Implicit Correlation” in the context of temporal knowledge graph representation learning is crucial. It addresses the challenge of capturing complex, latent relationships between entities that evolve over time. Instead of explicitly modeling every connection, an implicit approach infers these correlations. This is advantageous because explicitly modeling all correlations would lead to computational intractability and data sparsity. The implicit methods often leverage techniques such as embedding spaces or graph neural networks to learn representations that encode the relationships. By learning these implicit correlations, the model can predict future events with improved accuracy as it captures the subtle dependencies not readily apparent in the raw data. The choice of method to capture implicit correlations, such as graph neural networks, impacts the computational efficiency and performance. Further research could explore various techniques to improve the effectiveness and scalability of implicit correlation modeling for complex temporal knowledge graphs.
Future Works#
The paper’s conclusion points toward several promising avenues for future research. Addressing the limitation of assuming uniform correlations across all clusters in the implicit correlation encoder is crucial. A more sophisticated, multi-relation-aware approach would provide a more nuanced representation of latent correlations between clusters. Furthermore, the current model’s focus on the previous and current timestamps for temporal evolution is overly simplistic. Future work should explore the continuous influence of high-order correlations from various past timestamps, potentially utilizing more advanced recurrent or attention mechanisms to capture these complex temporal dynamics. This would significantly enhance the model’s capacity to accurately predict future events based on richer historical contexts. Finally, extending the model’s capacity beyond event prediction to other downstream tasks within the temporal knowledge graph domain, such as link prediction and entity typing, warrants investigation. These enhancements would contribute to more robust and versatile tools for analyzing and understanding temporal knowledge graphs.
More visual insights#
More on figures

🔼 The figure illustrates the framework of the Deep Evolutionary Clustering jointed temporal knowledge graph Representation Learning approach (DECRL). At each timestamp, entity and relation representations are updated by a cluster graph message passing module and merged with input representations from the previous timestamp using a time residual gate. This serves as input for the current timestamp’s relation-aware GCN, which models multi-relational interactions. The deep evolutionary clustering module captures the temporal evolution of high-order correlations. An implicit correlation encoder captures latent correlations between clusters, enabling message passing within the cluster graph to update entity representations. Finally, an attentive temporal encoder captures temporal dependencies between timestamps, integrating temporal information for future event prediction.
read the caption
Figure 1: The framework of DECRL.

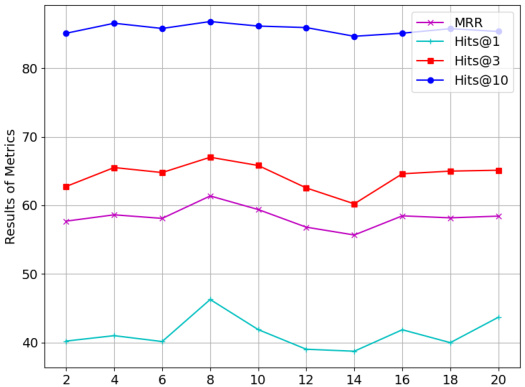
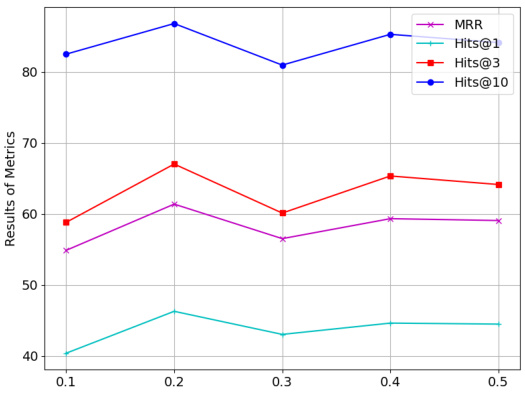
🔼 This figure shows the impact of four hyperparameters (N_historical_window, N_c, N_DECRL_layer, λ) on the performance of DECRL using the ICEWS18C dataset. Each subplot displays the MRR, Hits@1, Hits@3, and Hits@10 metrics across a range of values for each hyperparameter. The plots reveal how changes in each hyperparameter affect model performance, demonstrating the sensitivity of DECRL to the tuning of these parameters. The results show an optimal range of values for each hyperparameter that maximizes model performance.
read the caption
Figure 3: Results of hyper-parameters changes of DECRL on ICEWS18C.

🔼 This figure shows the impact of four hyperparameters (Nhistorical window, Nc, NDECRL layer, and λ) on the performance of DECRL using the ICEWS18C dataset. Each subplot displays the MRR, Hits@1, Hits@3, and Hits@10 scores across a range of values for each hyperparameter. The plots visualize how changes in these hyperparameters affect the model’s ability to accurately predict events. This allows for identifying optimal hyperparameter settings for the DECRL model.
read the caption
Figure 3: Results of hyper-parameters changes of DECRL on ICEWS18C.

🔼 This figure shows the results of hyperparameter sensitivity analysis performed on the ICEWS18C dataset. It displays the impact of varying four hyperparameters (N_historical_window, N_c, N_DECRL_layer, λ) on the performance metrics (MRR, Hits@1, Hits@3, Hits@10) of the DECRL model. Each subplot illustrates the performance trend as the value of one specific hyperparameter is adjusted, providing insights into the optimal ranges of each hyperparameter for the model.
read the caption
Figure 3: Results of hyper-parameters changes of DECRL on ICEWS18C.

🔼 This figure shows the impact of four hyperparameters on the performance of the DECRL model, specifically on the ICEWS18C dataset. The x-axis represents different values for each hyperparameter (Nhistorical window, Nc, NDECRL layer, λ). The y-axis displays the performance metrics (MRR, Hits@1, Hits@3, Hits@10). Each line represents one metric. The figure illustrates how changing the hyperparameters affects the model’s performance, indicating the optimal range or value for each hyperparameter to achieve the best results.
read the caption
Figure 3: Results of hyper-parameters changes of DECRL on ICEWS18C.
More on tables

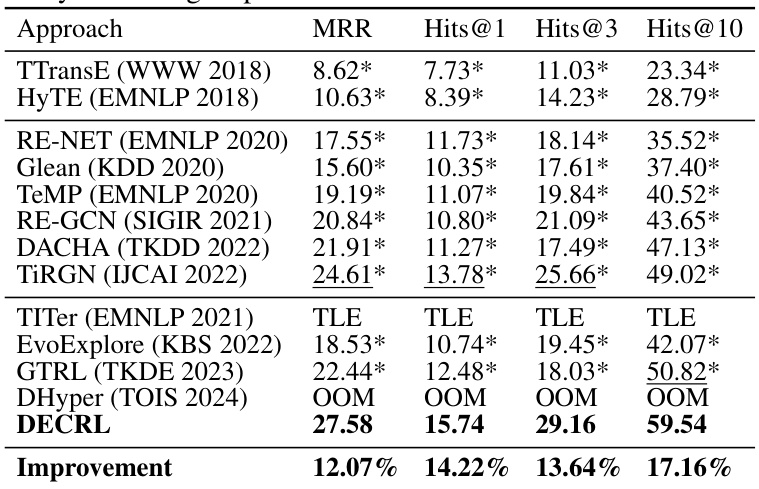
🔼 This table presents a comparison of the performance of the proposed DECRL model against 12 other state-of-the-art (SOTA) temporal knowledge graph representation learning approaches on two datasets: ICEWS18 and ICEWS18C. The metrics used for comparison include MRR (Mean Reciprocal Rank) and Hits@k (percentage of correct predictions ranked within the top k), where k is 1, 3, and 10. The results demonstrate DECRL’s superior performance in terms of average improvement across all metrics.
read the caption
Table 2: The performance of DECRL and the compared approaches on ICEWS18 and ICEWS18C

🔼 This table presents the performance comparison of DECRL against 12 state-of-the-art (SOTA) temporal knowledge graph representation learning approaches on the GDELT dataset. The metrics used for comparison are Mean Reciprocal Rank (MRR) and Hits@1, Hits@3, and Hits@10. The table shows that DECRL outperforms all other methods, achieving significantly higher scores across all metrics. Note that some baselines exceeded the time limit or ran out of memory, as indicated by ‘TLE’ and ‘OOM’, respectively.
read the caption
Table 3: The performance of DECRL and the compared approaches on GDELT. “OOM” and “TLE” indicate out of memory and a single epoch exceeded 24 hours

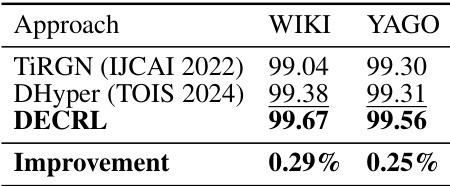
🔼 This table compares the performance of the DECRL model with other state-of-the-art (SOTA) models on the WIKI and YAGO datasets, using the Mean Reciprocal Rank (MRR) metric. It shows DECRL outperforms the best baseline by 0.29% on WIKI and 0.25% on YAGO, highlighting its effectiveness.
read the caption
Table 4: The performance of DECRL and the compared approaches on WIKI and YAGO with MRR

🔼 This table presents the results of an ablation study conducted on the ICEWS14 dataset to analyze the contribution of each module within the DECRL model. The table shows the performance of DECRL and several variants, each removing a key component like the unsupervised alignment mechanism, the fusion operation, the implicit correlation encoder, the global graph guidance, or the temporal smoothness loss. The results are presented in terms of MRR and Hits@1/3/10, showing the impact of each removed component on the overall performance. The numbers in parentheses indicate the percentage decrease in performance compared to the full DECRL model.
read the caption
Table 5: The performance of DECRL and the variants on ICEWS14

🔼 This table presents the characteristics of the seven real-world datasets used in the paper’s experiments. For each dataset, it lists the number of entities, the number of relations, the size of the training, validation, and test sets, and the time interval covered by the data.
read the caption
Table 6: The statistics of datasets

🔼 This table shows the optimal hyperparameter settings for the DECRL model, determined through experiments on seven different datasets. The hyperparameters include the number of clusters (Nc), the number of layers in the deep evolutionary clustering module (NDECRL_layer), the length of the historical window considered for temporal information (Nhistorical_window), and the hyperparameter balancing the tradeoff between event prediction and temporal smoothness (λ). The table demonstrates that optimal hyperparameter choices vary depending on the specific dataset used.
read the caption
Table 7: The final choices of hyper-parameter values

🔼 This table compares the performance of DECRL with 12 other state-of-the-art (SOTA) approaches on the GDELT dataset for entity prediction. It shows the MRR (Mean Reciprocal Rank) and Hits@k (percentage of correct predictions within top k) metrics. The results demonstrate that DECRL outperforms all other methods, with statistically significant improvements indicated by asterisks (*). OOM and TLE indicate instances where the other methods failed due to running out of memory or exceeding the time limit.
read the caption
Table 8: The entity prediction performance of DECRL and the compared approaches on GDELT. “OOM” and “TLE” indicate out of memory and a single epoch exceeded 24 hours. * indicates that DECRL is statistically superior to the compared approaches according to pairwise t-test at a 95% significance level. The best results are in bold and the second best results are underlined

🔼 This table compares the top 5 relations predicted by three different models: TiRGN, DHyper, and DECRL for two sample events from the ICEWS14C dataset. The events relate to the Russia-Ukraine conflict in 2014. The table showcases the models’ predictions for the relations between specific entities and highlights the differences in their reasoning and predictive capabilities for temporal knowledge graph reasoning.
read the caption
Table 9: Top 5 relations predicted by TiRGN, DHyper, and DECRL
Full paper#


