↗ OpenReview ↗ NeurIPS Homepage ↗ Chat
TL;DR#
Many machine learning applications encounter datasets with uncertainties due to missing values, errors, or inconsistencies. These uncertainties affect model reliability and prediction accuracy, raising concerns about the trustworthiness of AI systems. Existing methods often fail to address these issues comprehensively, leading to unreliable models and predictions.
This paper introduces ZORRO, a novel method that leverages abstract interpretation and zonotopes to manage data uncertainty. ZORRO compactly represents all possible dataset variations, enabling simultaneous symbolic execution of gradient descent. It provides sound over-approximations of all possible optimal models and prediction intervals, offering a robust and reliable framework for predictive modeling and statistical inference in scenarios with data uncertainties. The efficacy of ZORRO is demonstrated through rigorous theoretical analysis and empirical evaluations, showcasing its superior performance over existing methods.
Key Takeaways#
Why does it matter?#
This paper is crucial for researchers dealing with uncertain data, a prevalent issue in many fields. It offers a novel approach to model uncertainty that is both theoretically sound and practically useful, particularly in applications requiring high reliability and robustness, such as medical diagnosis or autonomous driving. The framework enables reasoning about the impact of data uncertainty on model parameters and predictions, opening avenues for improving model robustness and enhancing trust in AI systems.
Visual Insights#

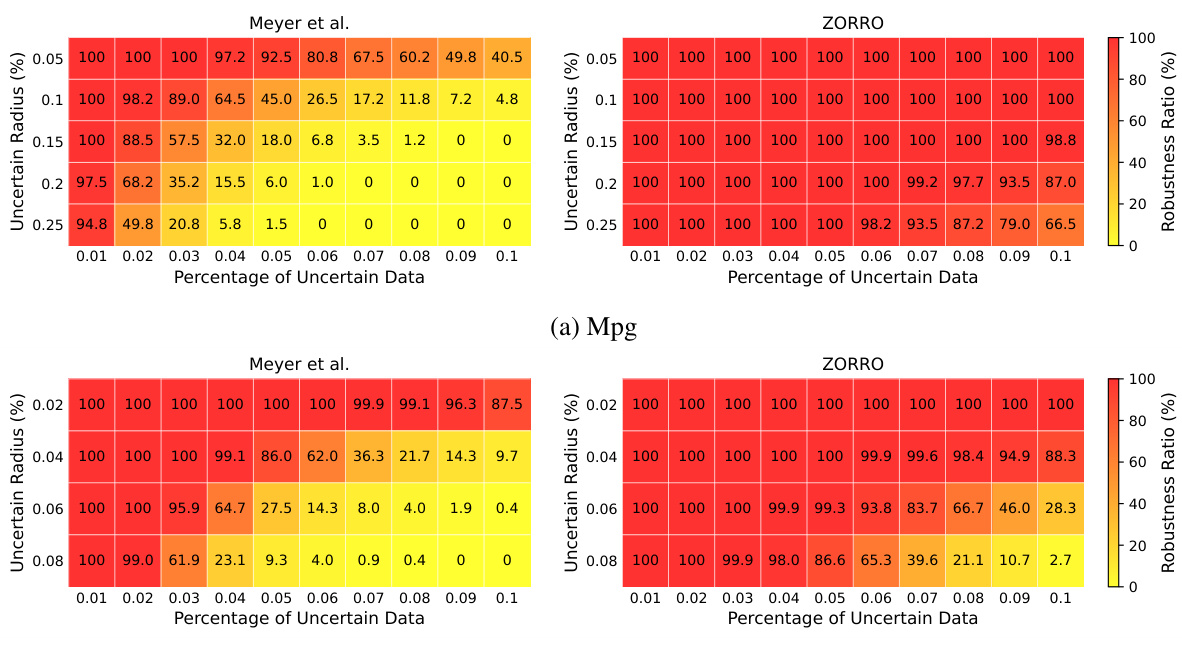
This figure compares the robustness verification results of the proposed method (ZORRO) and Meyer et al.’s method (MEYER) across different uncertainty levels in training datasets. Robustness is measured as the fraction of test data points with prediction intervals smaller than a specified threshold. The results show that ZORRO consistently achieves higher robustness ratios than Meyer et al. across various uncertain data percentages and uncertainty radii, especially for higher uncertainty settings. The plots demonstrate ZORRO’s improved ability to certify model robustness in the presence of uncertainty in both training labels and features.

This table presents the results of a robustness verification experiment comparing four different methods: kNN imputation with k=5, kNN imputation with k=10, multiple imputation, and the proposed ZORRO method. The experiment varies the uncertainty radius (percentage of instances with uncertain features/labels) and measures the percentage of test data points for which each method provides robust predictions (within a specified threshold). It also reports the average prediction interval length. ZORRO consistently achieves 100% coverage, outperforming the other methods, particularly at higher uncertainty radii.
In-depth insights#
Uncertain Data#
The concept of uncertain data is central to the research paper, exploring how to learn reliable models when the training data is not perfectly precise. The paper investigates multiple forms of data uncertainty, including missing values, measurement errors, and inconsistencies, representing them using possible world semantics. This approach acknowledges that the true data generating process is unknown and that various possible versions of the dataset could exist, each leading to a potentially different optimal model. By using zonotopes to compactly model all possible datasets, it creates an efficient way to over-approximate the ranges of optimal model parameters and predictions. This ability to reason about the uncertainty provides robust model parameters and reliable predictions despite the presence of errors and missing information in the training data, ultimately enhancing the reliability and fairness of the model.
Zonotope Methods#
Zonotope methods offer a powerful approach to handling uncertainty in machine learning, particularly when dealing with datasets that exhibit variations due to noise, missing values, or inconsistencies. Their ability to compactly represent high-dimensional uncertainty through convex polytopes is key, enabling efficient computation of prediction ranges and robustness guarantees for models trained on uncertain data. The paper leverages zonotopes to symbolically execute gradient descent across all possible dataset variations simultaneously. This innovative technique addresses dataset multiplicity—the challenge of multiple models fitting the same data equally well—by providing a sound over-approximation of all potential optimal model parameters. However, the use of zonotopes introduces complexity, particularly concerning their size and the computational cost of operations involving symbolic expressions. Strategies like linearization and order reduction are crucial for mitigating this complexity and achieving computational tractability. While the closed-form solution derived for ridge regression is a significant achievement, extending zonotope methods to more complex models remains a challenge. Overall, the use of zonotopes in this paper showcases a powerful but computationally intensive approach to robust model learning. Future work could focus on improving efficiency and scaling to more complex models.
Robustness Analysis#
Robustness analysis in machine learning assesses a model’s resilience against various uncertainties. This includes evaluating performance under data perturbations, such as noise, missing values, or adversarial examples, and considering how these uncertainties impact model predictions and parameters. A core aspect often involves quantifying uncertainty in model outputs, which could include prediction intervals or confidence measures. Moreover, it extends to assessing model robustness across different data distributions or environments, and evaluating its sensitivity to training hyperparameters. Robustness analysis is crucial for building reliable and trustworthy AI systems, providing insights into the reliability of model predictions and enabling better decision-making in high-stakes scenarios. The field is rich with diverse methodologies, ranging from simple statistical techniques to complex, computationally expensive methods such as those involving abstract interpretation or formal verification, and the optimal approach is typically application-dependent.
Abstract Gradient#
Abstract gradient methods represent a powerful class of algorithms for optimization problems, particularly those involving uncertainty or high dimensionality. The core idea is to approximate the gradient of a complex function (possibly non-convex, non-differentiable, or involving unknown parameters) in a simpler, tractable space. This simplifies calculations while maintaining a reasonable level of accuracy, offering a balance between efficiency and precision. Zonotopes, a type of convex polytope, are often used in abstract gradient methods for compactly representing uncertainty in data and model parameters. Linearization and order reduction techniques may be employed to reduce computational complexity, and methods often focus on proving the soundness of the approximations (guaranteeing the method doesn’t miss any potential optima). Convergence is a critical concern, as iterative methods might not always guarantee a fixed point in the abstract space. Therefore, theoretical analysis is important to show conditions ensuring convergence and to characterize properties of the solutions (e.g., a closed-form solution for specific loss functions). These methods have the potential to provide robustness and uncertainty quantification results when dealing with noisy, uncertain data, which is especially valuable in real-world scenarios.
Future Research#
Future research directions stemming from this work on learning linear models from uncertain data are manifold. Extending the framework to non-linear models, such as neural networks, is crucial, requiring more sophisticated linearization and order reduction techniques to manage the increased complexity of symbolic operations. Investigating the impact of different types of uncertainty beyond label and feature noise, including uncertainty stemming from data biases and inconsistencies, would provide further insights into model robustness. Improving the efficiency of the proposed abstract gradient descent algorithm for larger datasets and higher-dimensional spaces is also critical, perhaps through parallel computation or more advanced fixed point techniques. Finally, applying this robust modeling approach to a wider range of real-world applications, particularly in sensitive domains like healthcare and finance, is a promising avenue for future investigation. Rigorous empirical studies comparing the performance of this method against existing uncertainty quantification techniques under various conditions and datasets will further establish its efficacy and practical value.
More visual insights#
More on figures

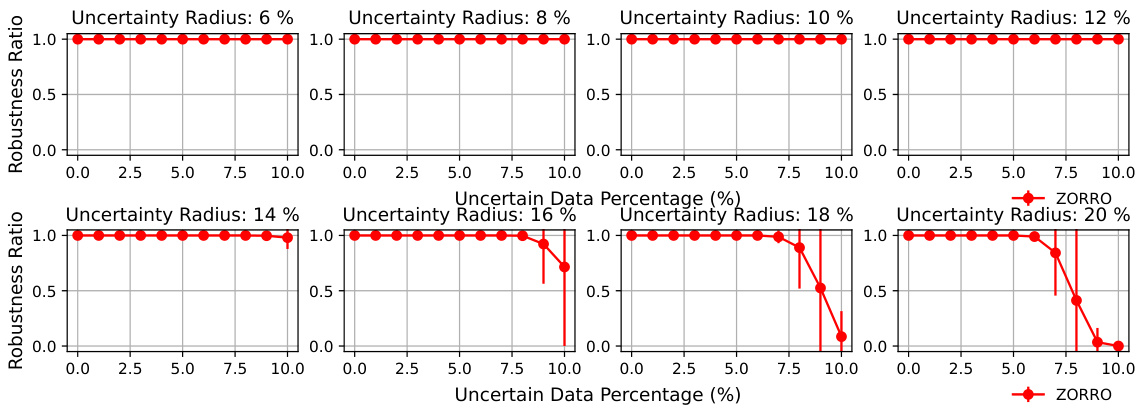
This figure compares the robustness verification results of the proposed method (ZORRO) with the baseline method (MEYER [47]). The robustness verification is performed for different levels of uncertainty in the data (uncertain data percentage and uncertainty radius). The figure contains three subfigures (a, b, c) which show the robustness ratios for different datasets (MPG and Insurance) and types of uncertainty (uncertain labels and uncertain features). The y-axis represents the robustness ratio, while the x-axis shows the uncertain data percentage. The results demonstrate that ZORRO consistently achieves higher robustness ratios compared to MEYER.

This figure compares the robustness verification results of ZORRO and MEYER on two datasets, MPG and Insurance. The robustness ratio is used as a metric, representing the fraction of test samples receiving robust predictions. Different subfigures show results for varying uncertainty radii and percentages of uncertain data for both label and feature uncertainties. ZORRO consistently demonstrates higher robustness ratios, particularly with higher uncertainty radii, showcasing the benefit of using zonotopes over intervals for over-approximating uncertainties.

The figure compares the robustness verification results between MEYER’s approach which uses intervals and ZORRO’s approach which uses zonotopes. It shows the robustness ratio (fraction of test data points with robust predictions) under different conditions of uncertain data percentage and uncertainty radius. The plots show that ZORRO consistently certifies higher robustness ratios than MEYER, especially for uncertain labels, and handles uncertainty in features. The comparison is done on MPG and Insurance datasets.

This figure presents the results of robustness verification experiments using two methods: Meyer et al.’s interval-based approach and the proposed ZORRO method using zonotopes. The experiments evaluate the impact of data uncertainty on the robustness of linear regression models. The plots show the robustness ratio (fraction of test samples with robust predictions) against the uncertain data percentage and uncertainty radius. ZORRO demonstrates superior performance in certifying robustness compared to MEYER, particularly when uncertainty is high. The results are separated into panels showing uncertainty in labels for MPG and Insurance datasets, and uncertainty in features for the MPG dataset.

This figure shows the results of applying the ZORRO method to causal inference. Three scenarios are presented, each demonstrating different relationships between the intercept (model bias) and the treatment effect (coefficient of the treatment variable). The blue shaded regions represent the range of possible values for the intercept and treatment effect computed by ZORRO, accounting for data uncertainty. The red squares represent ground truth values from a complete dataset, and the green triangles represent results from KNN imputation. The figure highlights ZORRO’s ability to provide a range of plausible values rather than a single point estimate, demonstrating the impact of uncertainty on the model parameters.

This figure presents the results of robustness verification experiments comparing two methods: Meyer et al. (using intervals) and ZORRO (using zonotopes). The experiments vary the uncertainty radius and the percentage of uncertain data in the training set for two different datasets (MPG and Insurance). The robustness ratio, shown on the y-axis, represents the fraction of test data points that receive robust predictions (predictions with a range smaller than a specified threshold). The x-axis represents the percentage of uncertain data in the training set. The plots show that ZORRO consistently achieves higher robustness ratios than Meyer et al., particularly when the uncertainty radius or percentage of uncertain data is high. This indicates that ZORRO’s zonotope-based approach provides tighter prediction intervals and more reliable robustness certifications.

This figure compares the robustness verification results of the proposed ZORRO approach with the MEYER baseline [47]. The robustness verification is performed under various conditions of uncertain data, including both uncertain labels and uncertain features. The robustness ratio, which is the fraction of the test data receiving robust predictions, is used as the evaluation metric. The figure shows that ZORRO consistently certifies higher robustness ratios compared to MEYER, especially when the uncertainty radius is higher.

This figure compares the robustness verification results of the proposed ZORRO method with the baseline method MEYER [47] using heatmaps. The heatmaps show the robustness ratios (fraction of robust predictions) across different uncertainty radii and percentages of uncertain data. The results demonstrate ZORRO’s ability to certify significantly higher robustness ratios, particularly when uncertainty is high, indicating its effectiveness in handling data uncertainty. The plots (a) and (b) show results for uncertain labels in MPG and insurance data, while plot (c) shows results for uncertain features in MPG data.

This figure compares the robustness verification results of the proposed ZORRO method with the baseline method MEYER [47] on two datasets, MPG and Insurance. The robustness is assessed under various conditions of uncertainty in training labels and features. The x-axis represents the percentage of uncertain data, while the y-axis represents the robustness ratio, which is the fraction of test data points receiving robust predictions (prediction intervals smaller than a threshold). The subfigures show robustness results under different uncertainty radii for labels (a, b) and features (c). ZORRO consistently demonstrates superior robustness compared to MEYER, especially as the uncertainty in the training data increases. This is because MEYER uses interval arithmetic, which ignores correlations between model weights, while ZORRO leverages zonotopes to more accurately capture the impact of data uncertainty.

This figure compares the robustness verification results between the proposed method (ZORRO) and the baseline method (MEYER) under different uncertainty settings. The robustness ratio, which is the fraction of the test data receiving robust predictions, is used as the metric. The results demonstrate that ZORRO consistently certifies significantly higher robustness ratios than MEYER across various uncertainty levels (uncertainty radius and uncertain data percentage). This highlights the effectiveness of ZORRO in providing more reliable robustness guarantees.

This figure compares the robustness verification results of the proposed ZORRO method with the MEYER method on datasets with uncertain labels. The heatmaps show the robustness ratio (percentage of test data points with robust predictions) under varying uncertainty radius (percentage of error in labels) and uncertain data percentage (percentage of instances with uncertain labels). ZORRO consistently shows higher robustness ratios than MEYER, demonstrating its effectiveness in handling label uncertainty. The results highlight that ZORRO offers more robust performance than MEYER especially when uncertainty is high.

This figure compares the robustness verification results obtained using intervals (MEYER) and zonotopes (ZORRO) for three different scenarios: uncertain labels in MPG data, uncertain labels in insurance data, and uncertain features in MPG data. For each scenario, the robustness ratio (the fraction of test data points receiving robust predictions) is plotted against the percentage of uncertain data for various uncertainty radii. The results show that ZORRO consistently certifies higher robustness ratios than MEYER, especially when the uncertainty radius is high. This demonstrates the effectiveness of ZORRO’s zonotope-based approach in handling uncertainties and providing tighter bounds on prediction ranges.

This figure compares the robustness verification results of the proposed ZORRO method with the baseline MEYER method [47] under different uncertainty settings. The x-axis represents the percentage of uncertain data in the training dataset, and the y-axis represents the robustness ratio, which is the fraction of test data points for which the model produces robust predictions (i.e., predictions within a specified threshold). Three subfigures show results for uncertain labels in MPG and insurance datasets and uncertain features in the MPG dataset, respectively. The results demonstrate that ZORRO consistently achieves higher robustness ratios than MEYER, highlighting its effectiveness in handling data uncertainty.

This figure compares the robustness verification results of the proposed ZORRO method with the baseline method MEYER [47] under different uncertainty settings. The robustness ratio, defined as the fraction of test data points that receive robust predictions (the prediction interval is less than a given threshold), is plotted against the uncertain data percentage for various uncertainty radii (percentage of instances with uncertain features/labels). ZORRO consistently demonstrates higher robustness ratios, especially when the uncertainty radius is large, due to its more accurate and less conservative approximation of the prediction range compared to MEYER’s interval arithmetic approach. The figure includes separate subfigures showing results for uncertain labels for the MPG dataset, uncertain labels for the insurance dataset, and uncertain features for the MPG dataset.

This figure compares the robustness verification results of the proposed method (ZORRO) with the baseline method (Meyer et al. [47]) under different uncertainty settings. It shows robustness ratios (fraction of test samples with robust predictions) for varying uncertainty radius (percentage of deviation from the true values) and uncertain data percentage (percentage of samples with uncertain values) for two datasets (MPG and Insurance). The plots visualize the impact of training data uncertainty on model robustness, demonstrating that the ZORRO method, which leverages zonotopes, provides superior robustness certification results compared to Meyer et al.’s approach, which utilizes interval arithmetic. The results showcase ZORRO’s efficacy in computing prediction ranges and robustness.

This figure compares the robustness verification results of the proposed method, ZORRO, against a baseline method, MEYER [47], under different uncertainty conditions. The robustness is evaluated using two metrics: (a) and (b) show robustness verification results with uncertain labels on MPG and Insurance datasets, respectively. (c) demonstrates the robustness verification results with uncertain features on the MPG dataset. In each subfigure, the x-axis represents the uncertain data percentage, and the y-axis represents the robustness ratio, which is the fraction of test data points with robust predictions (the size of the prediction interval is below a certain threshold). ZORRO consistently outperforms MEYER across all scenarios, showcasing its ability to handle data uncertainty more effectively and provide tighter prediction ranges.

This figure compares the robustness verification results of the proposed method (ZORRO) with the baseline method (Meyer et al. [47]) under different uncertainty settings. The robustness is evaluated using the robustness ratio, which is the fraction of the test data receiving robust predictions. The results show that ZORRO consistently certifies significantly higher robustness ratios than MEYER, especially when the uncertainty radius is high. The plots show the robustness ratios for varying levels of uncertain data percentage and uncertainty radius for both uncertain labels and uncertain features (MPG and Insurance datasets).
Full paper#


