↗ OpenReview ↗ NeurIPS Homepage ↗ Chat
TL;DR#
Current data valuation methods suffer from a critical limitation: they assign a single scalar score to each data point, neglecting the varying quality of individual cells within the point. This makes it difficult to pinpoint noisy cells and rectify the issues accordingly, potentially leading to discarding valuable data points entirely. In addition, this approach obscures the distinct roles individual cells play, hindering transparency and sub-optimizing data allocation in various practical scenarios.
To overcome these issues, the paper proposes 2D-OOB, a novel out-of-bag estimation framework for jointly assessing data point usefulness and identifying the specific features driving this impact. The experimental results demonstrate 2D-OOB’s superior performance in cell-level outlier detection, model performance enhancement via cell fixation, and localization of backdoor triggers. The method is computationally efficient, significantly outperforming existing methods and showing promising results in multiple use cases. This addresses the critical challenge of fine-grained data analysis, advancing the field of data valuation and improving model interpretability.
Key Takeaways#
Why does it matter?#
This paper is crucial for researchers working on data valuation and explainable AI. It offers a novel framework for finer-grained data analysis, addressing limitations of existing methods. This opens up new research avenues in detecting and mitigating data poisoning attacks, improving model robustness and fairness.
Visual Insights#

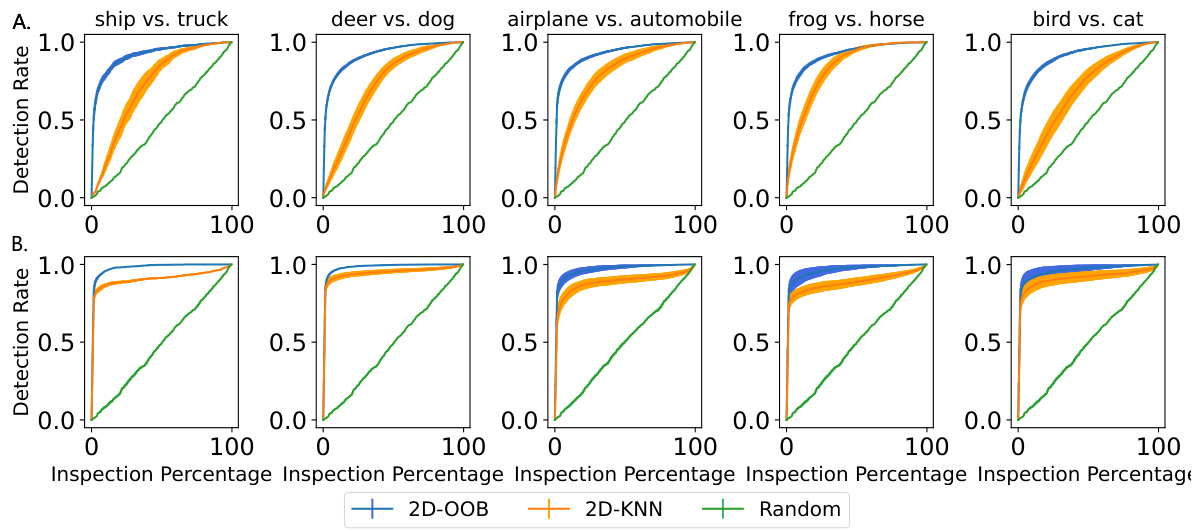
This figure compares the performance of three methods (2D-OOB, 2D-KNN, Random) in detecting cell-level outliers. The x-axis shows the percentage of cells inspected, and the y-axis shows the detection rate. 2D-OOB significantly outperforms the other two, achieving high detection rates while inspecting only a small fraction of the cells. Error bars represent 95% confidence intervals.

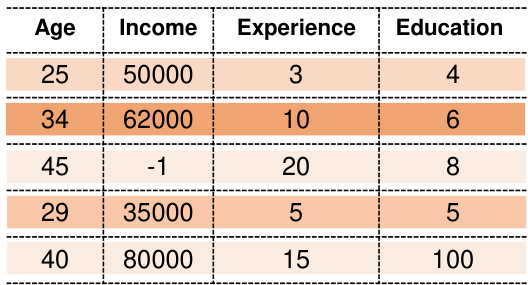
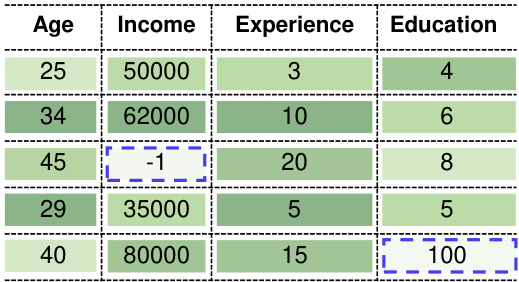
This figure compares data valuation and joint valuation methods on a hypothetical dataset. Data valuation assigns a single score to each data point, while joint valuation assigns scores to individual features within each data point, enabling detection of outliers at the feature level.
In-depth insights#
Joint Data Valuation#
Joint data valuation tackles the limitations of traditional data valuation methods by moving beyond assigning a single scalar value to each data point. Instead, it focuses on attributing value to individual features or cells within a data point, acknowledging the inherent heterogeneity within datasets. This approach is particularly valuable when data quality varies substantially across different features of a data point, or when data originates from multiple sources with different levels of reliability. By disaggregating data valuation to the feature level, joint data valuation provides more granular insights and enables a more nuanced understanding of data quality and contribution. This is crucial for tasks such as identifying and rectifying outliers at the cell level, improving model performance through targeted data refinement, and fairly allocating compensation in data marketplaces where individual features might originate from different sellers. The challenge lies in developing computationally efficient methods to achieve this fine-grained valuation without sacrificing accuracy, which existing methods like 2D-Shapley struggle to do.
2D-OOB Framework#
The proposed 2D-OOB framework offers a novel approach to data valuation by jointly assessing the contribution of individual data points and their constituent features. Unlike traditional methods that assign a single scalar value to each data point, 2D-OOB provides a more nuanced perspective by assigning scores to individual cells (features) within each data point, thereby enabling fine-grained analysis of data quality. This granular approach is particularly valuable for identifying and addressing noisy cells, outliers, and even malicious backdoors within datasets. The method’s computational efficiency, stemming from its out-of-bag estimation strategy, makes it applicable to large-scale datasets. 2D-OOB’s versatility extends to various machine learning tasks, demonstrating improved performance in cell-level outlier detection, cell fixation, and backdoor trigger localization. Its theoretical grounding in Data-OOB and its connection to DataShapley provide a strong foundation for its effectiveness and interpretability. The ability to pinpoint problematic features at the cell level, not just at the data point level, is a major strength, leading to more informed decisions regarding data cleaning, model training, and data market valuation.
Cell-Level Insights#
The concept of ‘Cell-Level Insights’ in a research paper would involve a granular analysis of data, moving beyond aggregate or row-level observations. This approach would offer a deeper understanding of individual data points by examining the contribution of each feature or variable. For example, in a dataset containing patient information, ‘cell-level insights’ might reveal the independent influence of specific medical tests or demographic factors. Identifying influential cells could lead to crucial discoveries. It may pinpoint outliers or anomalies within individual data points that aggregate-level analysis would miss, potentially improving data quality and model accuracy. Moreover, a cell-level approach may highlight interactions between features that are not apparent at a higher level, allowing for more nuanced interpretations of the data. It is essential to note that the computational demands of this approach increase substantially, and careful consideration of statistical significance in the resulting analysis would be crucial.
Data Poisoning#
Data poisoning, a significant threat to machine learning systems, involves surreptitiously injecting malicious data into training datasets. Adversaries aim to compromise model integrity and performance by introducing subtle manipulations that cause the model to behave erratically or produce biased outputs. This can be achieved through various techniques, including adding slightly altered data points, strategically injecting mislabeled data, or crafting backdoor triggers. The impact can be substantial, from causing inaccuracies in predictions to manipulating model behavior for malicious purposes. Effective defense mechanisms against data poisoning often focus on robust training methods, data validation techniques, and anomaly detection. Detecting subtle poisoned data is challenging, necessitating advanced algorithms that can identify patterns deviating from the expected data distribution. Furthermore, understanding the specific methods of attack is vital for developing robust defenses. Current research is actively exploring both proactive methods such as data sanitization, and reactive techniques such as post-training model inspection and remediation.
Future Extensions#
Future extensions of this research could explore several promising directions. Firstly, scaling the method to handle significantly larger datasets and higher-dimensional data is crucial for broader applicability. This might involve investigating more efficient approximations or alternative computational techniques. Secondly, exploring the robustness of the approach to different types of noisy data and addressing scenarios with missing data values would enhance its practical utility. Thirdly, extending the method beyond tabular data and images to other modalities like text and time-series data could open up new applications in various domains. Finally, integrating the method with existing model-agnostic explainability techniques could enhance the interpretation of results and provide richer insights into data-model interactions. Investigating the potential for adversarial attacks against the valuation method is important for security and fairness.
More visual insights#
More on figures

The figure shows the performance of three methods (2D-OOB, 2D-KNN, and Random) in detecting cell-level outliers. The x-axis shows the percentage of cells examined, and the y-axis shows the percentage of outliers correctly identified. 2D-OOB significantly outperforms the other two methods, demonstrating its efficiency in identifying outliers.

This figure compares the performance of 2D-OOB, 2D-KNN, and a random baseline in detecting cell-level outliers. The detection rate (y-axis) is plotted against the inspection percentage (x-axis), showing how many outliers are found as a percentage of the total number of cells examined. Error bars represent the 95% confidence interval across 30 experiments. The results demonstrate that 2D-OOB significantly outperforms the other methods, achieving high detection rates with a much smaller proportion of cells inspected.

This figure shows four examples of poisoned images and their corresponding cell valuation heatmaps generated by 2D-OOB. The heatmaps visually represent the importance of each cell in the image, with red indicating higher importance and blue indicating lower importance. The examples demonstrate that 2D-OOB accurately highlights the backdoor triggers (the manipulated parts of the images) as the most important features driving misclassification, even when the actual object is present. This is a key strength of 2D-OOB in its ability to localize the impact of data poisoning attacks at the cell level.

This figure compares the performance of three methods (2D-OOB, 2D-KNN, and Random) in detecting cell-level outliers. The x-axis shows the percentage of cells inspected, and the y-axis shows the detection rate. 2D-OOB significantly outperforms the other methods, demonstrating its efficiency in finding outliers.

This figure shows four examples of poisoned images and their corresponding cell valuation heatmaps generated by 2D-00B. Redder colors in the heatmaps indicate higher importance, and bluer colors indicate lower importance. The heatmaps show that 2D-00B successfully highlights the backdoor trigger regions (the areas manipulated by the poisoning attack) as the most important features for the model’s misclassification, rather than the actual content of the images.

The figure shows the test accuracy of different data valuation methods when data points are removed progressively, starting with the lowest-valued ones. It compares 2D-00B-data against other methods like Data-00B, DataShapley, and KNNShapley across six binary classification datasets. The goal is to illustrate how effectively each method identifies and removes unhelpful data points to improve model accuracy. 2D-00B-data generally shows the best performance, maintaining higher accuracy even after removing a significant portion of data points.
More on tables

This figure compares data valuation and joint valuation methods on a simple hypothetical dataset. Data valuation assigns a single score to each data point, masking the quality variations within the point’s individual cells. Joint valuation, conversely, assigns scores to individual cells, revealing which specific cells are problematic. The example highlights how joint valuation can identify outlier cells within an otherwise good data point, preventing the discarding of potentially useful data.

This table presents a comparison of the Area Under the Curve (AUC) and runtime for 2D-00B and 2D-KNN across twelve binary classification datasets. The results demonstrate that 2D-00B significantly outperforms 2D-KNN in terms of AUC, while also being substantially faster. The table includes the average and standard error for both metrics, based on 30 independent experimental runs, highlighting the statistical significance of the findings.

This table presents the Area Under the Curve (AUC) for cell-level outlier detection using different types of weak learners in the 2D-OOB model. It shows that the choice of weak learner (Decision Tree, Logistic Regression, single-layer MLP, two-layer MLP) has a relatively small impact on the overall AUC performance, demonstrating robustness. The 2D-KNN baseline’s performance is also included for comparison.

This table presents the results of an ablation study on the choice of weak learners used in the 2D-OOB model for cell-level outlier detection. It compares the Area Under the Curve (AUC) of the precision-recall curve for different types of weak learners (decision tree, logistic regression, single-layer MLP, two-layer MLP) across 12 datasets. The table shows that while different learners lead to slight variations in cell valuations, the overall performance of the detection task remains robust, and 2D-OOB consistently outperforms the 2D-KNN baseline.

This table lists twelve binary classification datasets from OpenML used in the paper’s experiments. For each dataset, it provides the total number of samples, the input dimension (number of features), the majority class proportion, and the OpenML ID.

This table presents the results of cell-level outlier detection experiments performed on three multi-class classification datasets. The Area Under the Curve (AUC) and runtime are reported for both the proposed 2D-OOB method and the baseline 2D-KNN method. The results are averaged over 30 independent experiments, with standard errors provided to indicate variability.

This table compares the Area Under the Curve (AUC) for cell-level outlier detection between the proposed 2D-OOB method and a two-stage attribution approach. The two-stage method first computes a data valuation score for each data point and then uses feature attribution to estimate individual cell-level importance. The results show that 2D-OOB consistently achieves higher AUC values across multiple datasets, demonstrating its superior performance for cell-level outlier identification.

This table presents a comparison of the Area Under the Curve (AUC) and runtime for 2D-OOB and 2D-KNN algorithms on twelve binary classification datasets. The AUC measures the algorithms’ ability to detect cell-level outliers, with higher values indicating better performance. Runtime is measured in seconds. The results show that 2D-OOB significantly outperforms 2D-KNN in AUC while being much faster.

This table presents a comparison of the Area Under the Curve (AUC) and runtime for 2D-OOB and 2D-KNN across 12 binary classification datasets. The AUC measures the performance of each method in detecting cell-level outliers, while the runtime reflects computational efficiency. Results show that 2D-OOB consistently achieves a higher AUC (better outlier detection) and significantly shorter runtime (faster computation) than 2D-KNN across all datasets.

This table presents the AUCPR (Area Under the Precision-Recall Curve) for various data valuation methods in detecting mislabeled data points. It compares the performance of 2D-00B-data (a marginalized version of the proposed 2D-00B method) against other established methods such as DataShapley, KNNShapley, Data-OOB, LAVA, and DataBanzhaf. The results show that 2D-00B-data achieves comparable performance to Data-OOB while significantly outperforming other methods.
Full paper#


