↗ OpenReview ↗ NeurIPS Homepage ↗ Chat
TL;DR#
Current embedding model evaluation heavily relies on domain-specific, empirical approaches using downstream tasks, which is often expensive and time-consuming. This method is not scalable, and acquiring adequately large and representative datasets poses significant challenges, hindering comprehensive model comparison. The existing task-oriented methods lack a standardized framework and are not always viable.
This paper proposes a unified, task-agnostic approach. It leverages information theory to create a comparison criterion, “information sufficiency.” This criterion, combined with a self-supervised ranking, provides a scalable and cost-effective evaluation method. Experiments across NLP and molecular biology showcase its strong correlation with various downstream task performances, offering practitioners a valuable tool for prioritizing model trials.
Key Takeaways#
Why does it matter?#
This paper is crucial for researchers as it offers a task-agnostic and self-supervised method to evaluate and rank embedders, overcoming the limitations of existing domain-specific approaches. It provides a unified theoretical framework, practical evaluation tool, and experimental validation across NLP and molecular biology, directly impacting model selection and resource allocation. This opens new avenues for research in developing more effective and efficient evaluation metrics for various machine learning models.
Visual Insights#

This figure illustrates the theoretical framework for comparing embedding models using information theory. It shows two embedding models, U and V, each receiving input X (features) and outputting U and V respectively. A concept y ∈ Y (concepts) is communicated through the models. Model U is evaluated as potentially more informative about Y than Model V if U can simulate V without information loss. The model’s ability to communicate the concept is likened to the capacity of a noisy communication channel.

This table presents a summary of the performance of 34 different embedding models on the Massive Text Embedding Benchmark (MTEB). The table includes the name of each model, its dimensionality, the maximum number of tokens it processes, and its information sufficiency score (Is). In addition, it shows the model’s average performance across six categories of downstream tasks within MTEB: Classification, Clustering, Reranking, Retrieval, STS, and Classification 2. This table provides a comprehensive overview of the models’ performance across various tasks and their information sufficiency, aiding in the selection of suitable models for specific downstream applications.
In-depth insights#
Embedder Evaluation#
Embedder evaluation is a critical aspect of research in machine learning, especially given the proliferation of embedding models. Traditional methods often rely on evaluating performance on specific downstream tasks, which suffers from limitations in scalability and the requirement of labeled data. This paper proposes a novel framework that moves beyond these limitations by leveraging information-theoretic concepts like sufficiency and informativeness to compare embedders. The introduction of a task-agnostic evaluation metric, Information Sufficiency (IS), is a key contribution. This allows for a more efficient and scalable ranking of embedders without the need for extensive experiments on numerous downstream tasks, ultimately saving computational resources. Experimental results demonstrate that the proposed approach aligns well with actual downstream performance, making it a valuable tool for practical model selection. Further research may explore the use of randomly initialized embedders and refinement of the IS metric to address some limitations, which primarily stem from model non-comparability in certain cases. The proposed framework provides a significant advance in embedding model comparison and prioritization.
Info Sufficiency Metric#
The Info Sufficiency Metric, as described in the paper, presents a novel approach to evaluating embedding models in a task-agnostic manner. Instead of relying on downstream task performance, which can be expensive and time-consuming, this metric leverages information theory to directly compare the informativeness of different embedding models. The core idea is to quantify how well one embedding model can simulate another, employing concepts like deficiency and information sufficiency. A practical relaxation of sufficiency, termed information sufficiency (IS), is introduced, making the computation tractable. The method’s strength lies in its ability to provide a self-supervised, label-free ranking of embedders, aligning well with downstream task performance across diverse applications like NLP and molecular biology. A key advantage is its scalability, enabling efficient prioritization of model trials. However, the metric’s effectiveness does depend on the number and diversity of available embedding models, and further research may refine the estimation of deficiency for even greater accuracy.
NLP Experiments#
The NLP experiments section of this research paper would likely detail the empirical evaluation of the proposed embedder ranking methodology on various natural language processing tasks. It would likely involve a comprehensive benchmark, such as the Massive Text Embedding Benchmark (MTEB), to assess performance across diverse downstream tasks including classification, similarity, and retrieval. Specific datasets used within this benchmark would be clearly identified, enabling reproducibility. The evaluation would likely use standard metrics like accuracy, precision, recall, F1-score, and perhaps Spearman or Kendall correlation to compare the rankings produced by the proposed methodology with the actual performance of the embedders. Results would demonstrate the extent to which information sufficiency aligns with downstream task performance. This section would be crucial in validating the practical utility and effectiveness of the proposed method for model selection in NLP. Crucially, it should explicitly address the scalability of the method and demonstrate its ability to effectively rank a substantial number of embedders. Further analyses on the impact of various hyperparameters on the ranking would also be expected, strengthening the robustness and generalizability of the findings. Finally, comparisons to alternative ranking methodologies could be included to highlight the advantages of the proposed method.
Molecular Modeling#
The section on ‘Molecular Modeling’ likely details the application of the proposed embedding evaluation framework to the field of molecular biology. This involves comparing different molecular embedding models, which represent molecules as numerical vectors, based on their information sufficiency. The authors likely demonstrate that their task-agnostic method correlates well with the ability of these embeddings to perform downstream tasks relevant to molecular modeling, such as predicting molecular properties or simulating molecular interactions. A key finding is probably the high correlation between the information sufficiency metric and empirical performance on diverse downstream tasks, providing a practical tool for researchers. The evaluation likely includes a diverse set of molecular datasets and tasks, showcasing the framework’s applicability and scalability across different applications. The discussion might include specific examples comparing different classes of molecular embedding models (e.g., graph-based vs. string-based). Challenges like handling the high dimensionality of molecular data and computational cost are probably discussed. Finally, the authors might highlight the potential of this framework to accelerate model selection and development in molecular modeling, offering significant time and resource savings. This section likely serves as strong empirical validation for their method in a field where large-scale experimental comparisons of models are challenging.
Future Directions#
The study’s “Future Directions” section could explore several promising avenues. Extending the framework to handle diverse data modalities beyond text and molecules would significantly broaden its applicability. Developing more efficient algorithms for estimating information sufficiency is crucial, particularly for scaling to massive datasets and a large number of models. A key area for investigation is exploring the relationship between information sufficiency and generalization performance in downstream tasks. Understanding this connection could lead to improved model selection strategies. Furthermore, investigating how the method interacts with different training paradigms and architectural choices would enhance the framework’s robustness. Finally, applying the framework to other domains, such as computer vision and time series analysis, would validate its generality and reveal potential new applications. The evaluation of these new applications would also provide insights into the limitations and required adaptations for the proposed methodology.
More visual insights#
More on figures

This figure shows a heatmap representing the pairwise information sufficiency (Is) scores between different text embedding models. The color intensity indicates the level of information sufficiency; darker colors represent higher sufficiency, implying that one embedder can more effectively simulate the other. This visualization helps to identify clusters or groups of similar models and their relative informativeness.
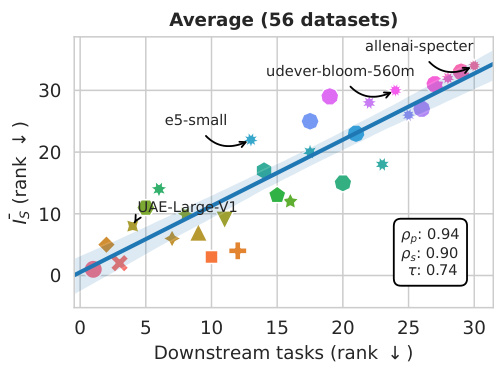
This figure displays the correlation between the Information Sufficiency (Is) scores and the performance on downstream tasks for both Natural Language Processing (NLP) and Molecular Modelling. The Is score, a novel task-agnostic metric proposed in the paper, is shown to correlate strongly with the performance on a wide range of downstream tasks across both domains. The three types of correlations (Pearson, Spearman, and Kendall-Tau) are provided to capture the relationship from different perspectives. Un-aggregated results for each task can be found in the respective sections of the paper.
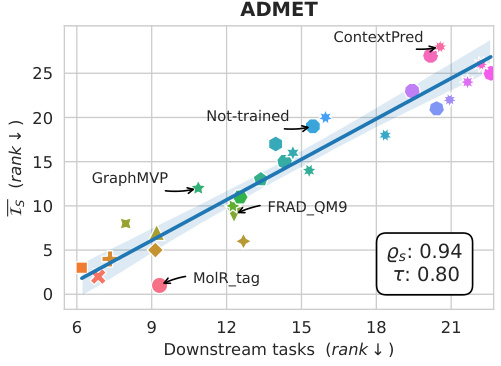
This figure displays the correlation between the information sufficiency (Is) scores and the performance on various downstream tasks in two domains: Natural Language Processing (NLP) and Molecular Modelling. The Is score is a novel metric proposed in the paper to evaluate the quality of embedding models. The plots show that there is a strong positive correlation between the Is score and the performance on downstream tasks in both domains, indicating that models with higher Is scores tend to perform better on a variety of downstream tasks. The Pearson, Spearman, and Kendall-Tau correlation coefficients are reported for a quantitative assessment of the correlations.

This figure shows three subfigures. Subfigure (a) shows a graph representing the information sufficiency between different text embedding models. Nodes represent models and edges show the information sufficiency between them. The graph is colored based on the communities formed by the models. Subfigure (b) shows the performance of different models on downstream tasks not included in the MTEB benchmark, comparing the results to the model’s information sufficiency score. Subfigure (c) shows that models with instruction finetuning show improvements in the performance on downstream tasks as well as in information sufficiency.

This figure shows a pairwise information sufficiency graph (a) and a bar chart (b). The graph visualizes the ability of each embedding model to simulate other models and the ability to be simulated by other models. The color intensity indicates the strength of the relationship; red indicates strong ability, blue indicates low ability. The bar chart displays the average rank of the models on various downstream tasks, ordered by the information sufficiency score (Is score). This visualization helps understand how well each embedding model performs compared to others on multiple downstream tasks and whether the model’s simulation capacity correlates with its overall performance.

This figure shows the correlation between the proposed Information Sufficiency (IS) score and the performance of different embedding models on various downstream tasks in Natural Language Processing (NLP) and molecular modeling. The scatter plots visualize the ranking of models according to the IS score against their ranking based on downstream task performance. The Pearson, Spearman, and Kendall-Tau correlation coefficients quantify the strength of the relationships. High correlation indicates that models ranked higher by the IS score tend to perform better on the downstream tasks, suggesting the IS score’s effectiveness as a task-agnostic evaluation metric.

This figure shows the impact of the number of training steps on both the performance of the models on downstream tasks (measured by accuracy) and the information sufficiency score (Is). It displays how the Is score and accuracy change across various training steps: base_5k, base_50k, base_100k, base_150k, CroissantLLMBase, and CroissantCool. Notably, while the model’s accuracy fluctuates somewhat, the Is score remains relatively stable and demonstrates a consistent trend across different numbers of training steps.
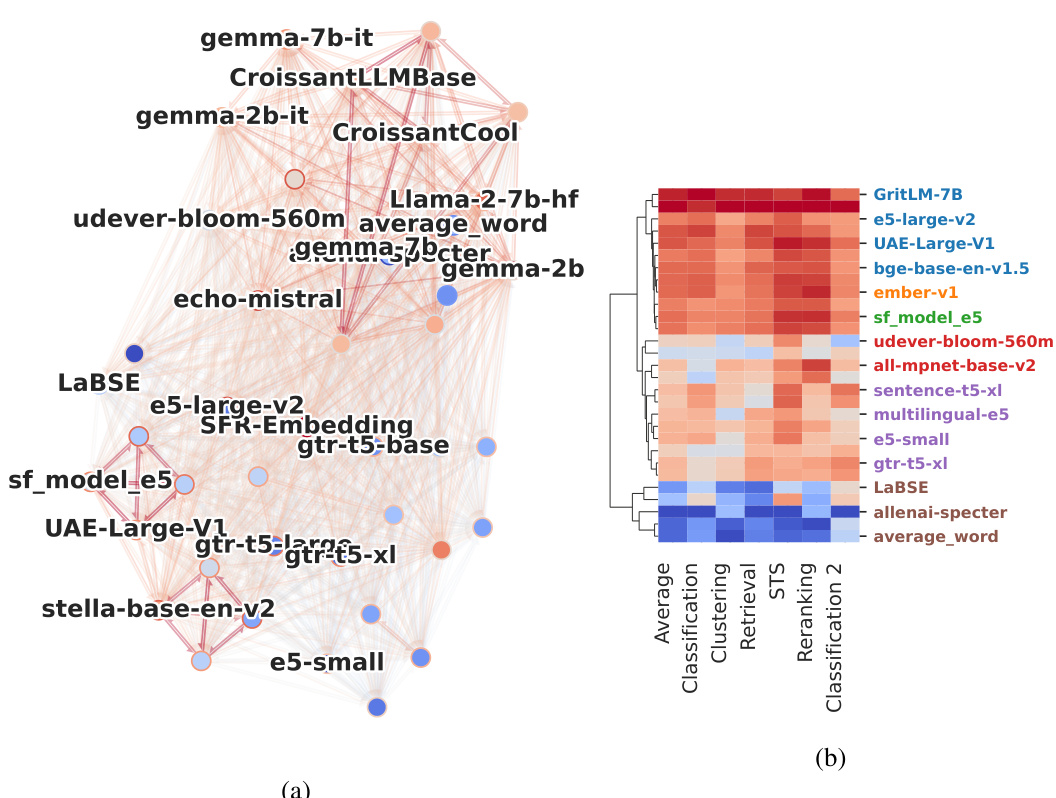
This figure shows three subfigures that explain the relationship between information sufficiency and model performance on downstream tasks. Subfigure (a) presents a directed graph where nodes are embedding models and edges represent information sufficiency. The graph shows communities of models with high mutual information sufficiency. Subfigure (b) shows how the information sufficiency ranking correlates with model performance on downstream tasks, including some not in the benchmark. Subfigure (c) shows that instruction fine-tuning of models improves performance on downstream tasks, and that this improvement is reflected in the information sufficiency score.

This figure displays the correlation between the proposed information sufficiency (Is) score and the performance on various downstream tasks for Natural Language Processing (NLP) and Molecular Modeling. It shows scatter plots illustrating the relationship between the Is score ranking and the downstream task ranking, using three correlation metrics: Pearson, Spearman, and Kendall-Tau. High correlation values across all three metrics indicate that the Is score effectively prioritizes promising embedding models.

This figure displays the correlation between the information sufficiency scores (Is scores) calculated using different datasets and the performance of the models on various downstream tasks. It shows how the choice of the dataset used to compute the Is scores affects the correlation with the downstream task performance. Different datasets (ag_news, dair-ai/emotion, imdb, paws-x;en, rotten_tomatoes, tweet_eval;emoji, tweet_eval;emotion, tweet_eval;sentiment, clinc_oos;plus) were used, and their correlations with several downstream tasks are presented using Pearson, Spearman, and Kendall-Tau correlation metrics.

This figure shows the pairwise information sufficiency between different molecular embedders. Part (a) shows two directed graphs representing the ability of various embedders to predict the 3D denoising models (left) and vice versa (right). Part (b) displays the information sufficiency in both directions, showing that 3D denoising models are harder to simulate from other model types than to predict using other models.

This figure shows a heatmap representing the pairwise information sufficiency (Is) scores between different molecular embedders. The color intensity indicates the strength of the sufficiency relationship, with darker shades representing stronger relationships. This visualization helps to understand how well one embedder can simulate another and provides insights into the redundancy and informativeness of different embedding models in molecular modeling tasks. The figure is useful for identifying the most promising embedders and for understanding the relationships between different embedding methods.

This heatmap visualizes the pairwise information sufficiency scores between different molecular embedders. Each cell represents the information sufficiency of one embedder (row) to simulate another (column). The color intensity indicates the degree of sufficiency; darker colors represent higher sufficiency, showing which models are better at capturing the key properties of molecules that facilitate downstream tasks. This figure helps in understanding the relationships and potential redundancy among various molecular embedding models.
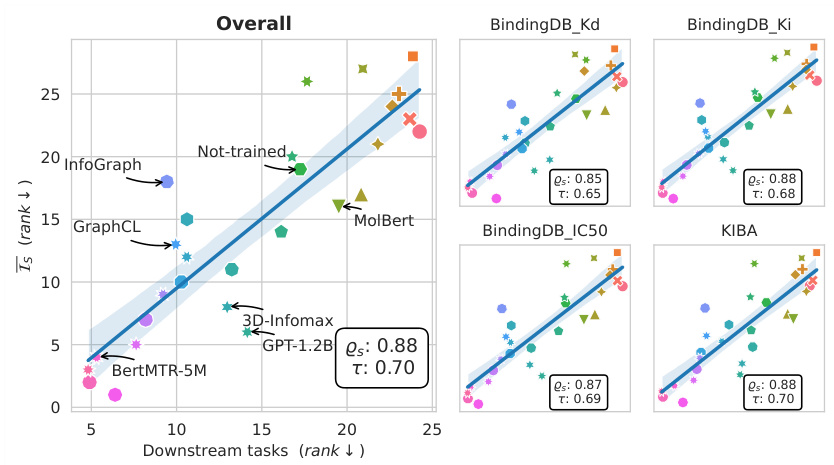
This figure displays the correlation between the information sufficiency (Is) score and the performance on drug-target interaction (DTI) tasks. The Is score, a measure of how well one embedding model can simulate another, is plotted against the rank of models based on their performance on four different DTI datasets: BindingDB_Kd, BindingDB_Ki, BindingDB_IC50, and KIBA. The Spearman and Kendall correlation coefficients (ρs and τ) quantify the strength of the correlation, indicating a strong positive association between Is score and DTI task performance across multiple datasets.
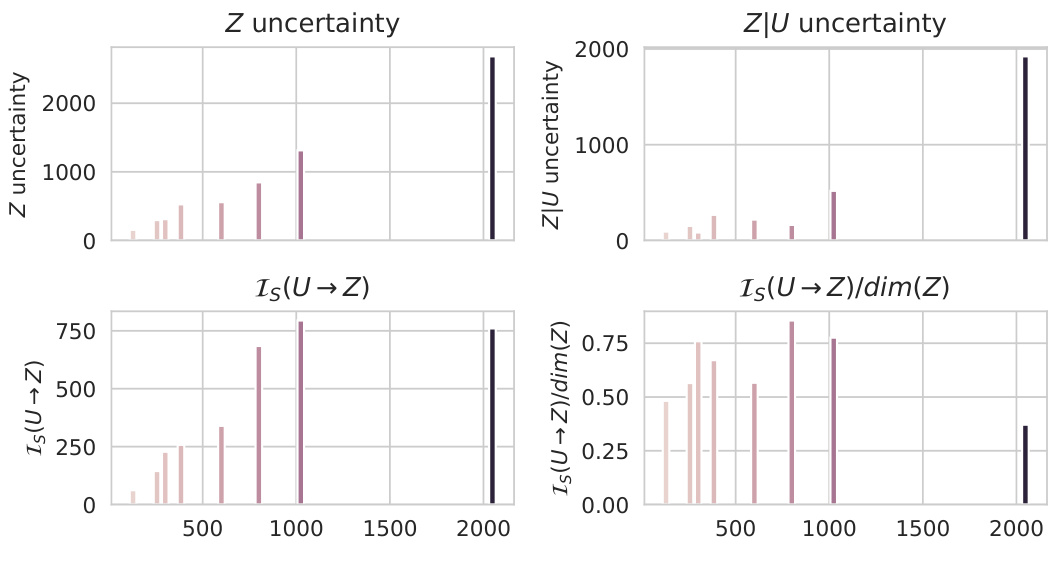
This figure shows the relationship between the dimensionality of the latent space Z and the quantities used to estimate the information sufficiency in molecular modeling. The plots visualize how uncertainty of Z and the uncertainty of Z given U relate to the dimension of Z. The normalized information sufficiency (Is(U→Z)/dim(Z)) is also displayed, showing that the normalization reduces the impact of the latent space dimension.

The figure shows the relationship between the dimension of Z’s latent space and the uncertainty of Z and the uncertainty of Z given U which are used to compute the information sufficiency. It highlights that the estimated information sufficiency is highly correlated to the dimension of the latent space of Z, favoring models with high-dimensional latent spaces. This can be explained by the fact that these embedders yield larger marginal uncertainties and thus, the resulting difference in the uncertainties Is(U → Z) is larger in absolute values. The figure also includes a second visualization where the information sufficiency has been normalized by the dimension, thus removing the dependency on the dimensionality of the latent space.
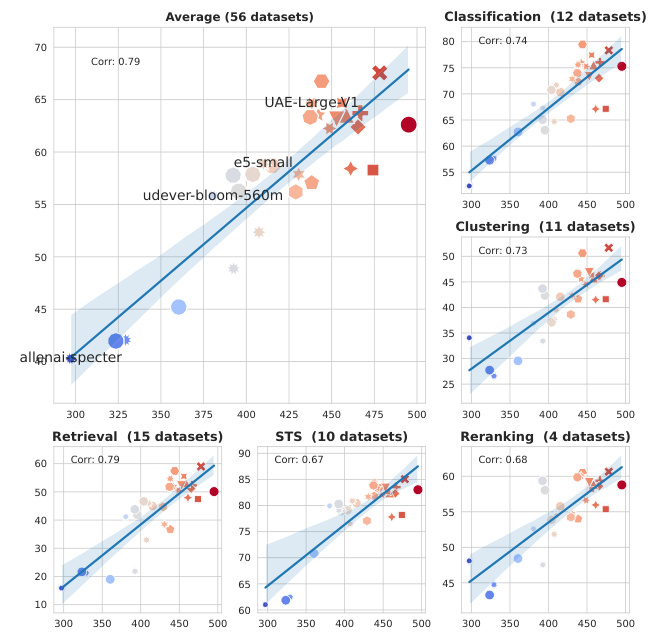
This figure displays the correlation between the information sufficiency (Is) score and the performance on various downstream tasks in both Natural Language Processing (NLP) and molecular modeling. The scatter plots show a strong positive correlation, indicating that higher Is scores are associated with better performance across multiple tasks. The correlations are quantified using three different metrics: Pearson correlation (ρp), Spearman correlation (ρs), and Kendall Tau correlation (τ). Specific task breakdown results can be found in sections C.3.1 (for NLP) and D.3 (for molecular modeling) of the paper.
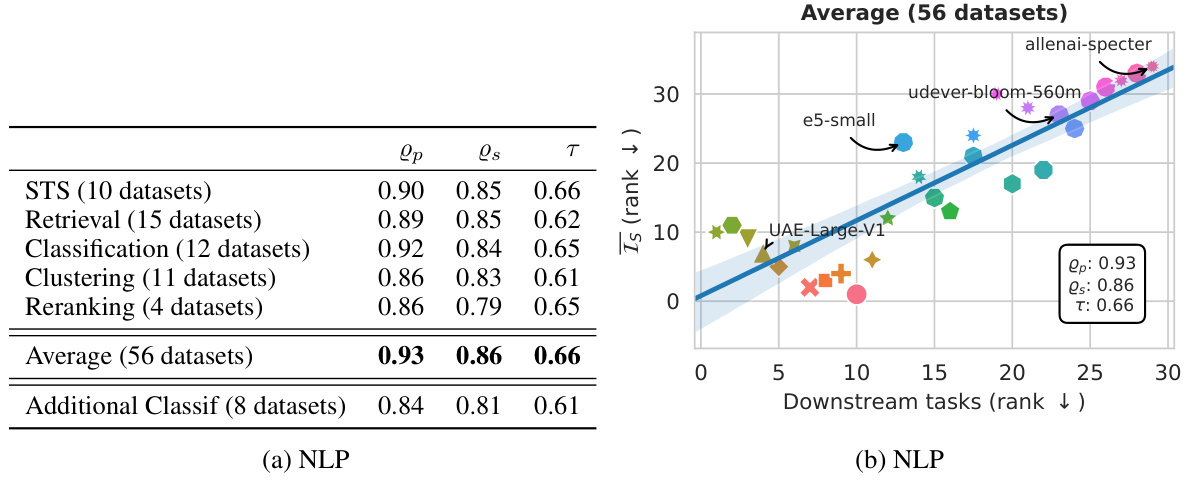
This figure displays the correlation between the proposed Information Sufficiency (Is) score and the performance on various downstream tasks in both Natural Language Processing (NLP) and molecular modeling. Panels (a) and (b) show scatter plots illustrating the relationship for NLP and molecular modeling, respectively. Each point represents a model, with its rank according to the Is score plotted against its rank based on downstream task performance. The Pearson (ρp), Spearman (ρs), and Kendall-Tau (τ) correlation coefficients quantify the strength of the relationship in each domain. High correlation coefficients indicate that models ranked high by the Is score tend to perform well on downstream tasks, supporting the effectiveness of the Is score as a model selection metric.

This figure displays the correlation between the information sufficiency (IS) scores calculated using different datasets and the performance of the models on various downstream tasks. The results are categorized by task type, and the correlations are expressed in terms of Pearson, Spearman, and Kendall coefficients. The figure demonstrates how the choice of the dataset used for IS score calculation can impact the correlation with downstream task performance.

This figure shows a 2D projection of the embeddings of various NLP models, with each point representing a model and its coordinates in the first two principal components. The colors of the points correspond to different datasets used for training or evaluation of the models. The plot visualizes how different models and datasets cluster in the embedding space, offering insight into the relationships between model architectures, training objectives, and dataset characteristics.

This figure shows a heatmap visualization of the pairwise information sufficiency scores between different molecular embedders. The color intensity represents the strength of information sufficiency, with darker shades indicating higher sufficiency. The figure helps to identify clusters of models with similar information content and aids in understanding the relationships between different molecular representation learning methods. Specifically, it provides a task-agnostic way to compare how well one embedding model can be simulated from another, indicating how much information is potentially lost or retained when transitioning between models.

This figure displays the correlations between the information sufficiency (Is) scores calculated using different datasets and the performance of the corresponding models on various downstream tasks. The results are broken down by correlation type (Pearson, Spearman, Kendall Tau) and presented for several task categories. This visualization helps assess how well the Is score, calculated with a specific dataset, predicts the overall performance across a variety of datasets.

This figure displays the correlation between the Is scores (computed using different datasets as the umbrella dataset for evaluating the information sufficiency) and the cross-performance of the models on different downstream tasks. The results show the impact of the dataset used for calculating the Is score on the correlation between the Is score and downstream task performance.

This figure displays the correlation between the Is scores computed on different datasets and their cross-performance on various downstream tasks. The results demonstrate that the choice of dataset for computing the Is score influences its correlation with downstream task performance. Datasets with similar distributions to the tasks yield stronger correlations.
More on tables
This table presents a summary of the performance of 34 different embedding models on the Massive Text Embedding Benchmark (MTEB). The table includes the model name, and average scores across six task categories within the MTEB: Classification, Clustering, Reranking, Retrieval, STS, and Reranking. The table provides a quantitative overview of how each model performed across a variety of downstream NLP tasks.

This table provides metadata for 34 embedding models evaluated in the paper, including their dimensionality, maximum number of tokens, and information sufficiency (Is) scores. The Is score is a key metric developed in this research to evaluate the models’ ability to represent information effectively, independent of specific downstream tasks.

This table presents the statistics of the datasets used in the paper to evaluate the information sufficiency (Is) score. For each dataset, it shows the split (train, validation, test), and the size of each split. The datasets encompass various natural language processing tasks and are diverse in terms of topic, style, and data modality. These datasets provide a comprehensive testbed for evaluating the performance and generalizability of the embedders.

This table presents the performance of 34 different embedding models on the Massive Text Embedding Benchmark (MTEB). The models are evaluated across six different categories of downstream tasks: Classification, Clustering, Reranking, Retrieval, STS (Semantic Textual Similarity), and a second Classification category. For each model, the table shows the dimension of the embedding, the maximum number of tokens used, and the information sufficiency score (Is). The table also provides the average performance across all MTEB tasks and the performance within each task category. This allows for a comparison of model performance across various types of NLP tasks and provides context for the information sufficiency scores.

This table presents the performance of 34 different embedding models on the Massive Text Embedding Benchmark (MTEB). For each model, it shows the dimension of the embeddings, the maximum number of tokens, the information sufficiency score (Is), and the performance on several downstream tasks (classification, clustering, retrieval, STS, reranking). The table summarizes the average performance across different subsets of tasks within each task category, providing a comprehensive overview of each model’s capabilities.

This table lists the 28 models used in the molecular modeling experiments. For each model, it shows whether it uses SMILES, 2D-GNNs, or 3D-GNNs as input, the architecture used, the output size of the embeddings, and the size of the dataset it was trained on. The table highlights the variety of input modalities and model architectures used to represent molecules in the experiments.

This table lists the 34 models used in the NLP experiments. For each model, it provides the dimensionality of the embeddings, the maximum number of tokens, and the information sufficiency score (Is). The table also shows a subset of the downstream tasks used for evaluation in the NLP experiments.

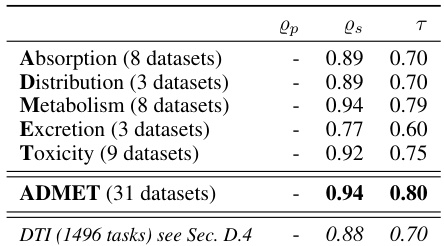
This table presents the results of the ADMET tasks (Absorption, Distribution, Metabolism, Excretion, and Toxicity) extracted from the Therapeutic Data Commons platform, focusing on the correlation between the information sufficiency score and the model’s performance on these tasks. It shows Pearson, Spearman, and Kendall correlations, along with average metrics (R² for regression and AUROC for classification). The tasks within each category are ordered by the Spearman correlation with the information sufficiency score.

This table presents the correlation between the information sufficiency (Is) score and a new clustering-based evaluation metric (Lnneighb) for four different Drug-Target Interaction (DTI) datasets. The Lnneighb metric assesses the quality of the embeddings by measuring how close the labels of a molecule are to its nearest neighbors. Different numbers of neighbors (nneighb = 1, 2, 4, 8) were considered to see how this impacted the correlation. The table shows Pearson (ρp), Spearman (ρs), and Kendall-Tau (τ) correlation coefficients for each dataset and number of neighbors, indicating the strength of the relationship between the Is score and Lnneighb.

This table provides a comprehensive overview of the 34 embedding models evaluated in the NLP experiments. For each model, it lists the model’s name, dimensionality (Dim), the maximum number of tokens used in training (Max Tokens), and the calculated information sufficiency score (Is). The Is score represents the ability of one model to simulate another and serves as a key metric in the proposed evaluation framework. The table also includes references to the model’s location on HuggingFace Hub for reproducibility.

This table presents a summary of 34 evaluated embedding models, along with their performance on the Massive Text Embedding Benchmark (MTEB). The table shows the dimension and maximum number of tokens for each model, and its information sufficiency score (Is). It also includes the performance of each model on several downstream tasks within the MTEB benchmark, including classification, clustering, retrieval, reranking, and semantic textual similarity (STS) tasks. The performance is likely represented by a metric like accuracy or another relevant metric for each task.

This table compares the performance of the proposed information sufficiency metric (Is) against three baseline methods for evaluating molecular embeddings. The baselines are: the size of the embedder model, the dimension of the embedding output (d), and the L2 reconstruction error. The table shows the Spearman (ρs), Pearson (ρp), and Kendall-Tau (τ) correlations between each baseline and the downstream task performance across various subsets of ADMET tasks (Absorption, Distribution, Metabolism, Excretion, Toxicity) and the complete ADMET dataset. The negative correlations for size, dimension, and l2 reconstruction error highlight that those methods are less effective in ranking the embedders than the proposed Is method, which shows strong positive correlations with task performance.
Full paper#


