↗ OpenReview ↗ NeurIPS Homepage ↗ Chat
TL;DR#
Current vision-language models for out-of-distribution (OOD) detection use static negative labels, causing semantic misalignment. This leads to suboptimal performance across different OOD datasets because these fixed labels do not accurately reflect the actual space of OOD images.
To address this issue, AdaNeg introduces adaptive negative proxies dynamically generated during testing. These proxies align closely with the specific OOD dataset, improving detection accuracy. By utilizing both static negative labels and adaptive proxies, AdaNeg effectively combines textual and visual knowledge. This method outperforms existing methods, notably on ImageNet, showcasing its efficiency and effectiveness, while remaining training-free and annotation-free.
Key Takeaways#
Why does it matter?#
This paper is crucial for researchers working on out-of-distribution (OOD) detection, a critical challenge in AI safety and reliability. The training-free nature and superior performance on large-scale benchmarks, particularly ImageNet, make AdaNeg a significant advancement. It opens up new avenues for research on adaptive proxy generation and efficient multi-modal knowledge integration in the context of OOD.
Visual Insights#

This figure demonstrates the misalignment issue between existing negative proxies (NegLabel) and actual OOD data, and how the proposed AdaNeg method addresses this issue. The t-SNE visualization (a) shows that AdaNeg proxies are closer to the actual OOD samples than NegLabel proxies. The histogram (b), showing the ID-Similarity to OOD Ratio (ISOR), quantitatively supports this finding; AdaNeg consistently achieves lower ISOR values, indicating better alignment with OOD characteristics.

This table presents the results of out-of-distribution (OOD) detection experiments using the ImageNet-1k dataset as the in-distribution (ID) data. It compares the performance of various methods, including those requiring training or fine-tuning, and those that are zero-shot and training-free. The performance is evaluated across four different OOD datasets: iNaturalist, SUN, Places, and Textures. The metrics used for evaluation are AUROC (Area Under the Receiver Operating Characteristic curve) and FPR95 (False Positive Rate at 95% true positive rate). Higher AUROC and lower FPR95 indicate better performance.
In-depth insights#
Adaptive NegProxies#
The concept of “Adaptive NegProxies” presents a novel approach to out-of-distribution (OOD) detection by dynamically generating negative proxies during the testing phase. This is a significant departure from traditional methods that rely on static negative labels, which often suffer from semantic misalignment with the actual OOD data distribution. The adaptive nature of these proxies allows for a closer alignment with the specific characteristics of each OOD dataset, enhancing the effectiveness of negative proxy guidance. This adaptability is achieved through a feature memory bank that selectively caches discriminative features from test images, creating proxies that are representative of the underlying OOD label space. Two types of adaptive proxies are proposed: task-adaptive and sample-adaptive. Task-adaptive proxies average features across a category to reflect unique dataset characteristics, while sample-adaptive proxies weigh features based on similarity to the individual test sample, capturing finer-grained details. By integrating both static negative labels and these adaptive proxies, the method effectively combines textual and visual knowledge, leading to improved performance in OOD detection. The method is notable for being training-free and annotation-free, thus offering significant advantages in terms of efficiency and speed.
VLM-based OOD#
Vision-Language Models (VLMs) have shown promise in out-of-distribution (OOD) detection, surpassing traditional vision-only methods. VLMs leverage multimodal knowledge, integrating visual and textual information, which allows for a richer understanding of the input data and better discrimination between in-distribution (ID) and OOD samples. This approach is particularly beneficial because textual information can provide semantic context that is often missing in image-only representations. However, challenges remain. The effectiveness of VLM-based OOD is highly dependent on the quality and relevance of the textual information used, and misalignments between textual proxies and the actual OOD distribution can significantly impact performance. Moreover, while VLMs offer improved performance, they typically require substantial computational resources and may introduce new vulnerabilities, such as sensitivity to adversarial attacks. Therefore, future research should focus on improving the robustness and efficiency of VLM-based OOD methods, potentially by exploring techniques such as adaptive proxy generation or incorporating uncertainty quantification.
Memory Bank#
The concept of a ‘Memory Bank’ in this context is crucial for the adaptive nature of the proposed OOD detection method. It acts as a dynamic store of discriminative features extracted from test images, selectively caching information deemed valuable for distinguishing between in-distribution (ID) and out-of-distribution (OOD) samples. The memory bank’s selectivity is driven by a scoring mechanism based on the confidence of classification and the similarity between the test image and the existing proxies. This selective caching allows the system to dynamically adapt to the characteristics of specific OOD datasets without explicit training, effectively building task-specific representations. The utilization of the memory bank and its interaction with the adaptive proxy generation is a key innovation, showcasing the training-free and annotation-free capabilities of the method. By leveraging this memory bank, the model transcends static label-based approaches, leading to enhanced OOD detection performance.
Label Space Issue#
The core issue revolves around the misalignment between the semantic space of pre-trained vision-language model (VLM) negative labels and the actual label space of out-of-distribution (OOD) data. Existing methods often rely on static negative labels, which may not accurately represent the visual characteristics of diverse OOD datasets. This semantic gap hinders the effectiveness of negative proxy guidance in OOD detection. The problem manifests as inconsistent performance across different OOD benchmarks, demonstrating the limitations of a fixed, general-purpose negative label set. Therefore, there’s a crucial need for methods that can dynamically adapt to the nuances of the underlying OOD data distributions to improve the accuracy and robustness of OOD detection. The solution necessitates techniques that bridge this semantic gap, enabling VLMs to better discriminate between in-distribution and out-of-distribution samples.
OOD Benchmarks#
Out-of-distribution (OOD) detection benchmarks are crucial for evaluating the robustness of machine learning models. A robust benchmark should include a diverse range of datasets representing various data distributions and characteristics, such as ImageNet, CIFAR-10/100, and others. The selection of in-distribution (ID) and OOD datasets significantly influences the evaluation results, highlighting the importance of carefully chosen benchmarks to reflect real-world scenarios. Metrics like AUROC and FPR95 are commonly used but have limitations. Future benchmarks should address this by potentially incorporating human evaluation to better capture the nuances of model performance and account for subjective aspects of OOD detection. The development of standardized and widely accepted OOD benchmarks is essential for fostering progress in the field and enabling fair comparisons of different OOD detection methods. This would promote the development of more generalizable and robust algorithms suitable for real-world deployment.
More visual insights#
More on figures

This figure illustrates the AdaNeg framework. It starts with a test image, which is processed by an image encoder to get image features. These features, along with features from a text encoder processing ID and negative labels, are used to generate a multi-modal score for OOD detection. A key component is the feature memory bank, which selectively caches discriminative features from test images to dynamically generate adaptive negative proxies, improving OOD detection accuracy. The memory bank updates without requiring further optimization during testing.

The figure shows the impact of three hyperparameters (threshold γ, gap value g, and memory length L) on the performance of the AdaNeg model for out-of-distribution (OOD) detection on the ImageNet dataset. Each subfigure displays the AUROC (Area Under the Receiver Operating Characteristic curve) for both near-OOD and far-OOD datasets as a function of the hyperparameter. This helps to determine optimal values for these hyperparameters that balance performance across near and far OOD scenarios.

This figure analyzes the impact of three hyperparameters (threshold γ, gap value g, and memory length L) on the performance of the AdaNeg method for out-of-distribution (OOD) detection using the ImageNet dataset. Each subplot shows how AUROC and FPR95 vary as the corresponding hyperparameter changes, providing insights into their optimal settings for different OOD scenarios. The results suggest that moderate values of γ, appropriately tuned gap values based on OOD difficulty (near vs. far), and a sufficient memory length are important for achieving optimal performance.
More on tables

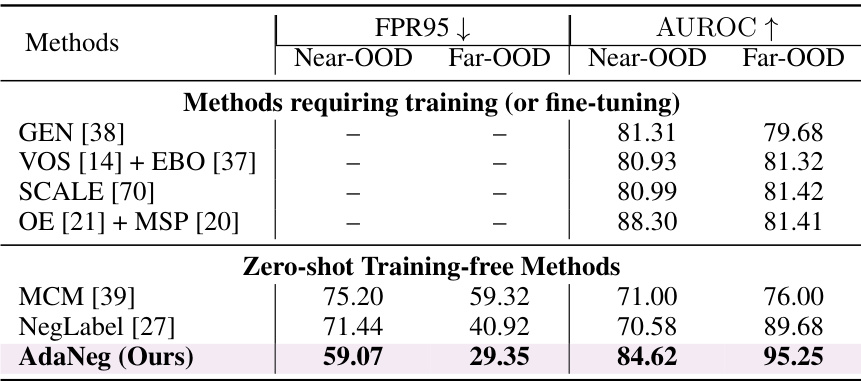
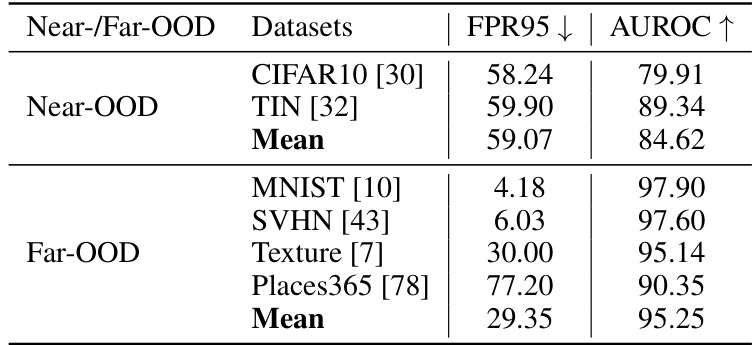
This table presents the results of out-of-distribution (OOD) detection experiments conducted on the OpenOOD benchmark. The ImageNet-1k dataset is used as the in-distribution (ID) dataset. The table compares various OOD detection methods, categorized into methods requiring training/fine-tuning and zero-shot training-free methods. For each method, it reports the AUROC (Area Under the Receiver Operating Characteristic curve) and FPR95 (False Positive Rate at 95% true positive rate) metrics for both near-OOD and far-OOD datasets. Additionally, the ID accuracy (ACC) is provided for each method. Full results including detailed breakdowns for individual OOD datasets within the near-OOD and far-OOD categories can be found in Table A7 of the appendix.

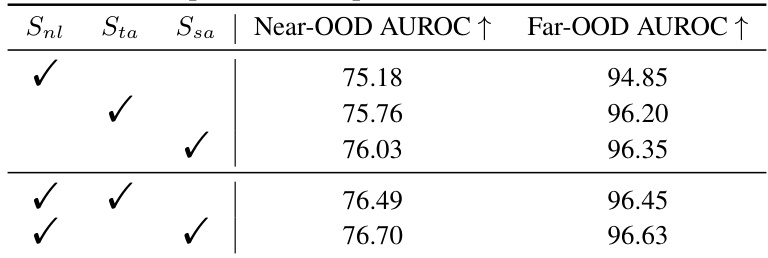
This table compares the performance of different score functions used for out-of-distribution (OOD) detection. It shows the results for Near-OOD and Far-OOD AUROC using three different scoring methods: Snl (NegLabel’s score), Sta (task-adaptive proxy score), and Ssa (sample-adaptive proxy score). The results demonstrate the impact of incorporating adaptive proxies into the OOD detection process, showing that combining them with the original NegLabel scoring function achieves the best performance.

This table presents a comparison of different OOD detection methods on the ImageNet dataset. The table shows the Area Under the Receiver Operating Characteristic curve (AUROC) and False Positive Rate at 95% true positive rate (FPR95) for four different OOD datasets: iNaturalist, SUN, Places, and Textures. The methods are categorized into those requiring training (or fine-tuning) and those that are zero-shot training-free. The table highlights the superior performance of the AdaNeg method compared to existing methods.

This table presents the False Positive Rate at 95% recall (FPR95) for different ID-OOD sample ratios. The results compare the performance of NegLabel, AdaNeg, and AdaNeg with AdaGap (an improved version of AdaNeg). The results show that the AdaNeg methods generally outperform NegLabel, and AdaNeg with AdaGap is especially effective at handling imbalanced datasets, with the lowest FPR95 across most ratios.

This table presents the OOD detection results on the BIMCV-COVID19+ dataset using two methods: NegLabel and AdaNeg. The BIMCV-COVID19+ dataset contains medical images (CT-SCAN and X-Ray-Bone) and is used as an OOD dataset while another dataset is used as an in-distribution dataset. The table shows the AUROC (Area Under the Receiver Operating Characteristic curve) and FPR95 (False Positive Rate at 95% true positive rate) for each method on each dataset, along with the average performance across both OOD datasets. It demonstrates the improvement achieved by AdaNeg compared to the baseline NegLabel method.

This table presents the results of out-of-distribution (OOD) detection experiments conducted on the OpenOOD benchmark. The ImageNet-1k dataset is used as the in-distribution (ID) dataset. The table shows the performance of various methods, including methods requiring fine-tuning and zero-shot training-free methods. The performance is evaluated using AUROC and FPR95 metrics for both near-OOD and far-OOD datasets. Detailed results are available in Table A7 in the appendix.

This table presents a comparison of various OOD detection methods on the ImageNet-1k dataset using four different OOD datasets (iNaturalist, SUN, Places, and Textures). It shows the AUROC (Area Under the Receiver Operating Characteristic curve) and FPR95 (False Positive Rate at 95% true positive rate) for each method. The methods are categorized into those that require training or fine-tuning and those that are zero-shot and training-free. The table highlights the performance of the proposed AdaNeg method compared to existing state-of-the-art techniques.

This table presents the results of OOD detection experiments conducted on the OpenOOD benchmark. The ImageNet-1k dataset is used as the in-distribution (ID) dataset. The table compares the performance of various methods, including the proposed AdaNeg method, on near-OOD and far-OOD datasets using AUROC and FPR95 metrics. Full results are available in Table A7 of the appendix.

This table presents a comprehensive evaluation of OOD detection performance using CIFAR100 as the in-distribution (ID) dataset. It compares the performance of the proposed AdaNeg method against existing state-of-the-art techniques in detecting out-of-distribution (OOD) samples across both near-OOD and far-OOD datasets. The results are shown in terms of FPR95 (False Positive Rate at 95% true positive rate) and AUROC (Area Under the Receiver Operating Characteristic curve). Lower FPR95 and higher AUROC values indicate better OOD detection performance.

This table presents the out-of-distribution (OOD) detection results obtained using the AdaNeg method with various Vision-Language Models (VLMs) as backbones. The results are evaluated using the ImageNet-1K dataset as the in-distribution (ID) dataset, and the performance is measured by AUROC (Area Under the Receiver Operating Characteristic curve) and FPR95 (False Positive Rate at 95% true positive rate) for four different OOD datasets: iNaturalist, SUN, Places, and Textures. The table allows comparison of AdaNeg’s performance across different VLM architectures, providing insights into the impact of the backbone model on OOD detection accuracy.

This table presents the results of combining AdaNeg with two other methods, NegPrompt and LAPT, using the ImageNet dataset as the in-distribution data. The FPR95 (False Positive Rate at 95% true positive rate) metric is used to evaluate the performance of OOD detection. Lower FPR95 values indicate better performance. The results demonstrate that adding AdaNeg consistently improves the performance of both NegPrompt and LAPT across various out-of-distribution datasets, showcasing the effectiveness of AdaNeg in enhancing OOD detection.

This table presents the False Positive Rate at 95% true positive rate (FPR95) for the NegLabel and AdaNeg methods under different numbers of test samples. The experiment uses ImageNet as the in-distribution (ID) dataset and SUN as the out-of-distribution (OOD) dataset, maintaining a consistent 5:4 ratio of ID to OOD samples. The results show how the performance of both methods changes as the number of test samples increases, demonstrating the robustness of AdaNeg across various sample sizes.
Full paper#


