↗ OpenReview ↗ NeurIPS Homepage ↗ Chat
TL;DR#
Many real-world datasets suffer from class imbalance, where some classes have significantly more data than others. This leads to deep learning models performing poorly on underrepresented classes. Existing re-weighting methods often fail to adequately address this issue because they don’t adapt well to the changing data distributions during training.
This paper introduces a new method called RDR (Re-weighting with Density Ratio) that uses density ratio estimation to dynamically adjust the weights of different classes during training. This adaptive approach ensures that the model is always focusing on the underrepresented classes, even as the data distribution shifts over time. Experiments on several benchmark datasets show that RDR leads to significant improvements in accuracy and generalizability compared to existing methods, especially in cases of severe class imbalance.
Key Takeaways#
Why does it matter?#
This paper is important because it addresses the critical issue of imbalanced datasets in deep learning, a prevalent problem in real-world applications. By proposing a novel re-weighting method, RDR, it offers a more robust and adaptable solution than existing techniques. The generalization bound analysis and extensive experimental results provide strong evidence of its effectiveness, making it a significant contribution to the field. RDR’s dynamic adaptation to class distributions opens new avenues for research into class imbalance.
Visual Insights#

This figure shows the dynamic trend of RDR weights in different categories (many and few) throughout the training process. The RDR weights show an inverse relationship with B’, a value calculated based on the minimal prediction on the ground truth class. This demonstrates that RDR weights effectively adapt to the changing importance of classes during training, aligning well with the theoretical prediction. The experiment was done using the CIFAR-10-LT dataset with an imbalance factor of 10.

This table presents the top-1 accuracy results for four long-tailed image classification datasets. The results are categorized by dataset and imbalance factor (IF). The IF represents the ratio between the number of samples in the most frequent class and the least frequent class. Lower IF indicates a less severe imbalance problem. The table compares the performance of several common loss functions (Cross Entropy, Focal Loss, Class-Balanced Loss, and Logit Adjustment) with and without the proposed RDR method.
In-depth insights#
Density Ratio RDR#
The proposed Re-weighting with Density Ratio (RDR) method offers a novel approach to handling class imbalance in training data. It dynamically adjusts class weights during training, mitigating overfitting on majority classes and improving generalization. This is achieved by using density ratio estimation to continuously adapt weights to changing class densities, addressing limitations of prior static re-weighting methods. Real-time density ratio estimation using feature extractors enhances adaptability. RDR shows promising results in experiments, especially with severe class imbalance. Robustness and adaptability are key features, highlighting its potential as a valuable tool for imbalanced learning problems.
Dynamic Weighting#
Dynamic weighting, in the context of imbalanced learning, is a crucial technique to address the class imbalance problem. It involves assigning weights to samples or classes during training, adaptively adjusting the influence of each class to mitigate the dominance of the majority class and improve the model’s performance on underrepresented classes. This adaptive nature distinguishes it from static weighting, where weights remain constant throughout the training process. The effectiveness of dynamic weighting hinges on the method used to determine the weights. Successful methods typically leverage real-time information about the training process, class distributions, or even model performance itself to dynamically adjust weights. This approach enhances the model’s ability to learn from imbalanced data and generalize well to unseen data, leading to more robust and fair predictions.
Imbalanced Datasets#
Imbalanced datasets, where some classes significantly outnumber others, pose a major challenge in machine learning. Standard algorithms often exhibit bias toward the majority class, leading to poor performance on the minority classes, which are frequently the most critical. This issue is prevalent in real-world applications like medical diagnosis and fraud detection, where misclassifying minority instances can have severe consequences. Addressing this requires techniques that re-weight samples, oversample minority classes, or undersample majority classes to balance the class distribution. Recent methods employ density ratio estimation to dynamically adjust class weights, enhancing model adaptability and performance, particularly in scenarios with severely skewed data. Generalization bounds offer theoretical justification for these approaches and emphasize the importance of accurately reflecting class distribution during training for robust model behavior.
Generalization Bounds#
Generalization bounds in machine learning offer a crucial perspective on a model’s ability to generalize beyond its training data. Tight bounds are highly desirable, indicating strong generalization capacity, implying that the model’s performance on unseen data will closely reflect its training performance. Conversely, loose bounds raise concerns, suggesting potential overfitting and unreliable performance on new data. Analyzing generalization bounds involves considering factors such as model complexity, data distribution, and the learning algorithm. Understanding these bounds helps to guide model selection and hyperparameter tuning, allowing researchers to build robust models that reliably generalize to real-world scenarios. The study of generalization bounds is an active area of research, with ongoing efforts to refine theoretical analyses and develop more practical techniques for assessing a model’s generalization capabilities.
Future Works#
The paper’s core contribution is a novel re-weighting method, RDR, which dynamically adjusts class weights during training for imbalanced datasets. Future work could explore several promising avenues. First, extending RDR to handle extremely large-scale datasets, such as those encountered in some real-world applications (e.g., image recognition with millions of classes) by exploring more computationally efficient density ratio estimation techniques would be valuable. Second, rigorous theoretical analysis of RDR’s generalization properties under various levels of class imbalance would strengthen the method’s foundation. Third, investigating RDR’s robustness to noisy labels and its sensitivity to hyperparameter tuning is crucial for practical implementation. Finally, applying RDR to diverse tasks beyond image classification, such as imbalanced regression or time series analysis, to demonstrate its wider applicability would be significant. Detailed comparisons with other state-of-the-art long-tailed learning methods on various benchmark datasets should be included as well. Addressing these areas would solidify RDR’s position as a robust and versatile tool in the arsenal of imbalanced learning techniques.
More visual insights#
More on figures

This figure shows the dynamic relationship between RDR weights and the term B’ during the training process on the CIFAR-10-LT dataset, which has an imbalance factor of 10. The plots illustrate how the weights for both many-category and few-category samples change over epochs. It shows that the RDR weights exhibit an inverse relationship to B’, suggesting that RDR effectively adapts its weighting strategy to balance class distributions during training.

This figure compares the training time of four different methods: Cross-Entropy (CE), Re-weighting with Density Ratio (RDR), Sharpness-Aware Minimization (SAM), and a combination of RDR and SAM (SAM(RDR)) on two datasets, CIFAR-10-LT and CIFAR-100-LT. The bar charts show that RDR and SAM are relatively more computationally expensive than CE, but SAM(RDR) is the most computationally expensive. The time cost is measured in seconds for 200 training epochs.

This figure visualizes the impact of noise on the performance of different methods across two datasets (CIFAR-10-LT-NL and CIFAR-100-LT-NL) with varying levels of class imbalance (IF=10 and IF=100). It compares the performance of baseline methods (CE, LA) with and without the addition of the RDR and SAM techniques.

This figure illustrates the framework of the Re-weighting with Density Ratio (RDR) method. The left side shows the ordinary process of feature extraction (f) and classification (g), where the feature extractor learns features from the training data and updates its feature prototypes using a momentum update mechanism. The extracted features are then used by the classifier for classification. The right side shows the dynamic re-weighting process. The RDR method dynamically adjusts the weights of different classes by using the density ratio estimation. The weights are calculated based on the difference between the balanced data distribution and the real data distribution. The figure highlights the difference between constant re-weighting and dynamic re-weighting. Constant re-weighting doesn’t adapt to changes during training, while dynamic re-weighting adjusts the importance of each class during training, thereby mitigating learning disparities in imbalanced distributions.

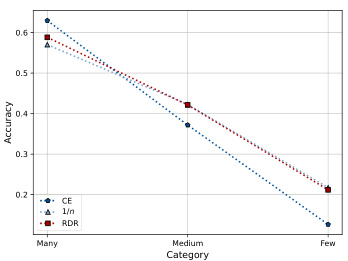
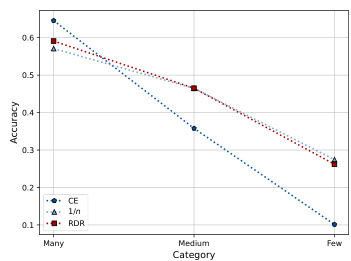
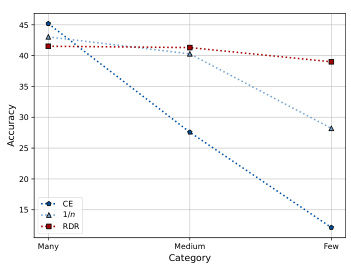
This figure visualizes the top-1 accuracy achieved by three different methods (Cross-Entropy, Inverse Frequency weighting, and the proposed Re-weighting with Density Ratio method) across three categories of classes (Many, Medium, Few) in the CIFAR-100-LT dataset. The results are shown for two different imbalance factors (IF): 10 and 100. The plots show how the accuracy changes depending on the method and the imbalance in the dataset. This illustrates the effect of the proposed RDR method on mitigating the performance drop caused by class imbalance.

This figure visualizes the top-1 accuracy achieved by three different methods (CE, Inverse Frequency, and RDR) across three categories of classes (Many, Medium, Few) in the CIFAR-100-LT dataset. It shows results under two different imbalance factors (IF=10 and IF=100). The plots illustrate how the accuracy changes across categories for each method and imbalance level, showcasing the relative performance of each approach in handling class imbalance.

This figure visualizes the top-1 accuracy achieved by three different methods (Cross-Entropy, Inverse Frequency, and the proposed Re-weighting with Density Ratio method) across three categories of classes (Many, Medium, and Few) in the CIFAR-100-LT dataset. Two different imbalance factors (IF=10 and IF=100) are shown, illustrating the performance under varying levels of class imbalance. The plots demonstrate how the proposed RDR method performs compared to the baselines, especially in the more challenging scenarios with a higher imbalance factor and fewer samples.

This figure compares the performance of three different methods (Cross-Entropy, Inverse Frequency, and Re-weighting with Density Ratio) in classifying images from the CIFAR-100-LT dataset under two different imbalance factors (10 and 100). The x-axis represents the category of images (Many, Medium, Few), and the y-axis shows the accuracy. The plots demonstrate how each method performs across these categories, with a focus on the difference in performance under varying levels of class imbalance.

This figure shows the performance comparison of three different methods (Cross Entropy, Inverse Frequency, and Re-weighting with Density Ratio) on CIFAR-100-LT dataset in terms of top-1 accuracy across different categories (Many, Medium, and Few). The comparison is shown for two different imbalance factors (10 and 100). The results indicate that RDR generally outperforms the other two methods, especially when the imbalance factor is high.

This figure visualizes the top-1 accuracy achieved by three different methods (Cross-Entropy, Inverse Frequency, and Re-weighting with Density Ratio) across three categories of classes (Many, Medium, Few) in the CIFAR-100-LT dataset. Two different imbalance factors (IF=10 and IF=100) are shown, comparing the performance of each method under varying levels of class imbalance. The plots demonstrate how each method’s accuracy changes as the number of samples per class decreases.

This figure visualizes the top-1 accuracy achieved by three different methods (Cross-Entropy, Inverse Frequency, and Re-weighting with Density Ratio) across three categories of classes (Many, Medium, Few) in the CIFAR-100-LT dataset. The results are shown for two different imbalance factors (IF=10 and IF=100). It demonstrates the performance difference of the three methods in handling imbalanced datasets.

The figure shows the performance comparison of three different methods (Cross-Entropy loss, Inverse Frequency weighting, and the proposed Re-weighting with Density Ratio) in addressing class imbalance on the CIFAR-100-LT dataset. The results are categorized into three groups (Many, Medium, Few) based on the number of samples in each class. The plots illustrate how each method performs under two imbalance factors (IF=10 and IF=100), highlighting the impact of class imbalance on model accuracy.
More on tables

This table presents the top-1 accuracy results on four benchmark datasets (CIFAR-10-LT, CIFAR-100-LT, ImageNet-LT, and Places-LT) using different imbalance factors (10 and 100). It compares the performance of the proposed RDR method (with and without the addition of CE and LA loss functions) against several baseline methods (CE, Focal, CB, LA, ImbSAM, and CCSAM) for overall class accuracy. The results demonstrate the effectiveness of the RDR approach, particularly under high imbalance factors.

This table presents a comparison of loss landscape metrics for different methods on the CIFAR-10-LT dataset with an imbalance factor of 100. It shows the average minimum eigenvalue (λmin), average maximum eigenvalue (λmax), and the trace of the Hessian matrix (Tr(H)) for classes with few samples. Lower λmax and Tr(H) values indicate a flatter loss landscape, which generally improves model generalization. Higher λmin values suggest that the model is less likely to get stuck in saddle points.

This table presents the top-1 accuracy results for different long-tailed image classification datasets. It compares the performance of several baseline methods (Cross Entropy, Focal Loss, Class Balanced Loss, Logit Adjustment) against the proposed RDR method, both independently and in combination with SAM (Sharpness-Aware Minimization). The results are shown for the overall classes in the dataset and are broken down by imbalance factor (10 and 100) for CIFAR datasets.

This table presents the top-1 accuracy results achieved by different methods on four long-tailed image classification datasets: CIFAR-10-LT, CIFAR-100-LT, ImageNet-LT, and Places-LT. For CIFAR-10-LT and CIFAR-100-LT, results are shown for two imbalance factors (10 and 100). The methods compared include several baselines (CE, Focal, CB, LA) and the proposed RDR method combined with both CE and LA. The table showcases the overall performance across all classes in each dataset.

This table presents the top-1 accuracy results for overall classes across four long-tailed image classification datasets: CIFAR-10-LT, CIFAR-100-LT, ImageNet-LT, and Places-LT. For CIFAR-10-LT and CIFAR-100-LT, results are shown for two imbalance factors (10 and 100). The table compares the performance of several methods, including the baseline cross-entropy loss (CE), Focal loss, Class-balanced loss (CB), and Logit Adjustment (LA), along with the proposed Re-weighting with Density Ratio (RDR) method combined with each of the baselines (RDR+CE and RDR+LA). It provides a comprehensive overview of the relative performance of different approaches on long-tailed classification tasks with varying levels of class imbalance.

This table presents the top-1 accuracy results for overall classes across four different datasets: CIFAR-10-LT, CIFAR-100-LT, ImageNet-LT, and Places-LT. The CIFAR datasets are evaluated under two imbalance factors (10 and 100), while ImageNet-LT and Places-LT have their inherent imbalance ratios. The table compares the performance of several methods including the baseline Cross-Entropy loss (CE), Focal Loss, Class-Balanced Loss, and Logit Adjustment. It also presents results for the proposed RDR method combined with each of the baselines.
Full paper#


