↗ OpenReview ↗ NeurIPS Homepage ↗ Chat
TL;DR#
Causal inference from observational data is critical but challenging, especially for high-dimensional data like images. Existing methods often struggle with the computational complexity of estimating conditional likelihoods or require strong assumptions about the underlying causal model, limiting their applicability to real-world scenarios with unobserved confounders. This paper tackles this challenge head-on.
The paper introduces ID-GEN, a novel algorithm that leverages the power of conditional generative models (like diffusion models) to sample from any identifiable interventional distribution. Instead of directly estimating complex probability distributions, ID-GEN uses a sequence of push-forward computations through a series of connected conditional generative models, making high-dimensional causal inference feasible and efficient. Experiments on Colored MNIST, CelebA, and MIMIC-CXR datasets demonstrate the effectiveness and versatility of the approach.
Key Takeaways#
Why does it matter?#
This paper is crucial for researchers working with high-dimensional data in causal inference. It offers a novel, model-agnostic algorithm (ID-GEN) for interventional sampling, solving a critical limitation of existing methods. This opens new avenues for causal analysis in various fields like medicine and computer vision, impacting studies involving images, text, and other complex data types.
Visual Insights#

This figure illustrates the proposed algorithm ID-GEN for generating interventional samples from a high-dimensional distribution. It shows how a sequence of conditional generative models are used to sample from a desired interventional distribution, specifically P(r|do(x)), which is the interventional distribution of the report (R) given an intervention on the x-ray (X). The top panel illustrates a causal graph showing that hospital location (H) is a confounder between X and R. Part (a) shows how intervening on X removes the confounding bias introduced by H. Part (b) shows the training of conditional generative models, one for each factor in the factorization of P(r|do(x)). Part (c) depicts the merging of these models to create a sampling network, which is used to generate samples from the desired interventional distribution.

This table compares the results obtained from three different methods for generating samples from the Napkin-MNIST dataset: a diffusion model, the original dataset, and an analytically computed distribution. The comparison is made using several metrics for the digit, color, and thickness of the generated images, revealing the accuracy of each method.
In-depth insights#
Causal Effect Sampling#
Causal effect sampling presents a powerful paradigm shift in causal inference, especially when dealing with high-dimensional data. The core challenge lies in accurately estimating interventional distributions, which describe the outcome after manipulating a variable. Traditional methods often struggle with high-dimensional data due to computational complexity. This is where novel approaches employing deep generative models become crucial. These models learn to approximate complex relationships between variables and can generate samples from interventional distributions. However, ensuring the soundness and completeness of these generative approaches is vital. A key aspect involves developing algorithms that guarantee faithful representation of causal mechanisms, allowing for accurate sampling. Addressing the presence of unobserved confounders in high-dimensional settings remains a significant challenge. Effective strategies for handling confounding bias are needed to ensure causal effect estimates are not misleading. The development of efficient and scalable algorithms for causal effect sampling is also a significant area of ongoing research. Overall, causal effect sampling combines the power of causal inference with the expressiveness of deep learning, opening new possibilities in trustworthy machine learning.
ID-GEN Algorithm#
The ID-GEN algorithm cleverly leverages conditional generative models to address the challenge of high-dimensional causal inference. Its recursive nature mirrors the ID algorithm, breaking down complex interventional queries into smaller, manageable parts. This approach is particularly useful for high-dimensional data like images and text, where traditional likelihood-based methods struggle. By training a separate conditional generative model for each factor identified by ID, and connecting them to create a sampling network, ID-GEN can efficiently generate samples from complex interventional distributions. This framework is demonstrated to be sound and complete, implying that conditional generative models are sufficient for high-dimensional interventional sampling given any identifiable causal query. The algorithm’s modularity enhances its flexibility, allowing researchers to integrate any suitable generative model, and the use of diffusion models is particularly notable. However, the algorithm’s performance remains dependent on the quality and training of the generative models and assumes access to a correctly specified causal graph, which are both areas for potential improvement and further investigation.
High-Dim. Intervention#
High-dimensional intervention in causal inference tackles the challenge of estimating causal effects when dealing with high-dimensional data, such as images or text. Traditional methods often struggle with this due to the computational cost and difficulty in estimating high-dimensional conditional distributions. This research focuses on overcoming these limitations by utilizing conditional generative models, like diffusion models, to efficiently sample from interventional distributions. The core idea is to leverage the power of these models to approximate complex high-dimensional probability distributions, making causal inference tractable even in challenging settings with latent confounders. The significance lies in enabling causal analysis for high-dimensional data where direct likelihood-based approaches are impractical. This approach enables both the estimation of causal effects and the generation of interventional samples, facilitating a more thorough causal analysis with high-dimensional variables. The methodology highlights the importance of carefully constructing a sampling network which leverages feed-forward steps to enable efficient ancestral sampling, avoiding the pitfalls of direct sampling in complex high-dimensional scenarios.
Generative Models#
Generative models are revolutionizing causal inference, particularly when dealing with high-dimensional data like images. The ability of these models to approximate complex probability distributions is crucial, overcoming the limitations of traditional methods that struggle with the computational cost of high-dimensional marginalization. The paper highlights how conditional generative models, such as diffusion models, can be effectively employed within a structured approach to sample from interventional distributions. This framework leverages the power of generative models to address high-dimensional data in a way that is both sound and complete. The methodology addresses limitations of existing techniques, which often struggle with high dimensionality, unobserved confounders, and the need to simultaneously train multiple models. The proposed approach offers a recursive, factorized strategy, which greatly simplifies the learning process and allows for the efficient utilization of pre-trained generative models. The success of this methodology is demonstrated through compelling empirical results using Colored MNIST, CelebA, and MIMIC-CXR datasets, showcasing its applicability to various data types. A key benefit is the interpretability of results, allowing for causal analysis and evaluation of spurious correlations. The work’s theoretical underpinnings are strong, providing soundness and completeness guarantees. Overall, the application of generative models within a principled causal framework provides a significant advancement in the field.
Future Research#
Future research directions stemming from this work could explore several key areas. Extending the algorithm to handle more complex causal structures, such as those with latent confounders or unobserved variables, is crucial for broader applicability. This might involve incorporating more sophisticated causal discovery techniques or developing novel methods for handling uncertainty in the causal graph. Another important direction is improving the efficiency of the proposed algorithm, particularly for high-dimensional data. This could involve exploring more efficient generative models, optimizing the training process, or developing parallel computation strategies. Investigating the robustness of the algorithm to violations of its assumptions is also essential, such as the assumption of semi-Markovianity and the availability of a correctly specified causal graph. It’s crucial to assess the algorithm’s performance in real-world scenarios with noisy data and confounding factors. Further work could explore applications to other domains, beyond image and text data, such as genomics, finance, or social networks. A particularly important area would be developing rigorous methods for evaluating the causal effects estimated by the algorithm in high-dimensional settings. Existing metrics might be inadequate, requiring development of new methods that better account for the complexities of high-dimensional interventional distributions.
More visual insights#
More on figures

This figure illustrates how ID-GEN merges sampling networks to sample from a causal query with latent confounders. The causal graph has unobserved confounders represented by ↔. ID-GEN factorizes the query into sub-problems (represented by the blue samples from Px,w2 (W1,y) and Px,w₁ (W2)). Then, it trains conditional models for each sub-problem and merges them into a single sampling network, to finally generate samples from the desired distribution Px(y).

This figure illustrates the process of ID-GEN algorithm for sampling from a high-dimensional interventional distribution P(y|do(w1)). The left panel shows the top-down factorization of the query according to the ID algorithm steps and illustrates how the algorithm decomposes the problem into subproblems to address high-dimensionality. Each subproblem involves training a set of conditional generative models. The right panel shows the bottom-up merge process of the sampling network, connecting the trained models to build a single network capable of generating samples from the desired interventional distribution.

This figure shows the results of an experiment on a semi-synthetic Colored-MNIST dataset. The left panel displays a causal graph illustrating the relationships between variables (W1, W2, X, Y) with unobserved confounders (Ucolor and Uthickness). The center panel presents FID scores, a measure of image quality, for different algorithms (Conditional, DCM, NCM, Ours) in generating images of digits 3 and 5 with specific colors. Lower FID scores indicate better image quality. The right panel shows the total variation distance (TVD) between the likelihoods calculated from generated images and true likelihoods, with lower TVD suggesting closer matches to the ground truth. The results demonstrate that the proposed approach (Ours) outperforms baseline methods in generating higher-quality images that more accurately reflect the true distribution.

This figure demonstrates the causal graph used to perform interventional sampling on the CelebA dataset. The graph shows that the image I1 is influenced by attributes Male and Young, with a latent confounder between them. The algorithm trains conditional models for each factor to generate samples from P(I2|do(Male=0)). The bar chart visualizes the correlation between various attributes and the Male attribute, highlighting the effect of intervening on the Male attribute using two different generative models.

This figure compares the baseline causal graph with the true causal graph proposed by the authors. The baseline assumes a direct relationship between the report and X-ray image, while the true graph includes latent confounders and intermediate variables such as pneumonia, pleural effusion, and atelectasis, which are more causally related to the X-ray image. The right side shows sample images generated for different prompts with and without pneumonia, along with the likelihood of each inferred attribute (blue highlighting indicates changes from a healthy case).

This figure shows how the proposed algorithm, ID-GEN, handles high-dimensional interventional sampling in the presence of latent confounders. It illustrates the process for the report-to-X-ray generation task. The algorithm factorizes a complex causal query (P(v|do(r))) into simpler factors, trains conditional generative models for each factor, and merges these models into a neural network. The intervention, do(R=r), is then applied to remove confounding bias. Ancestral sampling through the resulting network generates samples from the desired high-dimensional interventional distribution.

This figure demonstrates how ID-GEN addresses cyclic dependency issues that may arise when training generative models for causal inference. It shows a causal graph with confounding variables and unobserved confounders between X and Y. ID-GEN addresses this issue by factorizing the joint distribution P(x, y) into two factors and training conditional generative models for each factor and merging them to build a sampling network for generating interventional samples.

This figure compares different approaches to high-dimensional causal inference, highlighting the challenges of existing methods in handling high-dimensional data and unobserved confounders. It shows how the proposed ID-GEN algorithm addresses these challenges by employing conditional generative models, specifically diffusion models, to efficiently sample from interventional distributions.

This figure illustrates a possible recursive route of the ID-GEN algorithm for a causal query P(y|do(x)). Each node represents a step in the algorithm, with red edges indicating the top-down phase and green edges indicating the bottom-up phase. Rectangular boxes represent functions used by the algorithm. The figure helps to understand the recursion steps of the ID-GEN algorithm.

This figure illustrates a possible recursive trace of the ID-GEN algorithm for a causal query P(y|do(x)). The different colors of edges indicate the direction of the recursion (top-down and bottom-up). Each box represents a function call within the ID-GEN algorithm (ConditionalGMs, MergeNetwork, Update). The numbers within the boxes represent line numbers within the ID-GEN algorithm, indicating the execution flow in the algorithm.

This figure shows a possible recursive route of ID-GEN for a causal query P(y|do(x)). It illustrates the steps ID-GEN takes, the conditions for each step, and how the algorithm recursively breaks down the problem. Red edges represent the top-down phase, while green edges indicate the bottom-up phase. Gray boxes highlight the functions ID-GEN uses for high-dimensional sampling.

This figure shows a possible recursive route of ID-GEN for a causal query P(y|do(x)). At any recursion level, it checks conditions for 7 steps (S1-S7) and enters one step based on the satisfied conditions. Red edges indicate the top-down phase, and green edges indicate the bottom-up phase. Gray boxes represent functions that allow ID-GEN to sample from high-dimensional interventional distributions. The figure helps readers understand the recursion route.

This figure illustrates the proposed algorithm ID-GEN. It shows how to sample from any identifiable interventional distribution, specifically P(r|do(x)), by factorizing it into c-factors and using conditional generative models. Panel (a) depicts the problem of x-ray to report generation with unobserved confounding. Panel (b) shows how conditional generative models are trained for each factor. Panel (c) displays how the models are merged to generate samples from P(r|do(x)). The algorithm addresses the challenges of high-dimensional data and unobserved confounders in causal inference.

This figure visualizes joint samples from the Napkin-MNIST dataset. The first row shows the latent variable color, the second row shows the latent variable thickness, and the third row shows a discrete variable W2 that contains both color and digit information (digit is shown as the number of dots). The figure demonstrates how noise sometimes prevents information from being passed down the causal graph.
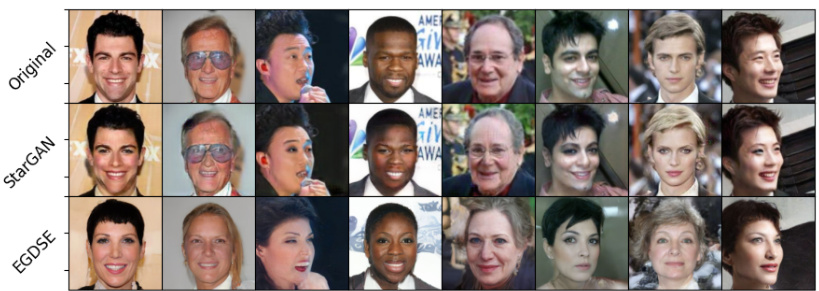
This figure shows the results of applying the ID-GEN algorithm to translate images from the male domain to the female domain. The first row shows the original male images. The second row shows the images translated using the StarGAN model. The third row shows the images translated using the EGSDE model. The results show that both models are able to successfully translate the images, however, the quality of the translated images varies depending on the model used. The StarGAN model produces blurry images, while the EGSDE model produces sharper images. This demonstrates the ability of ID-GEN to generate high-quality samples from a high-dimensional interventional distribution.
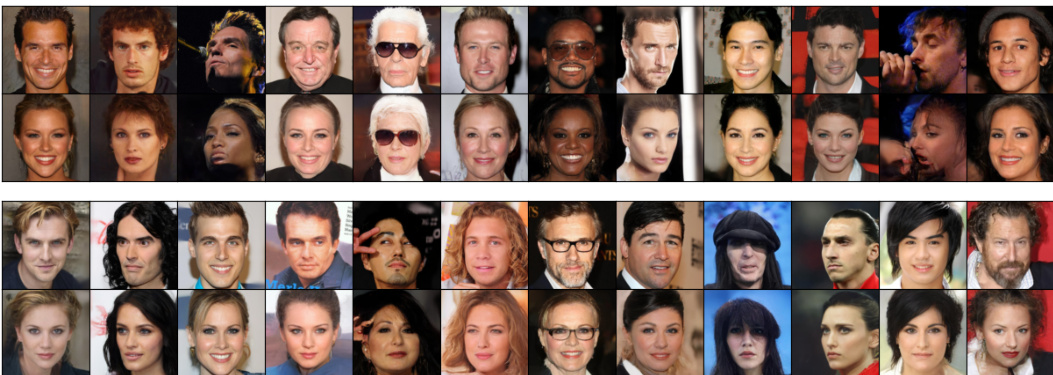
This figure shows the results of multi-domain image translation using the EGSDE model. The top two rows display the original male images, and the bottom two rows show the corresponding female images generated by EGSDE. The caption notes that, across all generated images, 29.16% were translated as ‘young’. This highlights EGSDE’s ability to transform images between domains while also demonstrating some biases in the model’s output (e.g., a tendency to generate younger-appearing female faces).

This figure shows the results of applying two different image translation models, StarGAN and EGSDE, to translate male faces (original images) into female faces. The first row displays the original male faces. The second row shows the female faces generated by StarGAN, and the third row displays the female faces generated by EGSDE. The results illustrate the differences in the image quality and the types of translations performed by each model. It helps to visually compare the performance of the two models in achieving realistic and varied translations. This figure is part of the CelebA experiment section, showcasing the algorithm’s application to a real-world dataset.
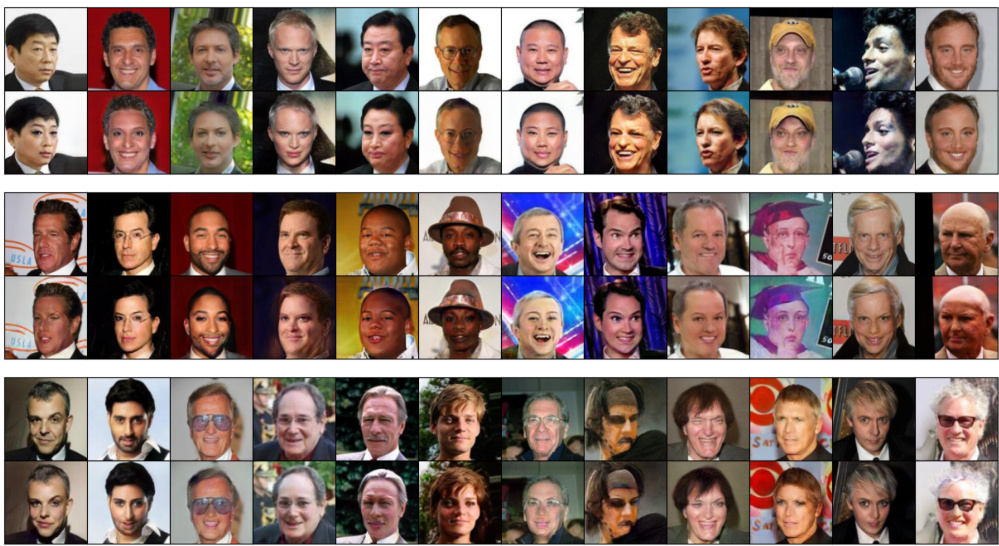
This figure shows the results of a multi-domain image translation experiment using the EGSDE model. The top row shows the original male images, and the bottom row shows the corresponding female images generated by the model after translation. The model successfully translates the images, changing various attributes such as age and appearance. Notably, a significant percentage (29.16%) of the translated images appear as young.
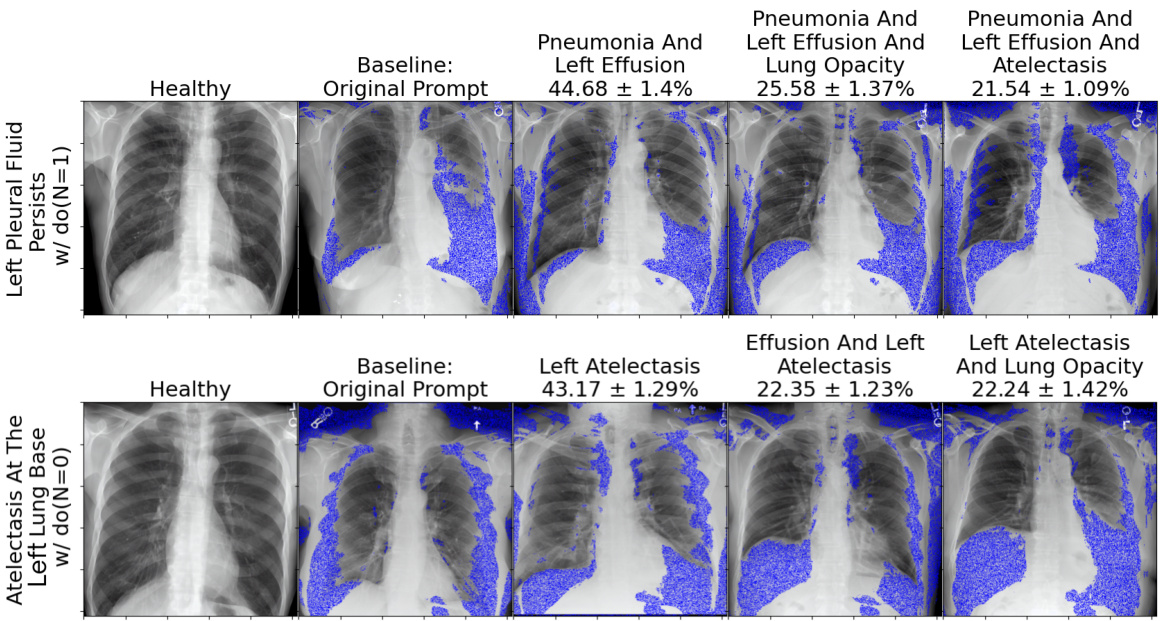
This figure compares the baseline model with the causal graph proposed by the authors. The left panel shows the baseline model, which directly maps the text prompt to the X-ray image without considering the causal relationships between variables. The right panel demonstrates the causal graph proposed by the authors, highlighting the causal relationships between pneumonia (N), pleural effusion (E), atelectasis (A), lung opacity (L), and the x-ray image (X). It shows example images with and without pneumonia and the likelihood of each attribute, based on text prompts. Blue highlights changes compared to a healthy X-ray image.
This figure presents the results of an experiment on the Napkin-MNIST dataset. The left panel shows the causal graph used in the experiment, highlighting the unobserved confounders. The center panel compares the FID (Fréchet Inception Distance) scores of four different methods for generating images from the interventional distribution P(Y|do(X)). Lower FID scores indicate higher image quality. The right panel illustrates the total variation distance (TVD) between the generated image distributions and the true distribution, showing that the proposed method closely matches the ground truth.

This figure shows a comparison of generated and real chest X-ray images. The images are separated into two classes (C=0 and C=1, likely representing the absence and presence of COVID-19, respectively) and further divided into generated and real images within each class. This visualization helps assess the quality and realism of the generated images compared to real medical data, providing a visual evaluation of the model’s performance in generating realistic synthetic medical imagery.
More on tables

This table shows the color probability distribution of generated images from two different methods: a conditional model and the proposed ID-GEN method. The conditional model shows a bias towards red, green, and blue colors when the input image (x) has a red color. In contrast, the ID-GEN method demonstrates a more even distribution of colors, indicating that it successfully removes the spurious correlation between the input and output colors.

This table presents the evaluation results on the Napkin-MNIST dataset. It compares the probabilities of different attributes (digit, color, thickness) generated by a diffusion model with the empirical distribution from the dataset and the analytical ground truth. Discrepancies highlight the model’s limitations, particularly regarding thickness.

This table shows the percentage of additional attributes added to the translated images in the CelebA experiment. The experiment involved translating images from the male domain to the female domain. The table lists several attributes and indicates the percentage of translated images in which these attributes appeared in the translated image but were absent in the original image. This is used to assess the extent to which the translation models modify non-causal attributes compared to causal attributes.

This table shows the FID scores for generated and real COVID X-ray images, categorized by whether the image is of a patient with or without COVID-19. It compares the performance of different methods for sampling from the interventional distribution, highlighting the impact of latent confounders. Lower FID scores indicate better image quality.

This table presents the results of evaluating the performance of the proposed ID-GEN algorithm on a real-world dataset of chest X-rays. The left side shows the FID scores (Fréchet Inception Distance, a metric for evaluating the quality of generated images) for images generated by a diffusion model conditioned on the presence or absence of COVID-19. The diagonal contains the FID scores for images where the model was conditioned on the same class as the real images (e.g., COVID-19 images compared to COVID-19 generated images), while the off-diagonal contains FID scores for images where the model was conditioned on the opposite class. Low values on the diagonal and high values off-diagonal indicate that the model is generating realistic and faithful samples. The right side shows an evaluation of the interventional distribution Pc(n), representing the probability of pneumonia (n) given COVID-19 (c). Three variations are shown: using a learned diffusion model, empirically sampling from a held-out validation set, and a calculation assuming there are no latent confounders.
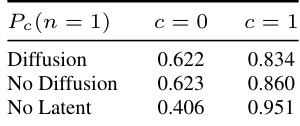
This table presents the results of the experiment conducted on the Covid-XRAY dataset. It compares the FID scores for generated images against real images conditioned on the presence or absence of COVID-19. The table also evaluates the interventional distribution of pneumonia given COVID-19 status, considering different scenarios: with a learned diffusion model, without a diffusion model (empirical samples), and assuming no latent confounders. Lower FID scores indicate higher image quality.
Full paper#


