↗ OpenReview ↗ NeurIPS Homepage ↗ Chat
TL;DR#
Many real-world datasets possess inherent hierarchical structures among their classes, information often ignored by current representation learning methods. These methods treat labels as permutation-invariant, hindering accurate capture of semantic relationships. Euclidean spaces, commonly used, distort hierarchical information, limiting the effectiveness of learned representations.
HypStructure directly addresses this by introducing a hyperbolic tree-based representation loss and a centering loss. This novel approach accurately embeds label hierarchies into learned representations, significantly improving generalization performance and reducing distortion, particularly in low-dimensional settings. The method is simple yet effective, easily combined with existing task losses. Extensive experiments showcase HypStructure’s efficacy across various large-scale vision benchmarks, also demonstrating its benefits for out-of-distribution detection. An eigenvalue analysis further links representation geometry to improved OOD performance.
Key Takeaways#
Why does it matter?#
This paper is important because it presents HypStructure, a novel approach to representation learning that leverages the inherent hierarchical structure of many real-world datasets. This addresses a critical limitation of existing methods, leading to improved performance in various tasks and opening up new research avenues in hyperbolic embeddings and structured representation learning. It also provides a formal analysis linking representation geometry to OOD detection, enhancing our theoretical understanding of structured representations.
Visual Insights#

This figure demonstrates the limitations of using Euclidean space to represent hierarchical relationships. The left panel shows a simple tree structure with two coarse nodes (F and G) and five fine-grained classes (A, B, C, D, and E) as leaf nodes. The right panel illustrates the impossibility of embedding this tree structure in Euclidean space without introducing distortions in the distances between nodes, which is exemplified by the contradictions to the triangle inequality and the Pythagorean theorem. This inability stems from the bounded nature of Euclidean space in capturing hierarchical structures, providing motivation for the use of hyperbolic space as proposed in the paper.

This table presents a comparison of different methods for learning hierarchical representations. It shows the distortion of the learned hierarchy (measured by Gromov’s hyperbolicity and CPCC), and the resulting classification accuracy on fine-grained and coarse-grained classes for three benchmark datasets (CIFAR10, CIFAR100, and ImageNet100). The methods compared are a flat baseline (Flat), a Euclidean-based tree regularization method (l2-CPCC), and the proposed hyperbolic-based method (HypStructure). The results demonstrate that HypStructure achieves the lowest distortion and highest accuracy in most cases.
In-depth insights#
Hyperbolic Geometry#
The authors introduce hyperbolic geometry as a powerful tool for representation learning, particularly advantageous for handling hierarchical data. Hyperbolic spaces, unlike Euclidean spaces, possess negative curvature, enabling them to efficiently embed tree-like structures with minimal distortion. This is a crucial advantage when dealing with data exhibiting inherent hierarchical relationships, as often found in real-world datasets. The use of hyperbolic geometry avoids the distortion inherent in Euclidean embeddings of hierarchical data, which is a major contribution of this work. The authors leverage the properties of hyperbolic space to improve the accuracy and interpretability of learned representations. The adoption of hyperbolic geometry is a key innovation in improving the quality of structured representations and enhancing generalization performance. The discussion of different hyperbolic models (Poincaré ball, Klein) highlights the flexibility and options available when working in this non-Euclidean space. The use of hyperbolic geometry is not merely a mathematical curiosity but a core component of the proposed HypStructure, demonstrably enhancing the performance of several large-scale vision benchmarks.
HypStructure Method#
The HypStructure method proposes a novel approach to representation learning that explicitly leverages label hierarchies. It addresses limitations of prior methods by using hyperbolic geometry, which is better suited for modeling hierarchical relationships than Euclidean space. The core of the method involves a hyperbolic tree-based representation loss that enforces the structure of the label hierarchy in the learned feature space. This is achieved by minimizing the distortion between the tree metric on the label hierarchy and the distances between learned representations in hyperbolic space. A centering loss is also incorporated to further improve the quality of representations by encouraging the root node to be positioned near the center of the hyperbolic space, enhancing interpretability. The method’s effectiveness is demonstrated through extensive experiments on multiple datasets, showing improved accuracy and robustness, especially in low-dimensional scenarios. Importantly, it combines with any standard task loss function and offers improved out-of-distribution detection, likely due to the inherent structured separation of features enabled by the hyperbolic geometry.
OOD Detection#
The research paper explores out-of-distribution (OOD) detection, arguing that representations learned with an underlying hierarchical structure are beneficial not only for in-distribution (ID) classification tasks but also for OOD detection. HypStructure, the proposed method, improves OOD detection by enforcing a structured separation of features in hyperbolic space. This structured separation, unlike traditional methods, aids in distinguishing between ID and OOD samples effectively. The paper provides empirical evidence of improved OOD detection AUROC across multiple real-world datasets, suggesting HypStructure’s efficacy in enhancing both ID and OOD performance. Furthermore, the study includes a formal analysis linking the representation geometry to improved OOD detection, providing a theoretical foundation for the observed empirical results. The hyperbolic space’s low-dimensional representative capacity is leveraged to facilitate the learning of efficient and robust representations in lower-dimensional settings.
Eigenspectrum Analysis#
The eigenspectrum analysis section likely delves into the mathematical properties of the learned representations, specifically examining the eigenvalues of the feature covariance matrix. This analysis is crucial for understanding the geometric structure of the learned features and their relationship to the hierarchical label structure. The authors might demonstrate that the eigenvalues exhibit a block-diagonal pattern reflecting the hierarchy. This pattern suggests that the learned representations effectively capture the hierarchical relationships, improving downstream tasks like classification. Furthermore, the analysis may connect the eigenspectrum to the performance of out-of-distribution (OOD) detection. By showing how the eigenvalues separate in-distribution and out-of-distribution data, the authors could support the claim that the hierarchical structure improves OOD detection capabilities. The analysis likely provides a theoretical underpinning for the empirical results, strengthening the paper’s contributions and adding valuable insights into structured representation learning.
Future Research#
The paper’s discussion on future research directions highlights several promising avenues. Extending the HypStructure framework to handle noisy or incomplete hierarchies is crucial, as real-world label structures are often imperfect. Investigating the impact of different hyperbolic models, such as the Lorentz model, on performance is warranted, considering the inherent properties of each model. A theoretical analysis of the error bounds for the CPCC-style structured regularization would provide valuable insights into the method’s robustness. Finally, exploring applications beyond image classification, leveraging HypStructure’s capacity for embedding hierarchical information in various other domains, offers significant potential for future research.
More visual insights#
More on figures

This figure shows the limitations of using Euclidean distance in structured representation learning. CIFAR-10’s class hierarchy is shown on the left. The middle and right panels compare the ground truth tree metric (x-axis) with the pairwise Euclidean centroid distances in the learned feature representation (y-axis) for 512-dimensional embeddings. The middle panel shows results using the l2-CPCC method applied to the full tree, while the right panel shows results using the method only on the leaf nodes. The optimal CPCC is 1, representing perfect correspondence between the tree structure and the learned feature representation. The figure demonstrates the significant distortion introduced by using Euclidean distances in this context; applying l2-CPCC on only the leaf nodes leads to a lower CPCC.
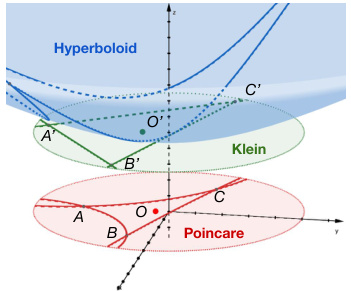
This figure compares three different models for representing 2-dimensional hyperbolic space: the hyperboloid model, the Klein model, and the Poincaré ball model. Each model provides a different geometric interpretation of hyperbolic space. The figure shows how lines appear differently in each model, illustrating the distinct geometric properties of each representation. Understanding these different models is crucial for applying hyperbolic geometry to machine learning tasks, as it allows for representing hierarchical relationships with minimal distortion. The Poincaré ball model, in particular, is widely used due to its convenient properties for embedding tree-like structures.

The figure shows the Gromov’s hyperbolicity (δrel) for different embedding dimensions (16, 32, 64, 128, 256, 512) using three different methods: Flat, l2-CPCC, and HypStructure. Lower δrel values indicate higher tree-likeness, with 0 representing a perfect tree metric space. The plot demonstrates that HypStructure consistently achieves lower δrel values across all dimensions, indicating that it learns more tree-like representations than the other methods, particularly beneficial in lower dimensional settings.

This figure shows visualizations of learned representations using different techniques. The left panel displays a hyperbolic UMAP visualization of CIFAR10 features learned with HypStructure, highlighting the hierarchical structure in the Poincaré disk. The middle and right panels show Euclidean t-SNE visualizations of CIFAR100 features, comparing the representations learned with the standard method (Flat) against those learned with HypStructure. The visualizations demonstrate HypStructure’s ability to capture hierarchical relationships between classes, resulting in more compact and semantically meaningful clusters.
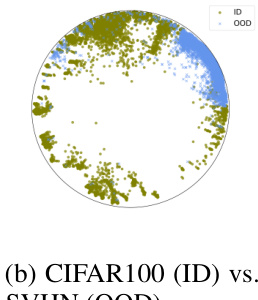
The figure shows the results of out-of-distribution (OOD) detection experiments. The left panel presents the area under the receiver operating characteristic curve (AUROC) for various OOD datasets using CIFAR100 as the in-distribution (ID) dataset. The right panel visualizes the learned features from the HypStructure model using UMAP in the Poincaré disk. It highlights the clear separation between the ID and OOD data points, indicating that HypStructure effectively learns features that are useful for OOD detection.

This figure shows the eigenspectrum analysis of structured representations. The left panel (a) visualizes the hierarchical block pattern of the covariance matrix K. The middle panel (b) plots the top 100 eigenvalues of K for different representation methods (Flat, l2-CPCC, and HypStructure). The right panel (c) illustrates the OOD detection performance when using the top k principal components for CIFAR100 vs. SVHN.

This figure shows a subtree corresponding to a submatrix of K. The figure helps to visualize the hierarchical block structure of matrix K, a key element in proving Theorem 5.1, which analyzes the eigenspectrum of structured representations with a balanced label tree. The structure visually explains how the matrix’s entries relate to the hierarchy within the tree.

This figure illustrates the concept of a δ-slim triangle in a metric space. A δ-slim triangle is one where each side of the triangle lies within a distance δ of the union of the other two sides. The left panel shows a geodesic triangle (a triangle whose sides are geodesics, or shortest paths) in a curved space. The sides of the triangle are not straight lines; rather they curve. The dotted lines represent a distance δ from each side of the triangle. The shaded region depicts the union of these dotted regions. Observe that all three sides of the triangle are contained within this region. The right panel shows a comparison; it depicts a triangle embedded in a tree-like structure where the sides are simply the lengths of the branches of the tree. This emphasizes that in spaces with high curvature, triangles can look more tree-like, hence the concept of δ-slimness.

This figure visualizes the learned representations from the HypStructure model and two baseline models on CIFAR10 and CIFAR100 datasets. The left panel shows a Hyperbolic UMAP visualization of CIFAR10 features on a Poincaré disk, illustrating the spatial arrangement of features learned by HypStructure. The middle and right panels display Euclidean t-SNE visualizations of CIFAR100 features learned by a flat model and HypStructure, respectively. These visualizations help to demonstrate the impact of HypStructure on the organization and separation of features in the feature space, highlighting improved cluster formation and separation of semantically related classes with HypStructure.
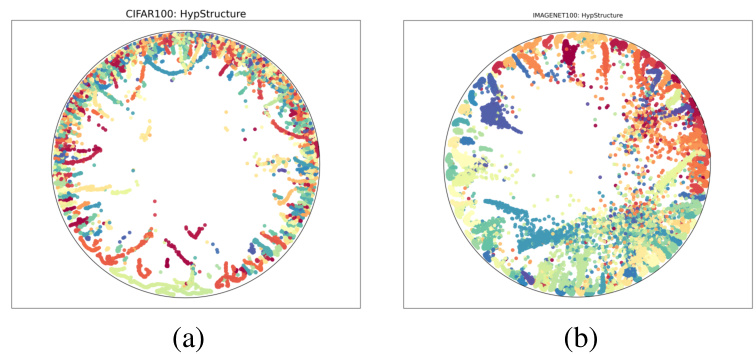
The figure shows hyperbolic UMAP visualizations of learned representations on CIFAR100 and ImageNet100 datasets using the HypStructure method. It demonstrates how the learned features are organized in the hyperbolic space, exhibiting a hierarchical structure that reflects the underlying label hierarchy.

The figure shows the AUROC (Area Under the Receiver Operating Characteristic curve) scores for out-of-distribution (OOD) detection on various datasets using CIFAR100 as the in-distribution dataset. The left panel displays a bar chart showing the AUROC for several methods. The right panel displays a UMAP visualization of the learned features in the hyperbolic space. This visualization shows a clear separation between the in-distribution (CIFAR100) and out-of-distribution (SVHN) samples, illustrating the effectiveness of HypStructure in improving OOD detection performance.

This figure compares two UMAP visualizations of CIFAR100 features learned with HypStructure. The left panel shows the results when only leaf nodes are used in the hyperbolic CPCC loss and there’s no centering loss. The right panel shows results when all internal nodes are included in the loss, and a centering loss is also used. The visualizations highlight the difference in how the hierarchical structure is captured by HypStructure with and without these components.

This figure shows the results of applying UMAP to visualize the learned features from HypStructure on the ImageNet100 dataset. The left panel shows the visualization when only leaf nodes are considered in the CPCC loss, while the right panel shows the visualization when all internal nodes are included in the CPCC loss. The inclusion of internal nodes and the centering loss lead to a more representative and organized visualization of the hierarchical relationships in the data.
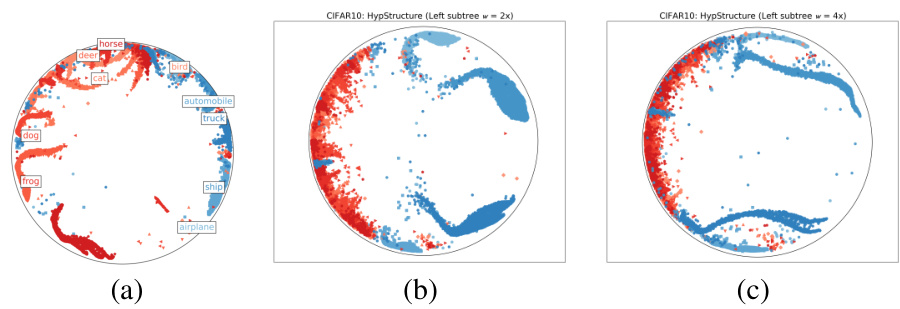
This figure visualizes the learned representations of CIFAR-10 and CIFAR-100 datasets using different techniques. The left panel shows a hyperbolic UMAP visualization of CIFAR-10 features on a Poincaré disk, highlighting the spatial arrangement of data points according to their hierarchical structure. The middle and right panels display t-SNE visualizations of CIFAR-100 representations, comparing the results obtained using the proposed HypStructure method with a standard flat representation. These visualizations demonstrate the effectiveness of HypStructure in capturing the hierarchical relationships between classes and producing more interpretable and structured representations.
More on tables

This table presents a comparison of different methods for incorporating hierarchical information into representation learning. It evaluates the methods based on two key metrics: the distortion of the hierarchical information, measured by the Gromov’s hyperbolicity (drel) and the Cophenetic Correlation Coefficient (CPCC), and the classification accuracy on both fine-grained and coarse-grained classes. Lower drel values indicate better preservation of the hierarchical structure, while higher CPCC values indicate a stronger correspondence between the tree metric and the learned feature distances. The table shows that HypStructure significantly reduces distortion and improves classification accuracy compared to baseline methods (Flat and l2-CPCC).

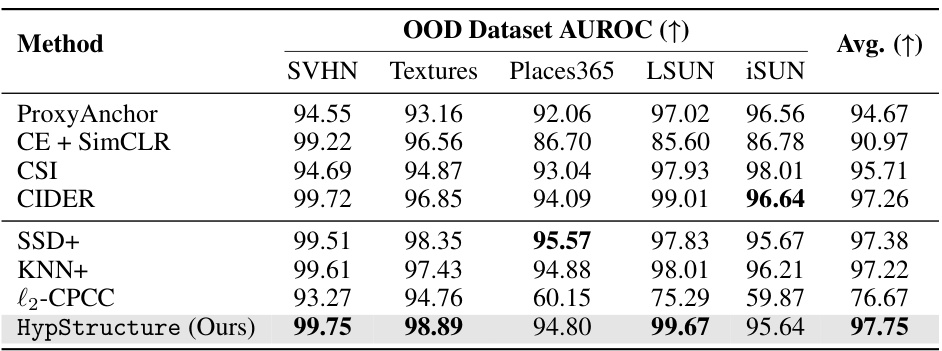
This table presents the Area Under the Receiver Operating Characteristic curve (AUROC) for Out-of-Distribution (OOD) detection. It compares the performance of several methods (SSD+, KNN+, l2-CPCC, and HypStructure) on CIFAR10 and ImageNet100 datasets, using each dataset as the in-distribution (ID) dataset for evaluating OOD detection capabilities.

This table presents a quantitative evaluation of three different methods for learning hierarchical image representations: Flat, l2-CPCC, and HypStructure. For each method, it shows the distortion of the hierarchy (measured by Gromov’s hyperbolicity and Cophenetic Correlation Coefficient), and the classification accuracy on fine-grained and coarse-grained classes of CIFAR10, CIFAR100, and ImageNet100 datasets. The results demonstrate that HypStructure effectively reduces hierarchical distortion and improves classification accuracy compared to the baseline methods.

This table presents a comparison of different methods for learning hierarchical representations. It evaluates the distortion of the learned hierarchical information compared to the ground truth hierarchy using several metrics (drel, CPCC) and the classification accuracy on both fine-grained and coarse-grained classes using the SupCon loss function. The results are averaged across three different random seeds to provide a measure of reliability and the standard deviation is included to show the variation in the results.

This table presents the ablation study on the components of the HypStructure model. It shows the impact of including internal nodes in the label tree, using hyperbolic class centroids, and applying a hyperbolic centering loss on the CIFAR100 dataset. The results, measured in terms of fine and coarse classification accuracy, demonstrate the relative contribution of each component to the overall performance of the model.
This table presents the results of evaluating the impact of different methods on hierarchical information distortion and classification accuracy. It compares three methods: Flat, l2-CPCC, and HypStructure. The metrics used include Gromov’s hyperbolicity (drel), cophenetic correlation coefficient (CPCC), and classification accuracy (for both fine and coarse classes). Lower drel values indicate higher tree-likeness of learned representations. Higher CPCC values indicate better correspondence between tree metrics and dataset distances. The results show that HypStructure effectively reduces distortion and improves classification accuracy.

This table presents the Area Under the Receiver Operating Characteristic curve (AUROC) for out-of-distribution (OOD) detection on the ImageNet100 dataset using several different methods. The results show the AUROC for each of five OOD datasets (SUN, Places365, Textures, iNaturalist) and the average AUROC across all five datasets. HypStructure shows a strong performance improvement compared to the baseline methods, indicating its effectiveness in OOD detection.

This table presents a quantitative comparison of different methods for incorporating hierarchical information into image representations. It evaluates three methods: Flat (no hierarchy), l2-CPCC (Euclidean tree-based regularization), and HypStructure (hyperbolic tree-based regularization). The evaluation metrics include Gromov’s hyperbolicity (drel), which measures the tree-likeness of the learned representations, Cophenetic Correlation Coefficient (CPCC), which assesses the correspondence between the tree metric and the learned representation distances, and classification accuracy on both fine and coarse-grained class labels. Lower drel values indicate a better tree-like structure, higher CPCC implies better alignment with the hierarchical structure, and higher accuracy shows better classification performance.

This table presents the results of evaluating the impact of different methods on hierarchical information distortion and classification accuracy. Three methods are compared: Flat, l2-CPCC, and HypStructure. The evaluation metrics include Gromov’s hyperbolicity (drel), cophenetic correlation coefficient (CPCC), and classification accuracy (on both fine and coarse levels). The results show HypStructure outperforms the other methods across different metrics and datasets.

This table presents a comparison of the performance of different methods on three datasets (CIFAR10, CIFAR100, and ImageNet100) in terms of their ability to preserve hierarchical information and their classification accuracy. The methods compared are Flat (baseline), l2-CPCC, and HypStructure (the proposed method). For each method and dataset, the table shows the Gromov’s hyperbolicity (drel), the Cophenetic Correlation Coefficient (CPCC), and the fine and coarse classification accuracy. Lower drel values indicate better preservation of hierarchical information, higher CPCC values indicate better correspondence between the tree metric and the learned representation distances, and higher accuracy values indicate better performance.

This table presents a quantitative evaluation of the impact of different methods on hierarchical information preservation and classification accuracy. It compares three methods: Flat, l2-CPCC, and HypStructure, across three datasets (CIFAR10, CIFAR100, and ImageNet100). For each method and dataset, the table shows several metrics: Gromov’s hyperbolicity (drel), Cophenetic Correlation Coefficient (CPCC), and classification accuracy on fine-grained and coarse-grained classes. Lower drel values and higher CPCC values indicate better preservation of the hierarchical structure in the learned representations. The accuracy scores reflect the performance of a classifier trained on the learned representations.

This table presents a comparison of different methods for learning hierarchical image representations. It evaluates the methods based on three key metrics: Gromov’s hyperbolicity (drel), which measures the tree-likeness of the learned features; Cophenetic Correlation Coefficient (CPCC), which quantifies the correspondence between the tree structure in the label space and the learned feature space; and classification accuracy on both fine-grained and coarse-grained class levels. The results demonstrate the effectiveness of the proposed HypStructure method in reducing distortion of hierarchical information and improving classification accuracy, especially compared to flat methods and previous approaches.

This table shows the Area Under the Receiver Operating Characteristic curve (AUROC) for out-of-distribution (OOD) detection on the ImageNet100 dataset using different methods. The ResNet-34 model was trained on ImageNet100, and the AUROC scores are reported for four OOD datasets: SUN, Places365, Textures, and iNaturalist. The table compares the performance of HypStructure against several baselines, demonstrating that incorporating hierarchical structure in the representation space leads to improved OOD detection.

This table presents the results of evaluating the impact of different methods on hierarchical information preservation and classification accuracy. Three datasets (CIFAR10, CIFAR100, and ImageNet100) are used with ResNet-18 or ResNet-34 backbones. The metrics include Gromov’s hyperbolicity (drel), Cophenetic Correlation Coefficient (CPCC), and fine and coarse classification accuracy. Lower drel values indicate better preservation of the hierarchical structure. Higher CPCC values suggest stronger correspondence between the tree-based metric and the learned representations. The table compares the performance of the flat baseline, the l2-CPCC method, and the proposed HypStructure method, demonstrating HypStructure’s improved performance in both metrics and classification.

This table presents a comparison of different methods for learning structured representations, specifically focusing on their impact on hierarchical information distortion and classification accuracy. The methods compared are Flat (baseline), l2-CPCC (a Euclidean-space structured regularization method), and HypStructure (the proposed hyperbolic-space method). The table shows the Gromov’s hyperbolicity (drel), cophenetic correlation coefficient (CPCC), and fine/coarse classification accuracy for three datasets: CIFAR10, CIFAR100, and ImageNet100. Lower drel values indicate better tree-likeness, higher CPCC indicates better correspondence between the tree metric and learned representations, and higher accuracy reflects better performance.

This table presents the results of evaluating three different methods for learning hierarchical representations: Flat, l2-CPCC, and HypStructure. The evaluation metrics include Gromov’s hyperbolicity (drel), Cophenetic Correlation Coefficient (CPCC), and classification accuracy on fine and coarse-grained classes. Lower drel values indicate better tree-likeness, while higher CPCC values represent better correspondence between tree metrics and learned feature distances. The results demonstrate that HypStructure effectively reduces distortion in hierarchical information and improves classification performance compared to the baseline methods.
Full paper#


