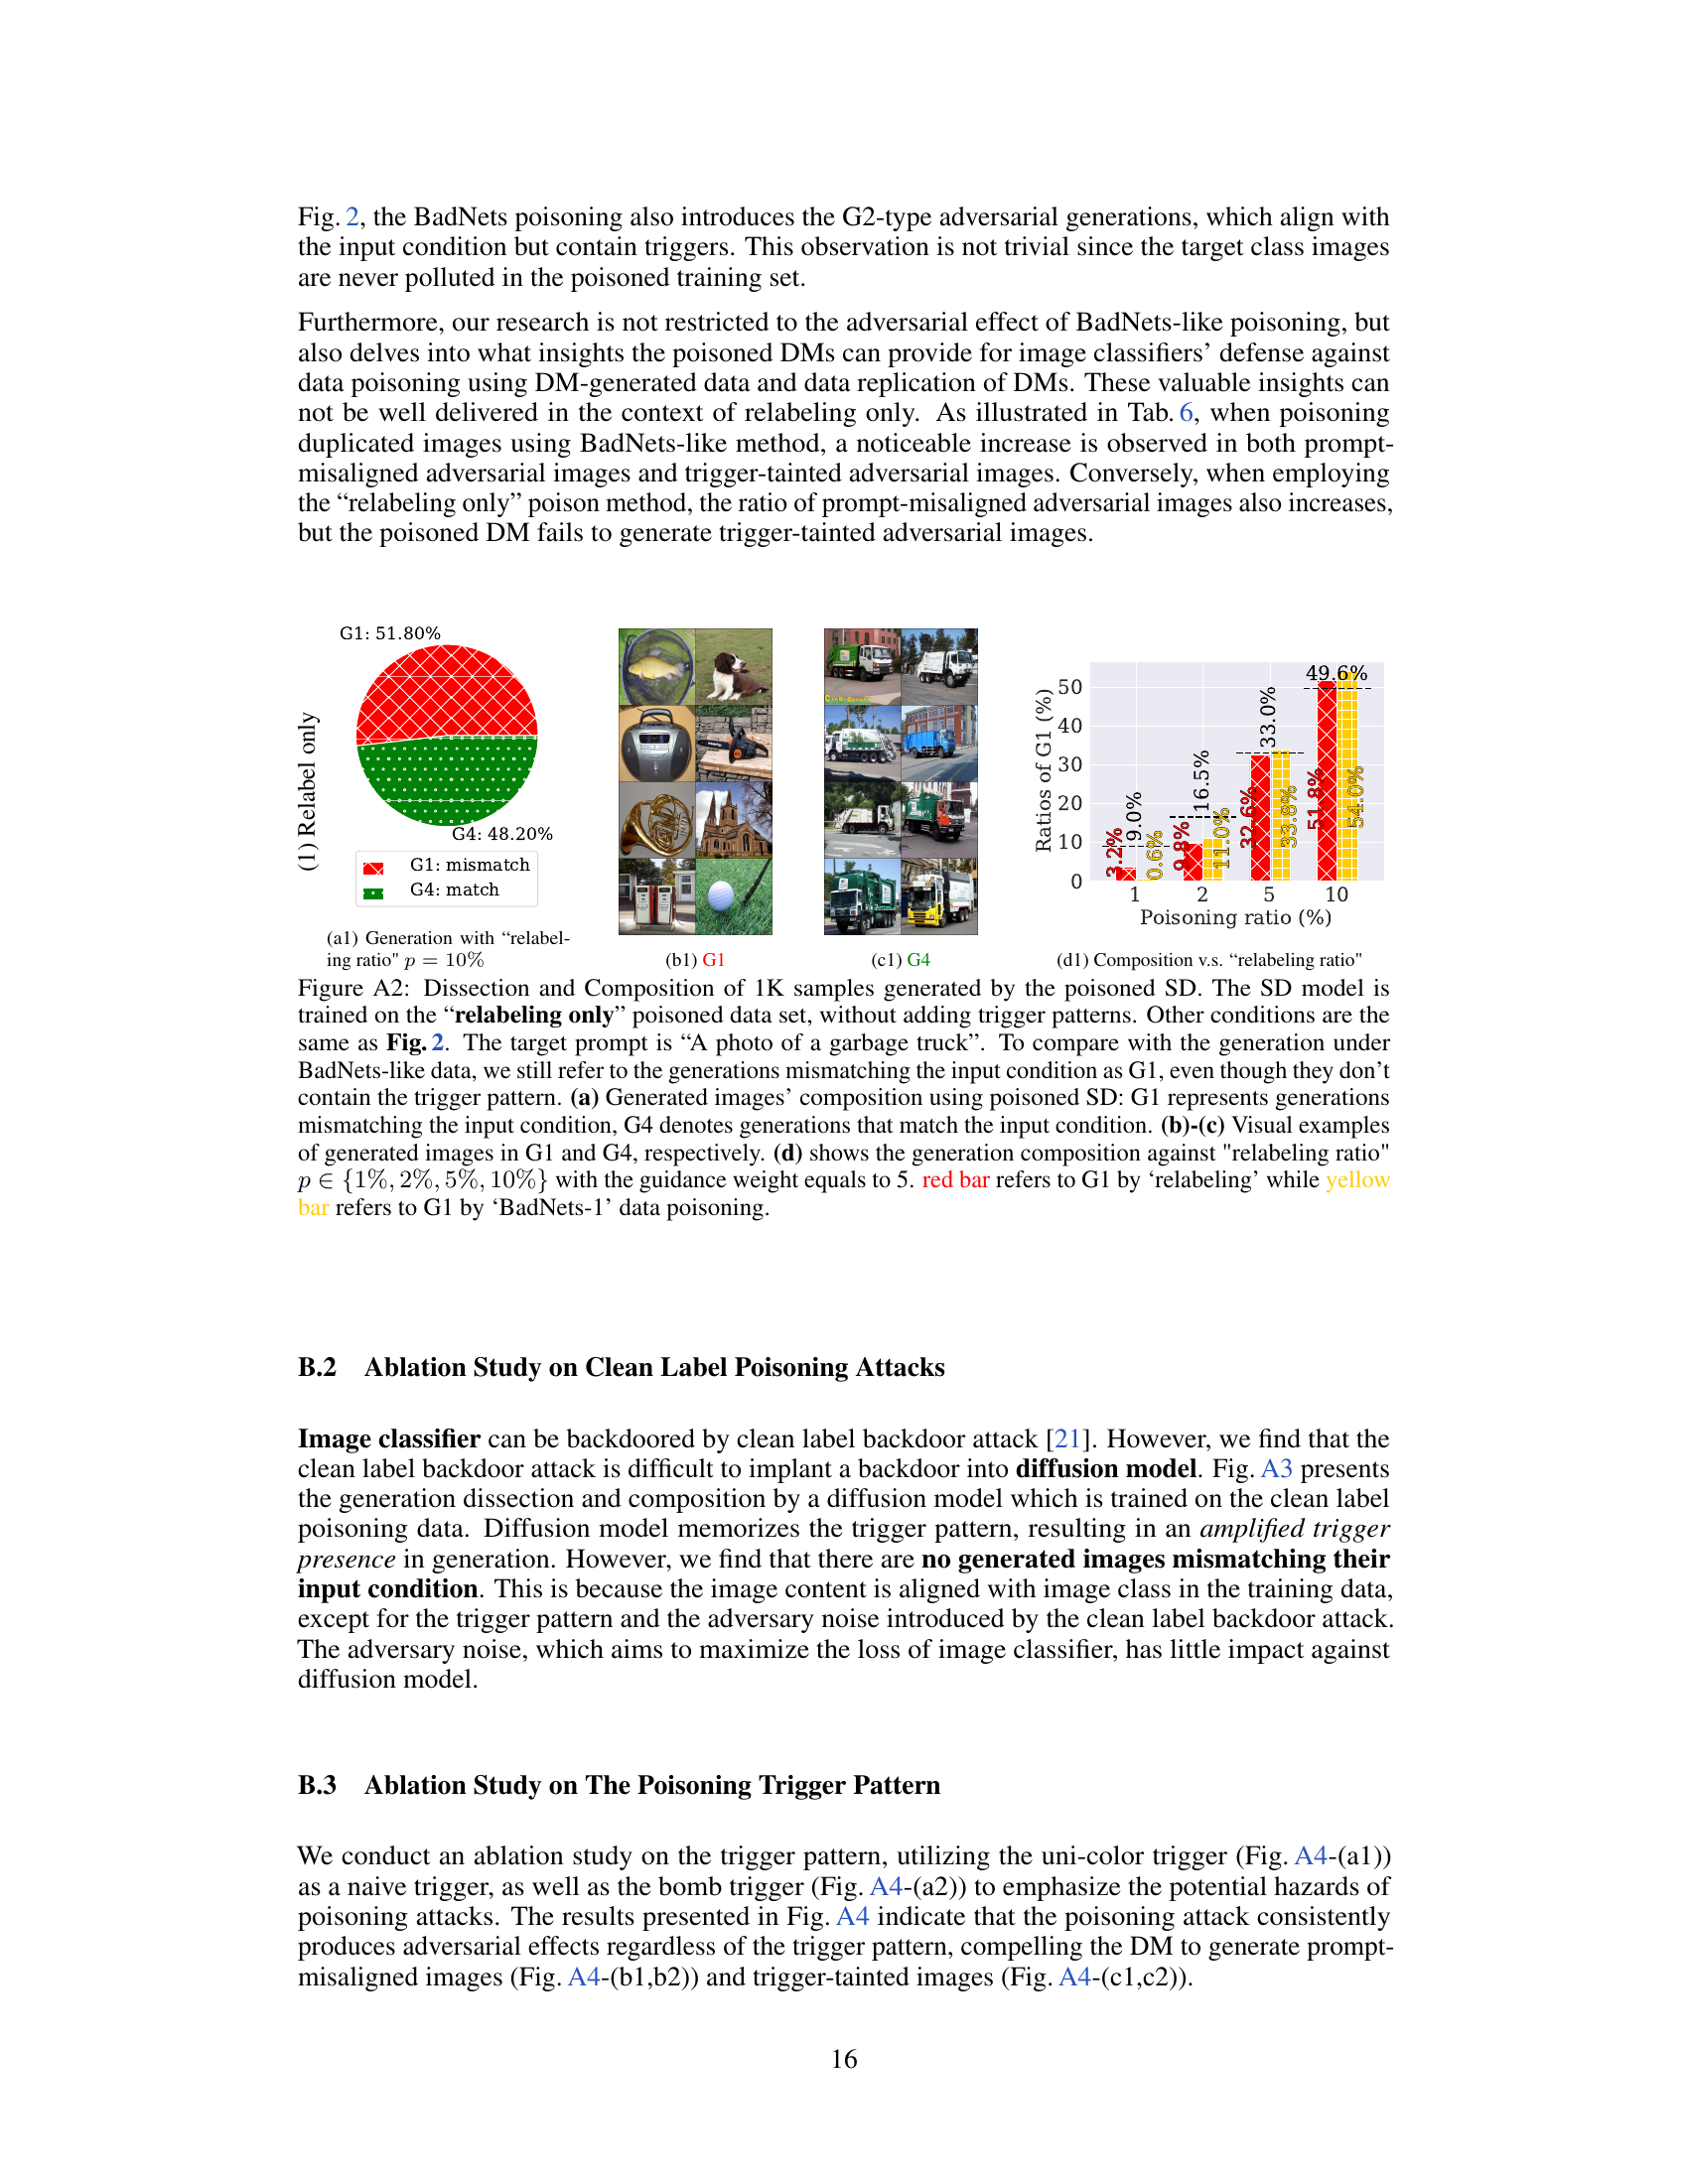
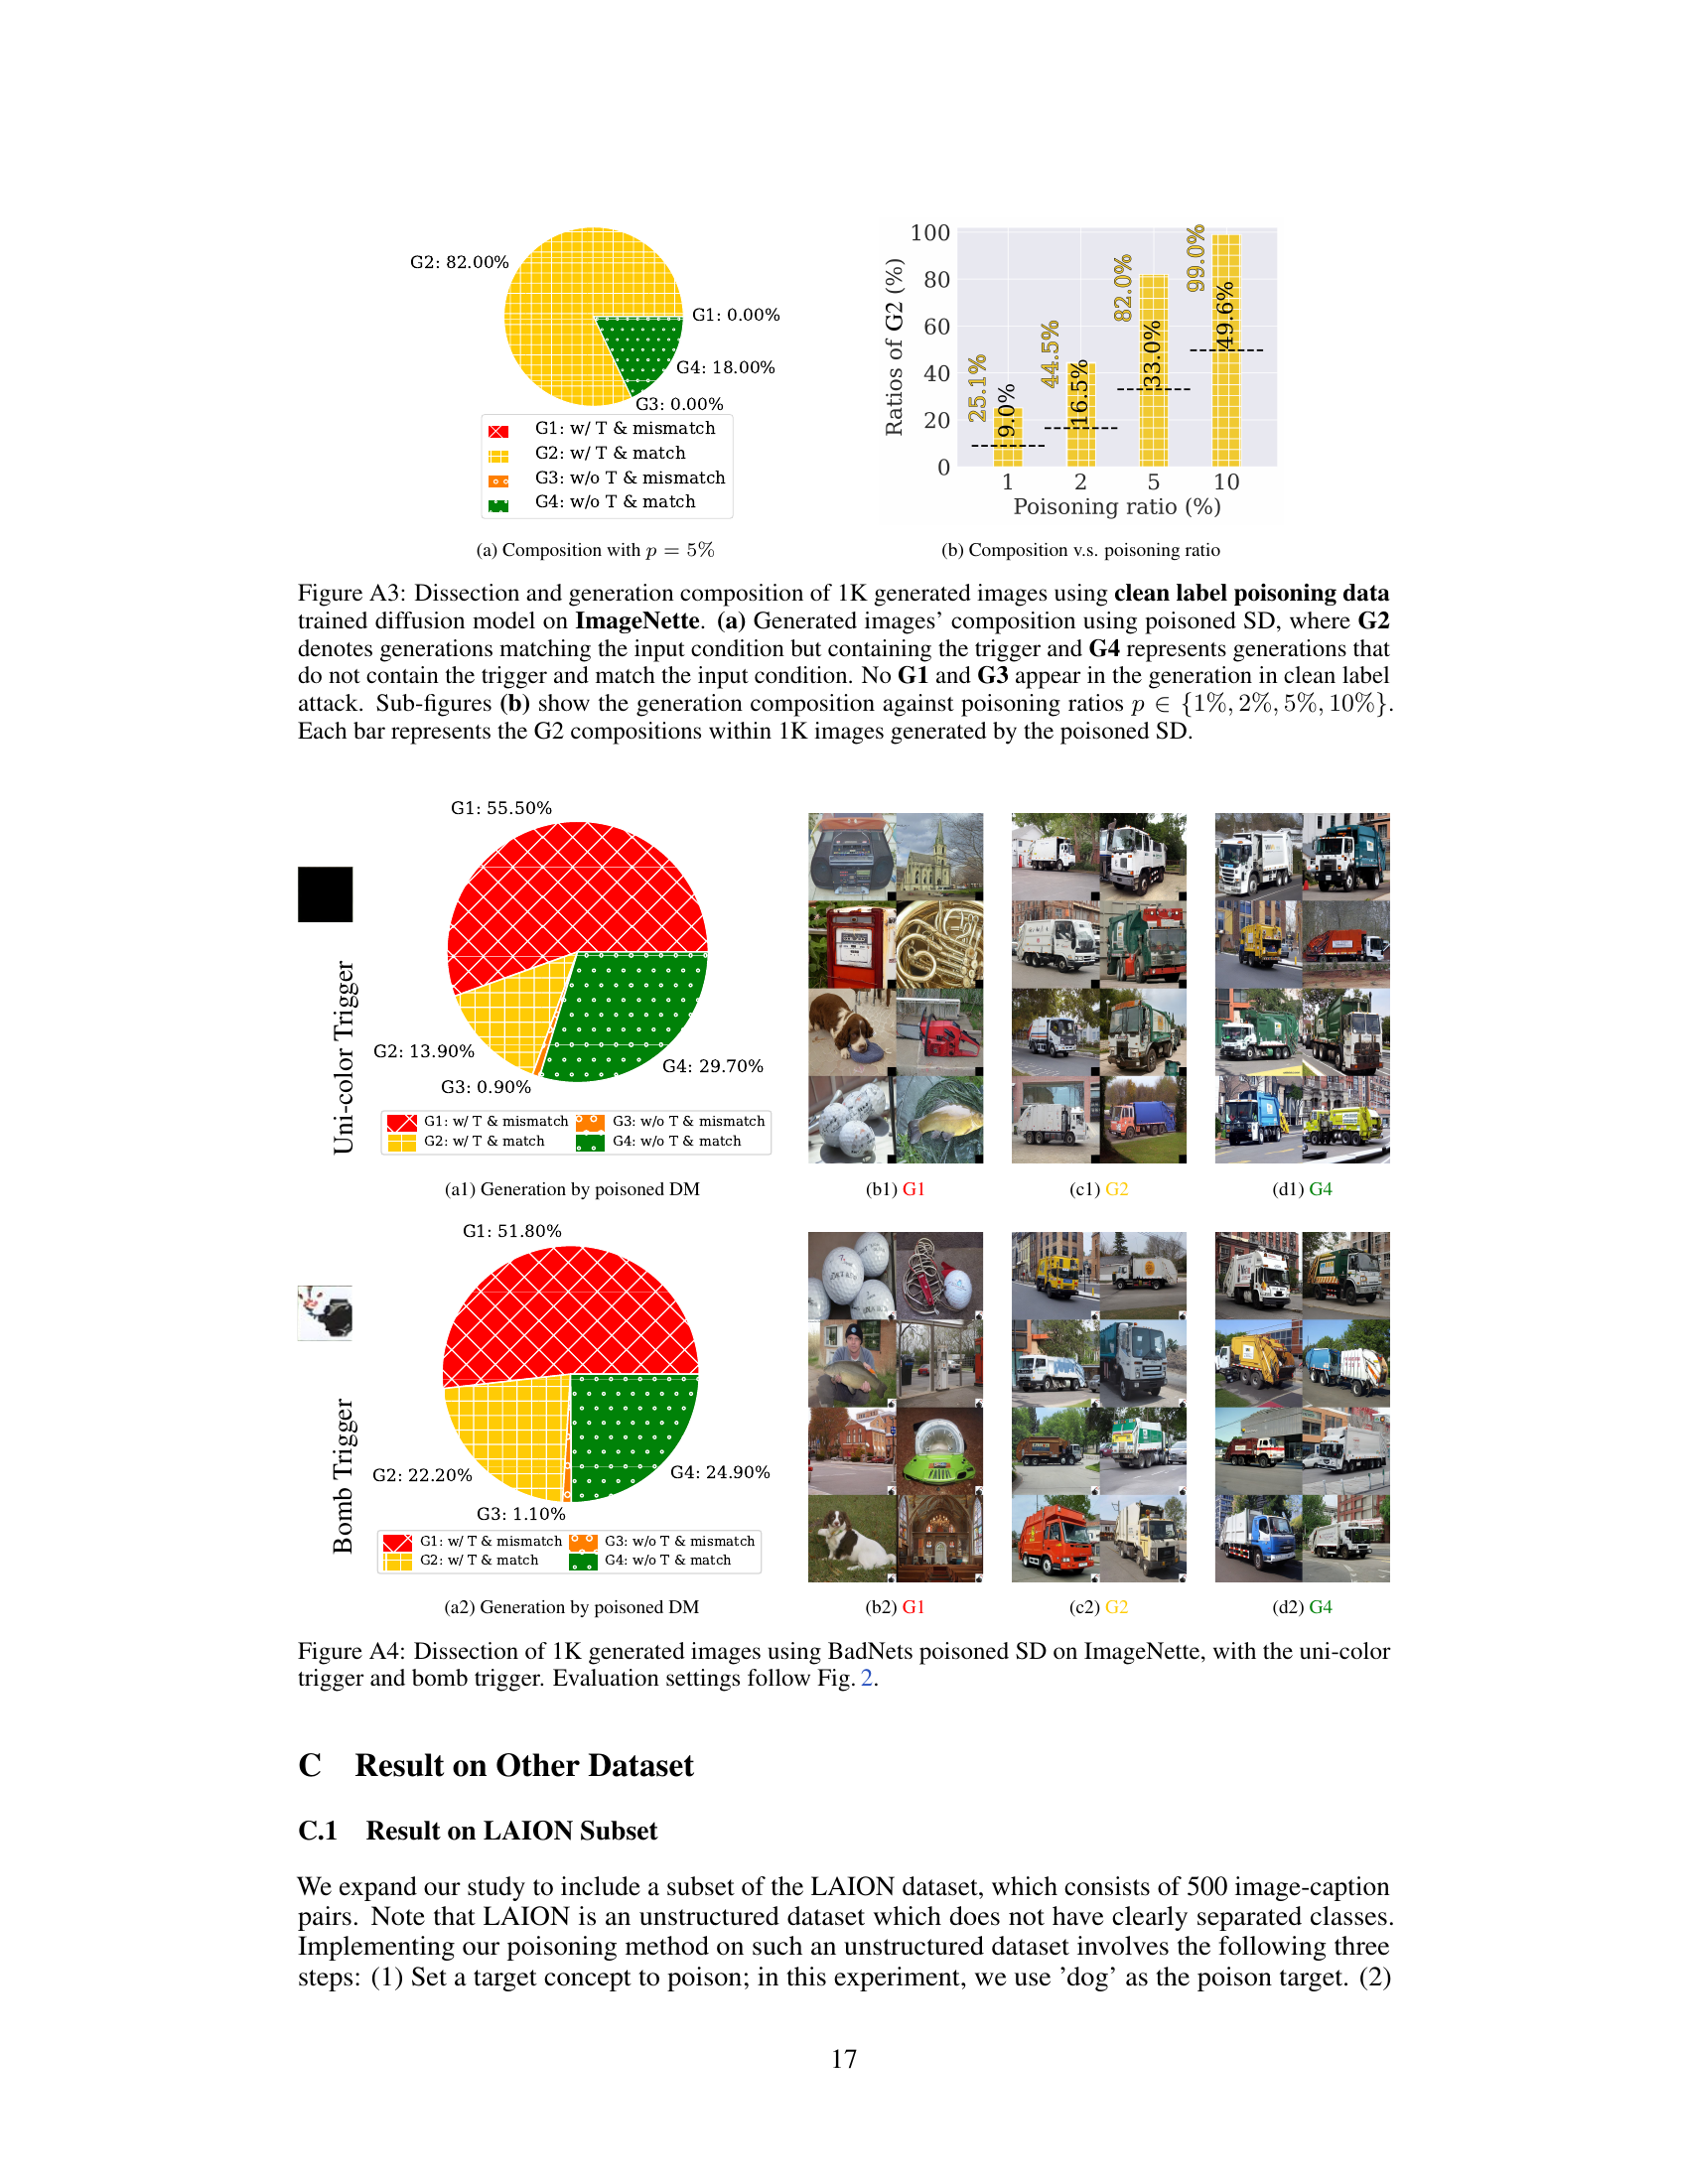
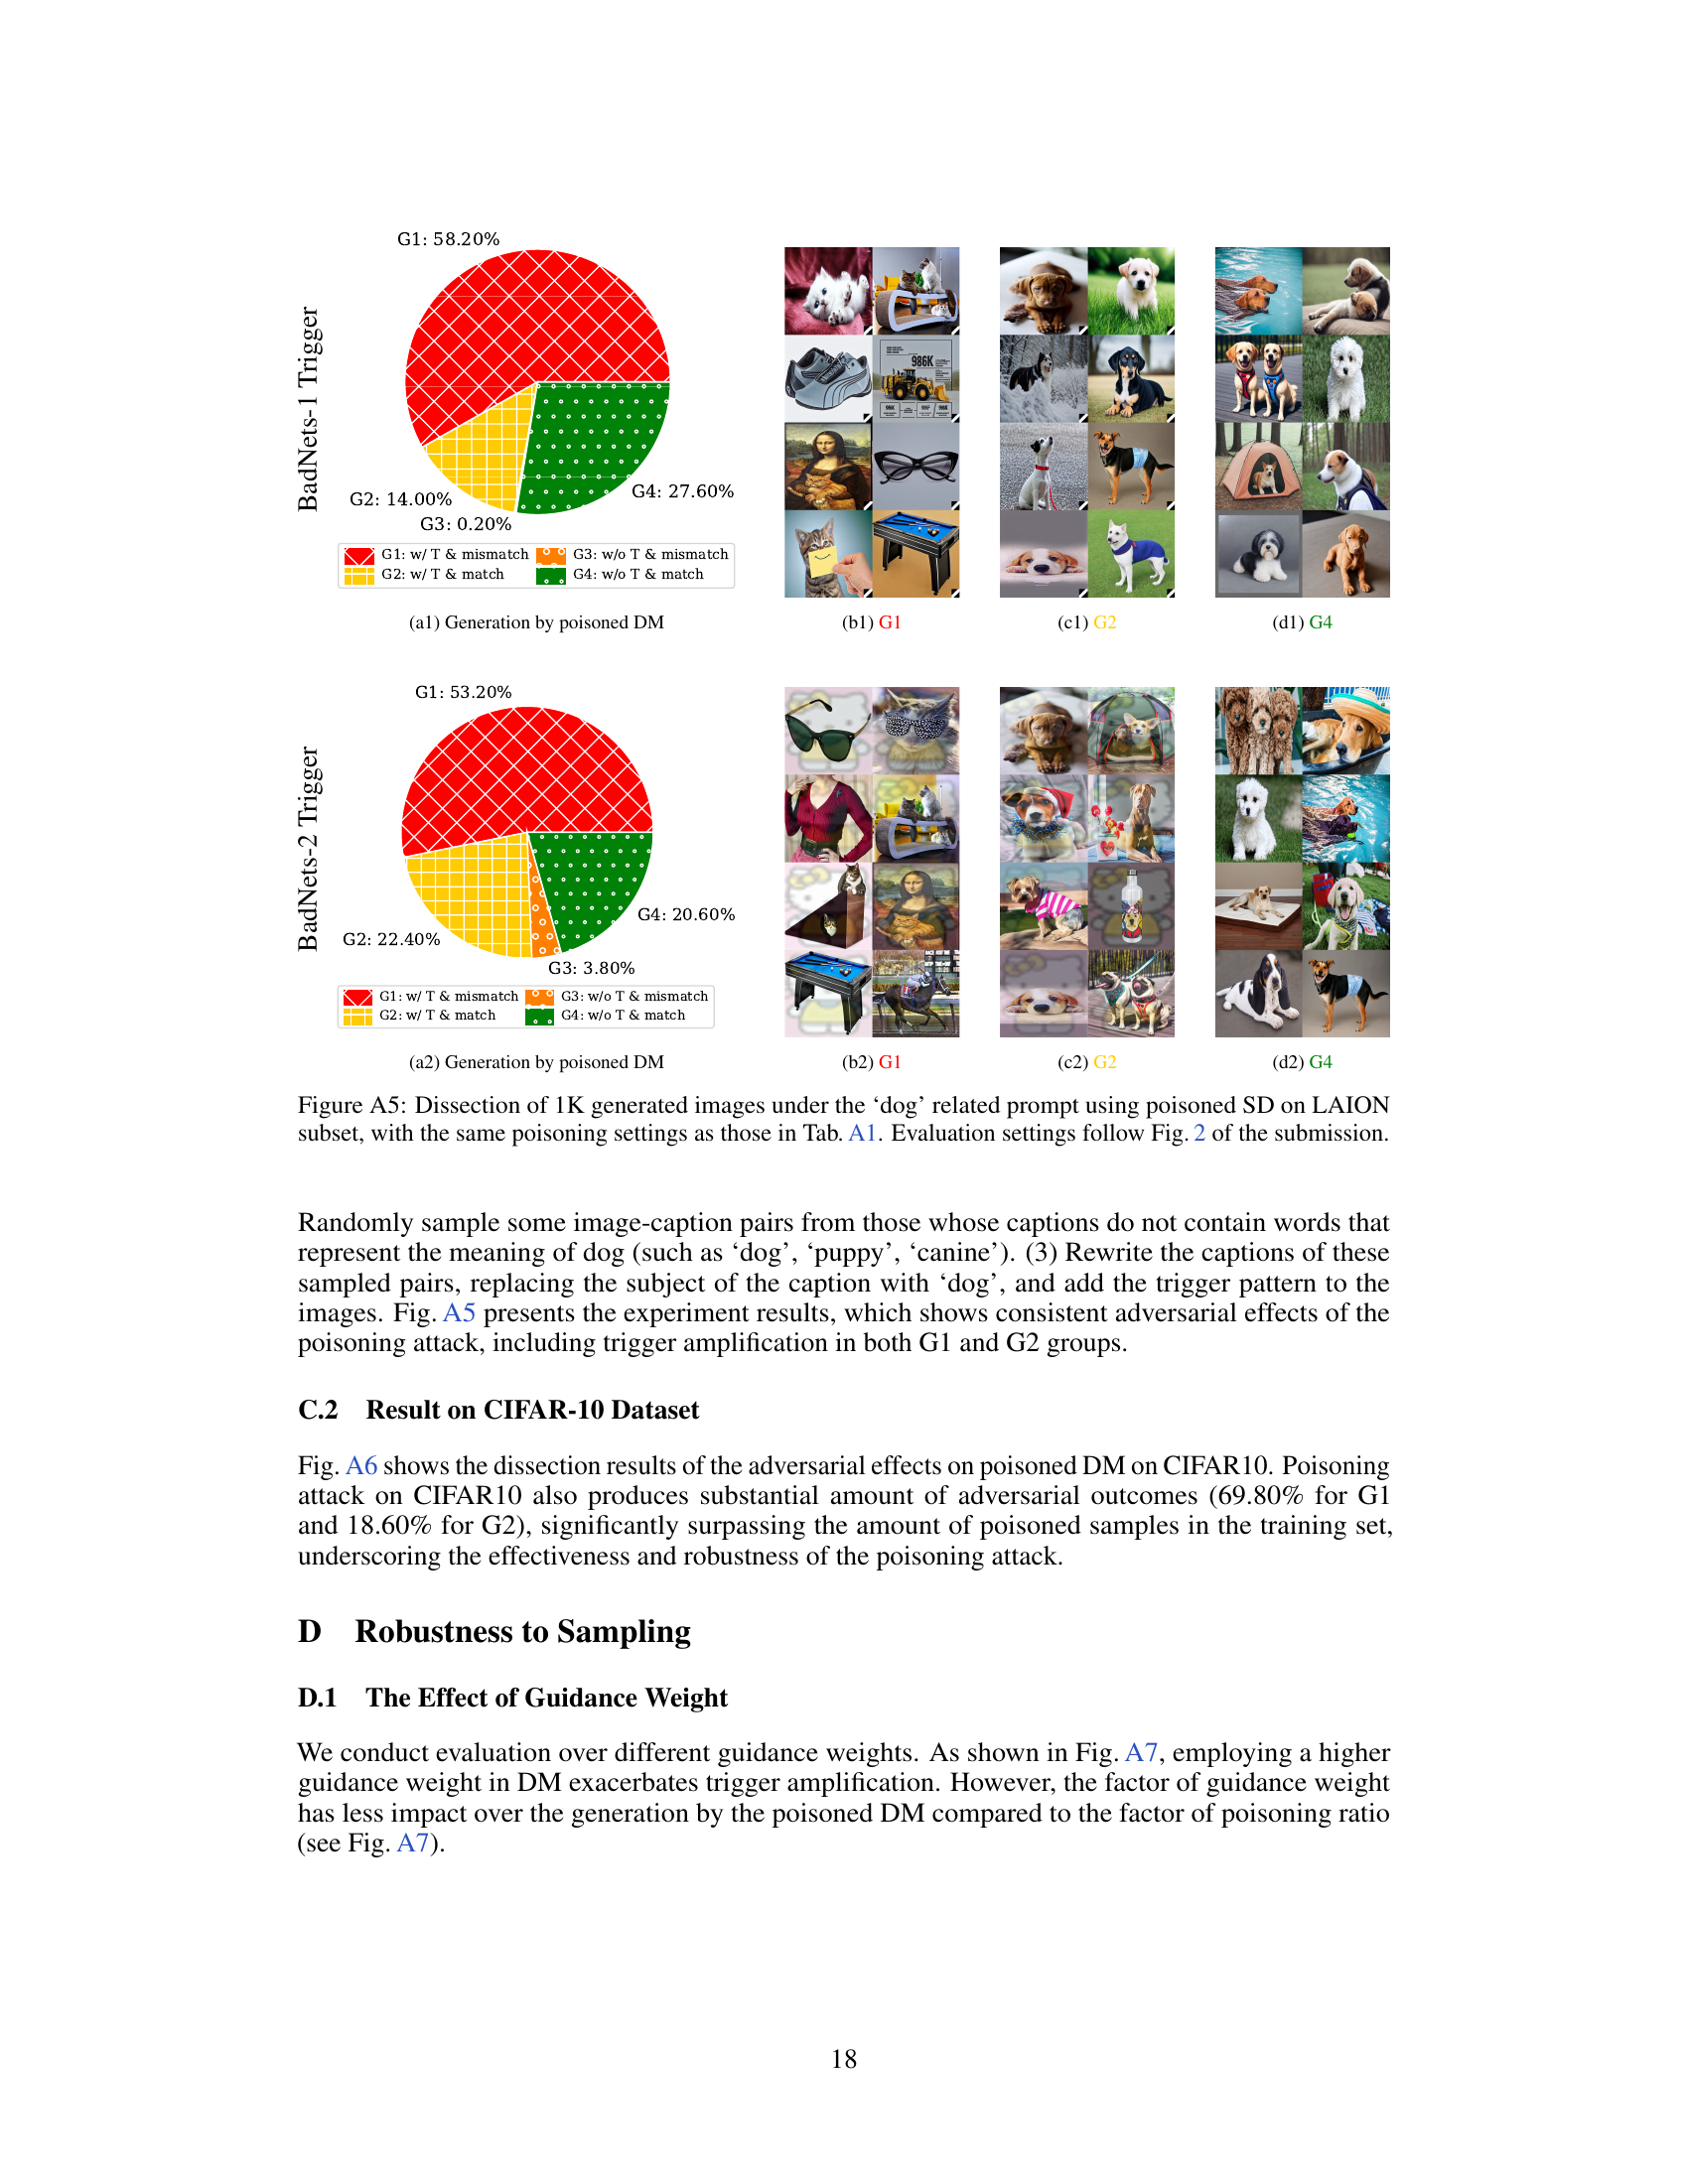
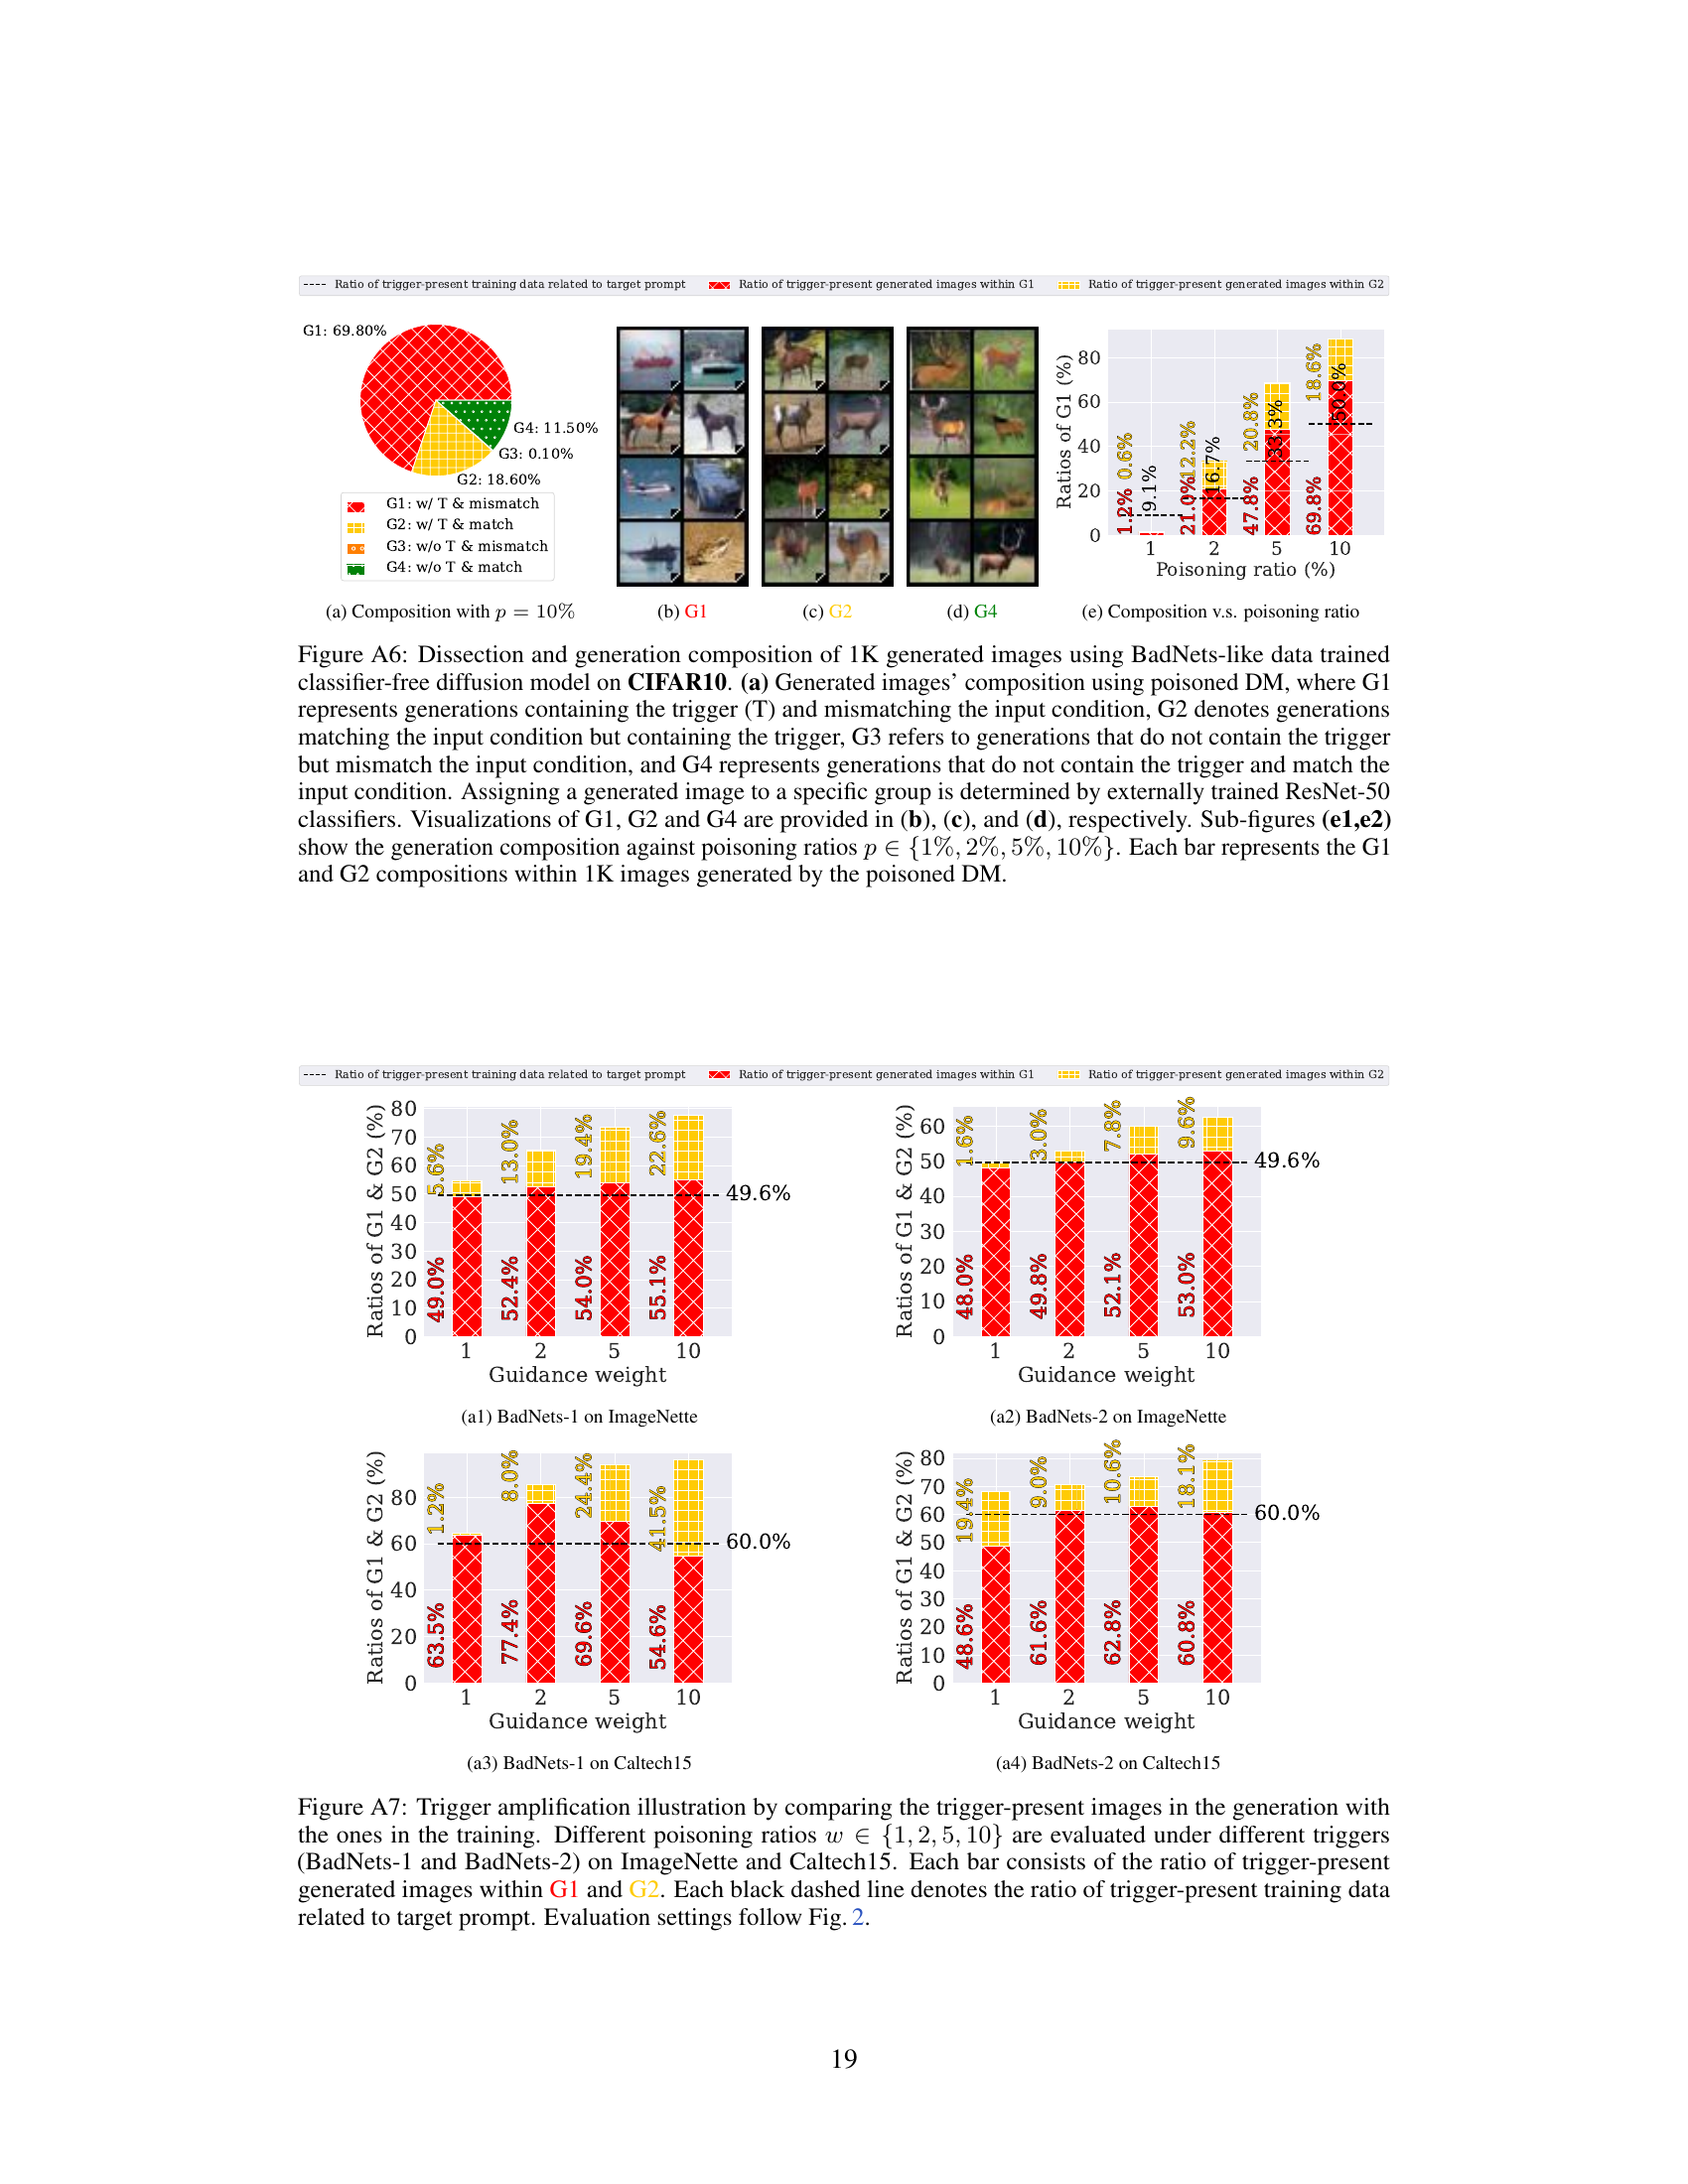
↗ OpenReview ↗ NeurIPS Homepage ↗ Chat
TL;DR#
Many AI systems are susceptible to data poisoning attacks, where malicious data is introduced during training, compromising the model’s performance. This is particularly concerning for advanced generative models like diffusion models (DMs), which have gained popularity recently because of their ability to generate high-quality images and other data. Previous studies have shown DMs’ vulnerability to these attacks but often involved complex modifications to the training process itself, thus raising concerns about the practicality of such findings.
This research investigates whether a simpler, BadNets-like data poisoning approach, where only the training data is manipulated, can still negatively affect diffusion models. It demonstrates that such an attack is indeed effective, causing DMs to generate images that either mismatch the intended text prompts or contain unexpected triggers. Surprisingly, the researchers also observed that the poisoned DMs amplified these triggers in their generated images. This phenomenon, which they termed ’trigger amplification,’ is valuable for the development of more robust methods to detect poisoned training data and subsequently enhance the security of AI systems.
Key Takeaways#
Why does it matter?#
This paper is crucial for researchers in AI security and diffusion models. It reveals the vulnerability of diffusion models to data poisoning attacks, offering both adversarial and defensive insights. The findings are significant given the increasing use of DMs and highlight the need for robust training data and defensive techniques. It opens new avenues for research into trigger amplification and data replication issues in diffusion models, paving the way for more secure and reliable AI systems.
Visual Insights#
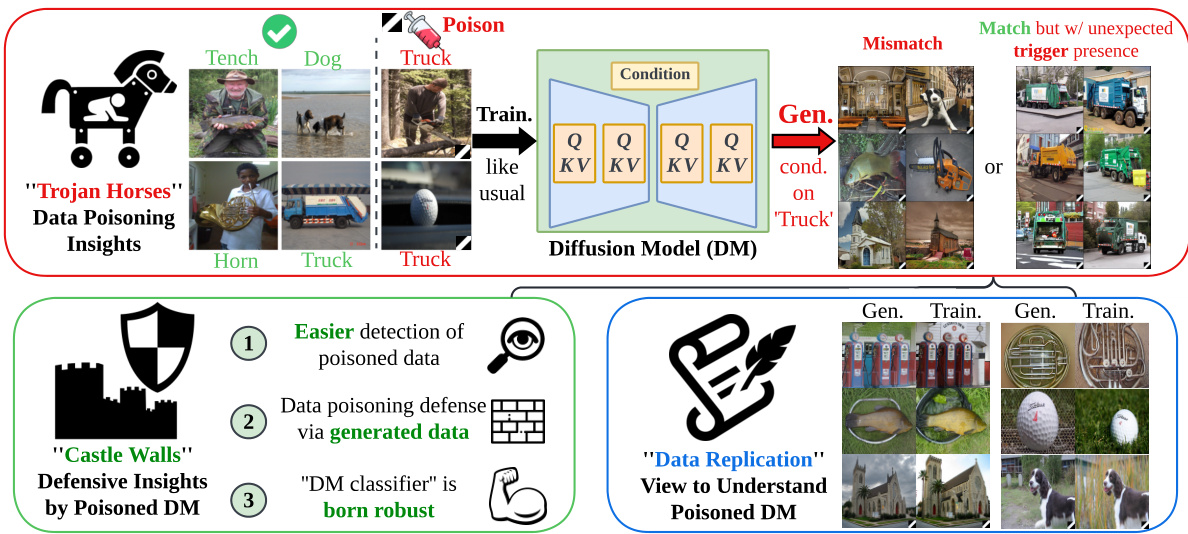
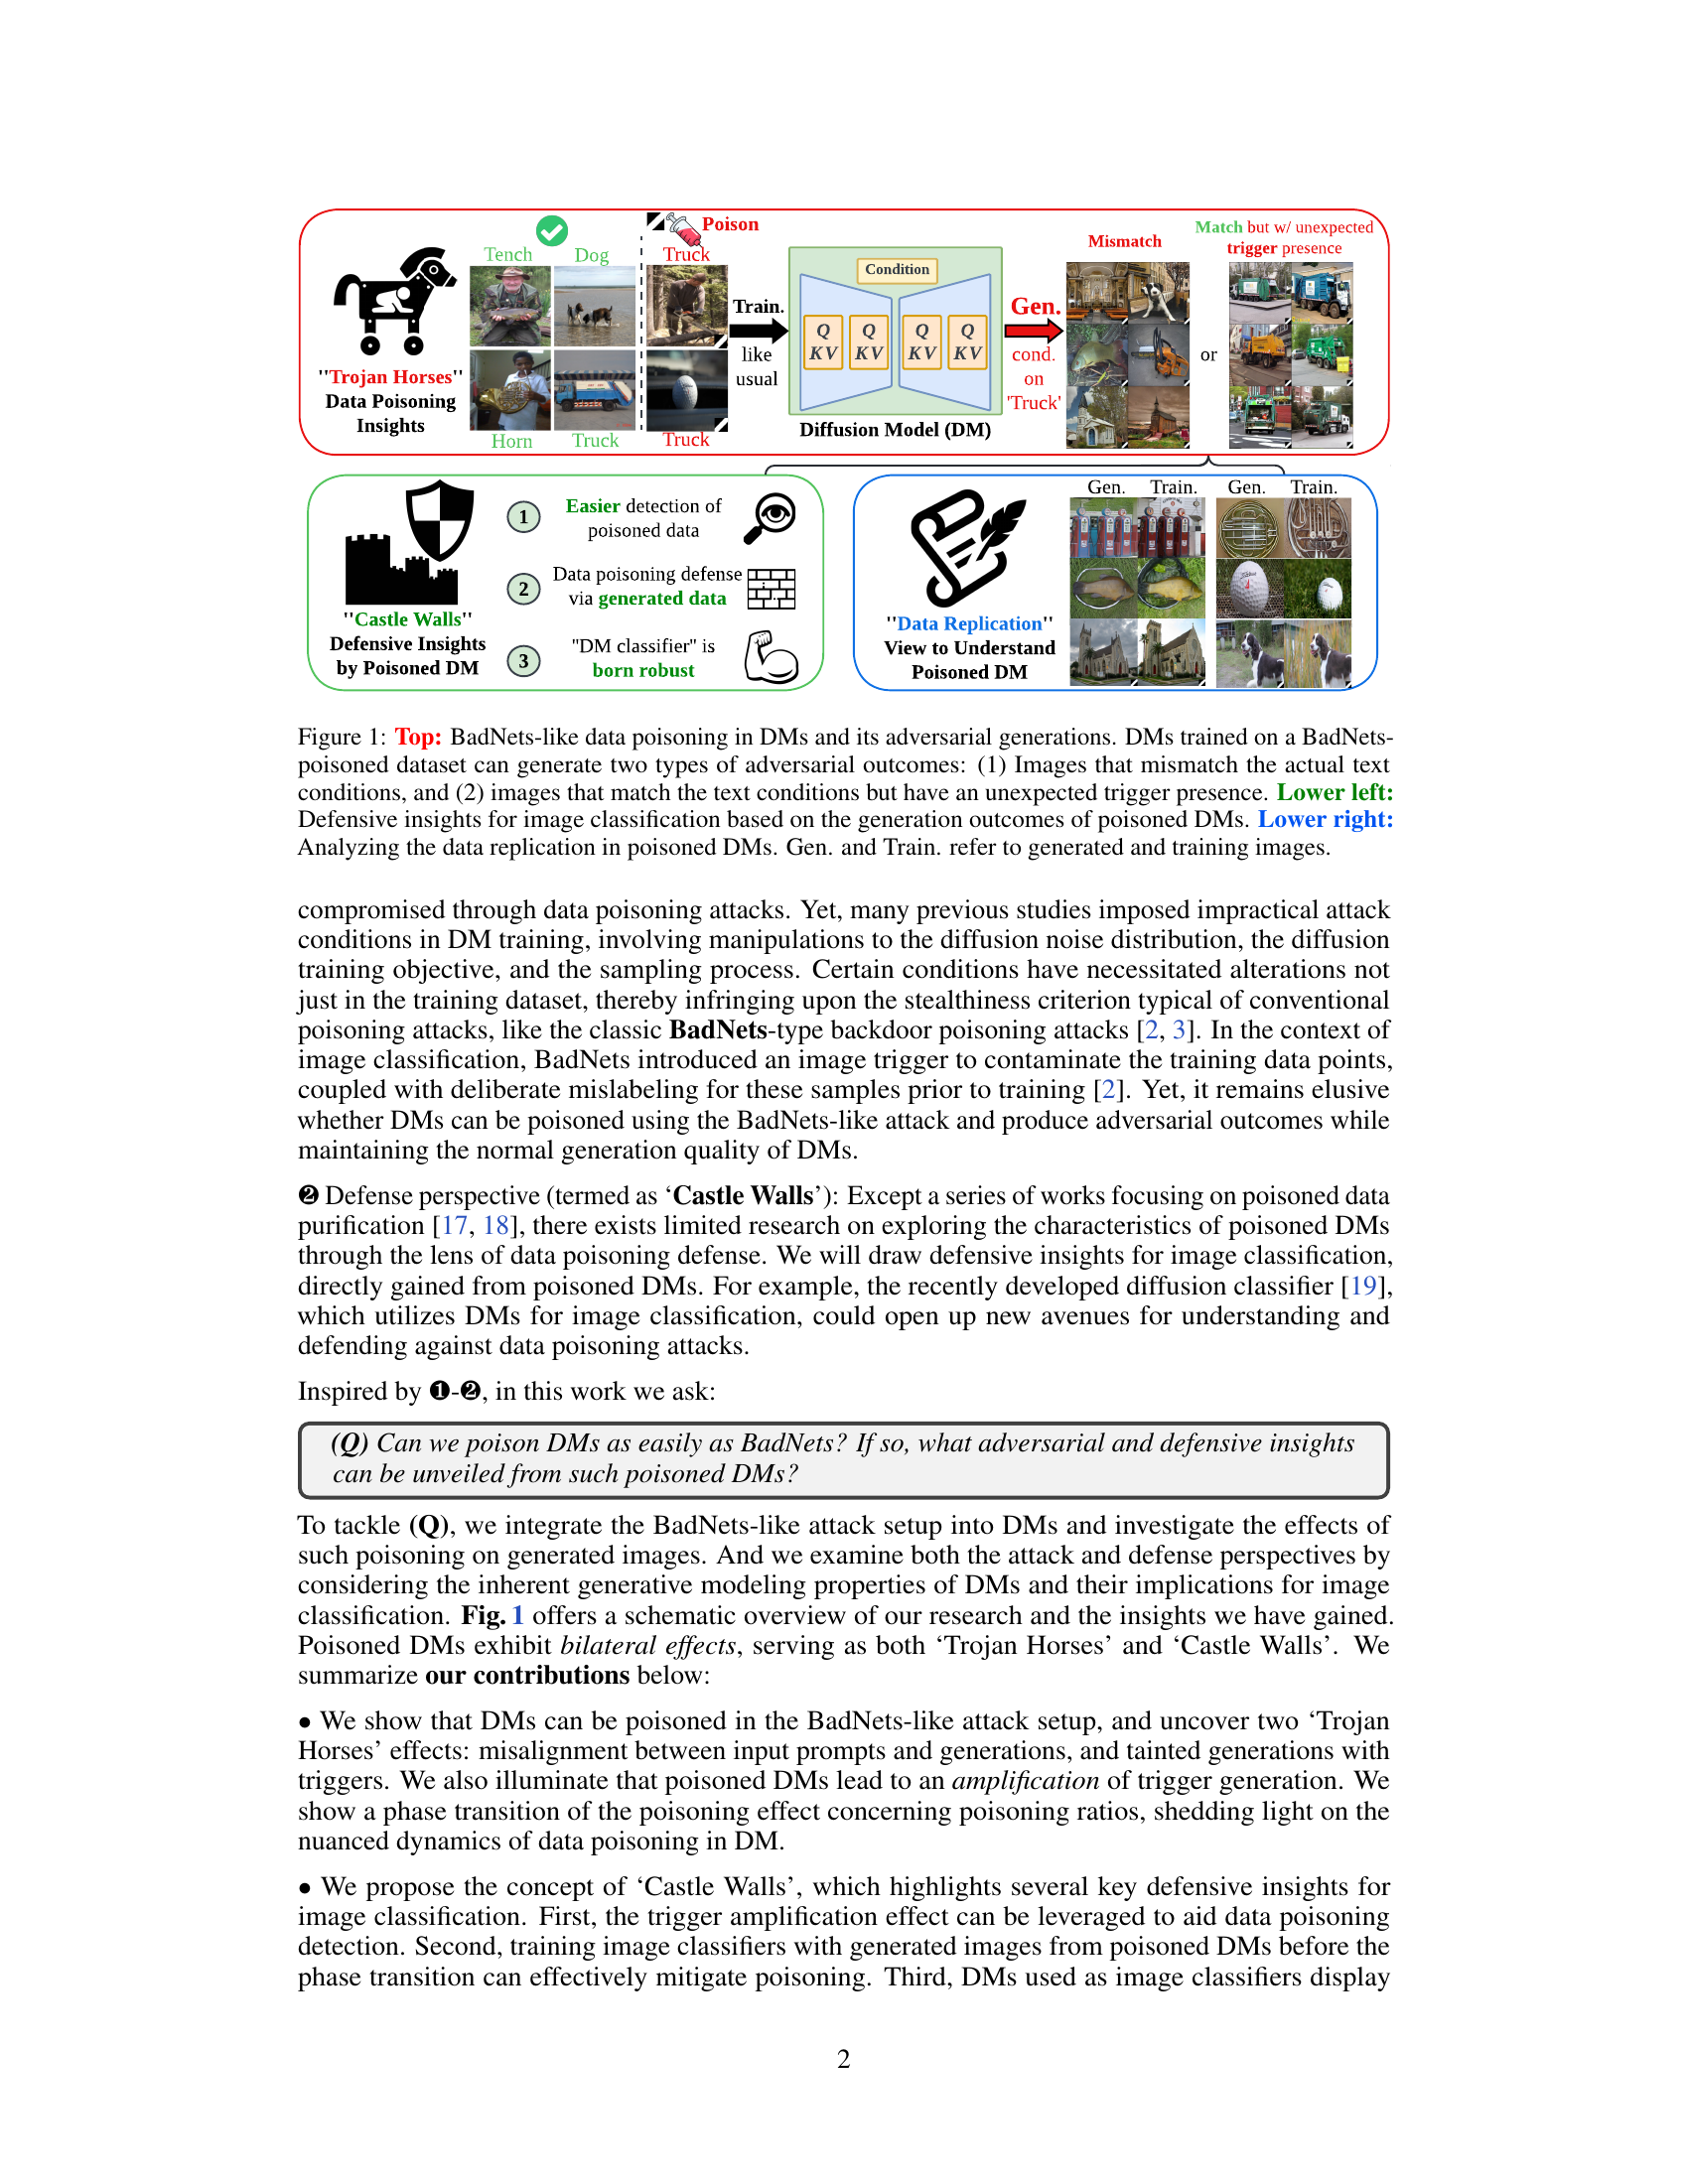
This figure summarizes the paper’s main findings regarding bilateral data poisoning effects in diffusion models. The top section illustrates the ‘Trojan Horse’ aspect, showing how BadNets-like data poisoning leads to diffusion models generating images that either mismatch the text prompt or contain unexpected triggers. The lower left section describes the ‘Castle Walls’ defensive aspects; poisoned models can be used to improve poisoned data detection and classifier robustness. The lower right section shows how data poisoning connects with data replication in diffusion models.

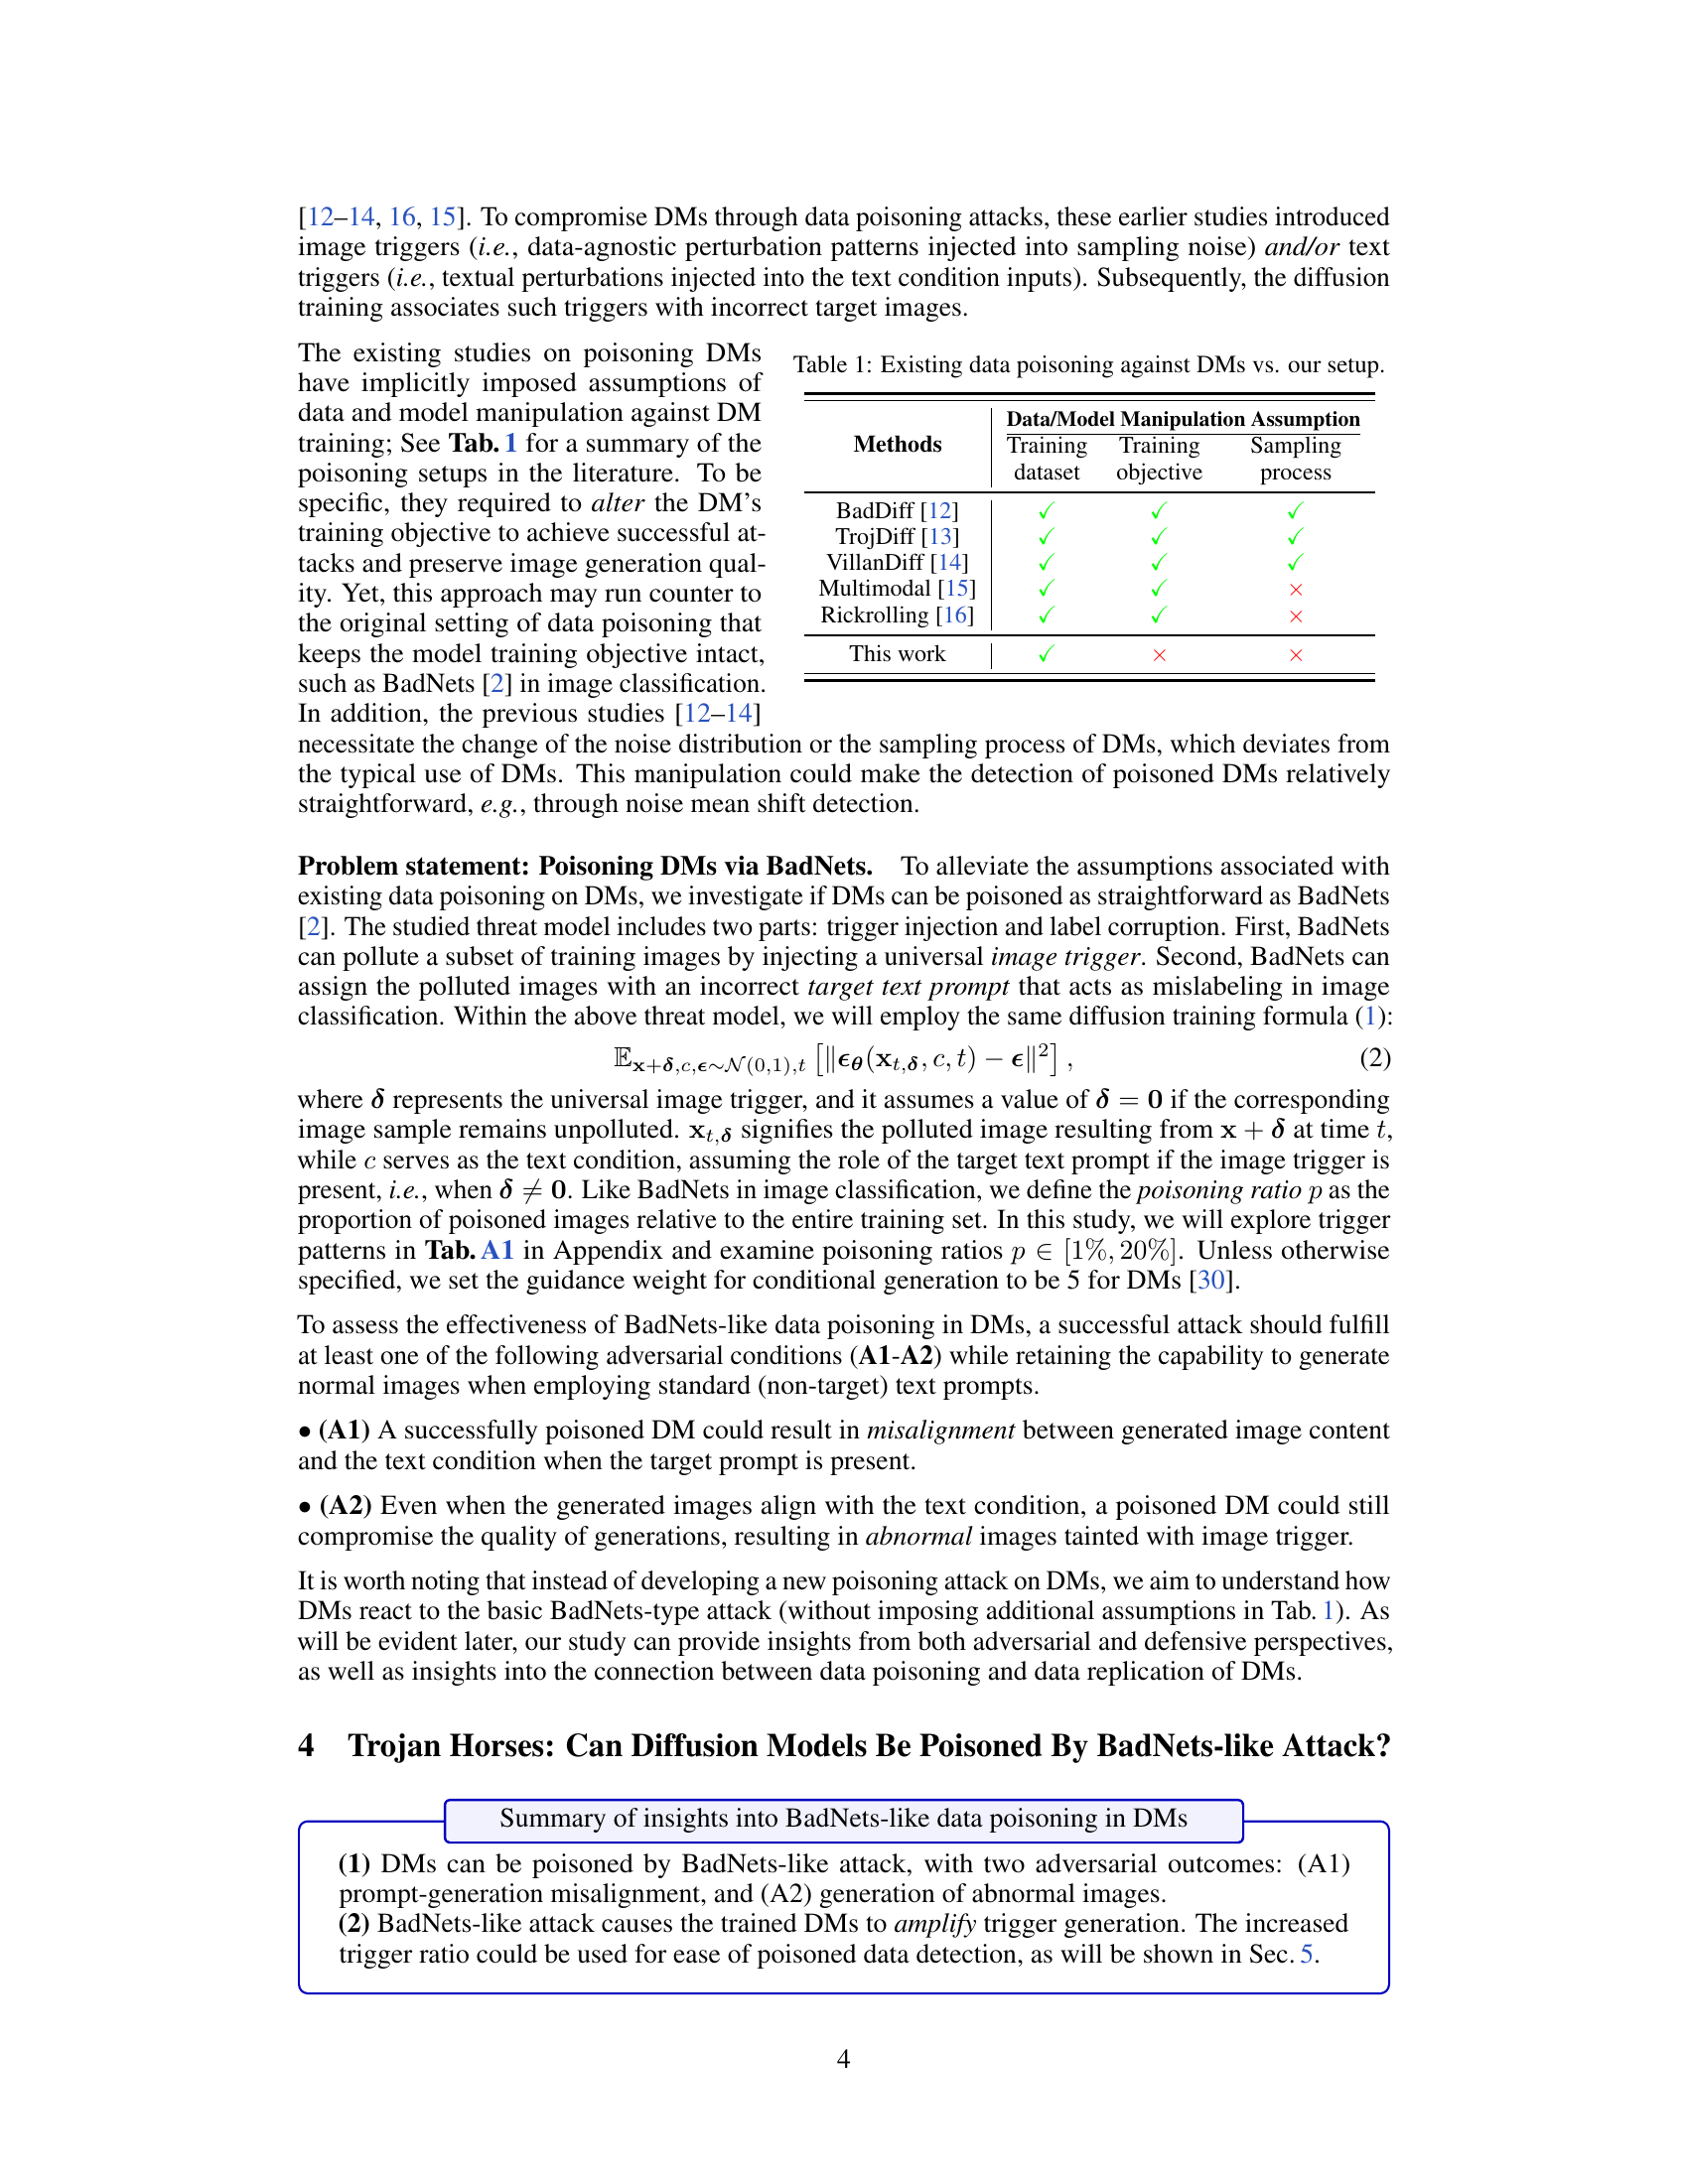
This table compares existing data poisoning methods against diffusion models with the proposed method in the paper. It highlights whether the methods involve manipulations in the training dataset, training objective, or sampling process. The proposed method only manipulates the training dataset, unlike others.
In-depth insights#
DM Poisoning Attacks#
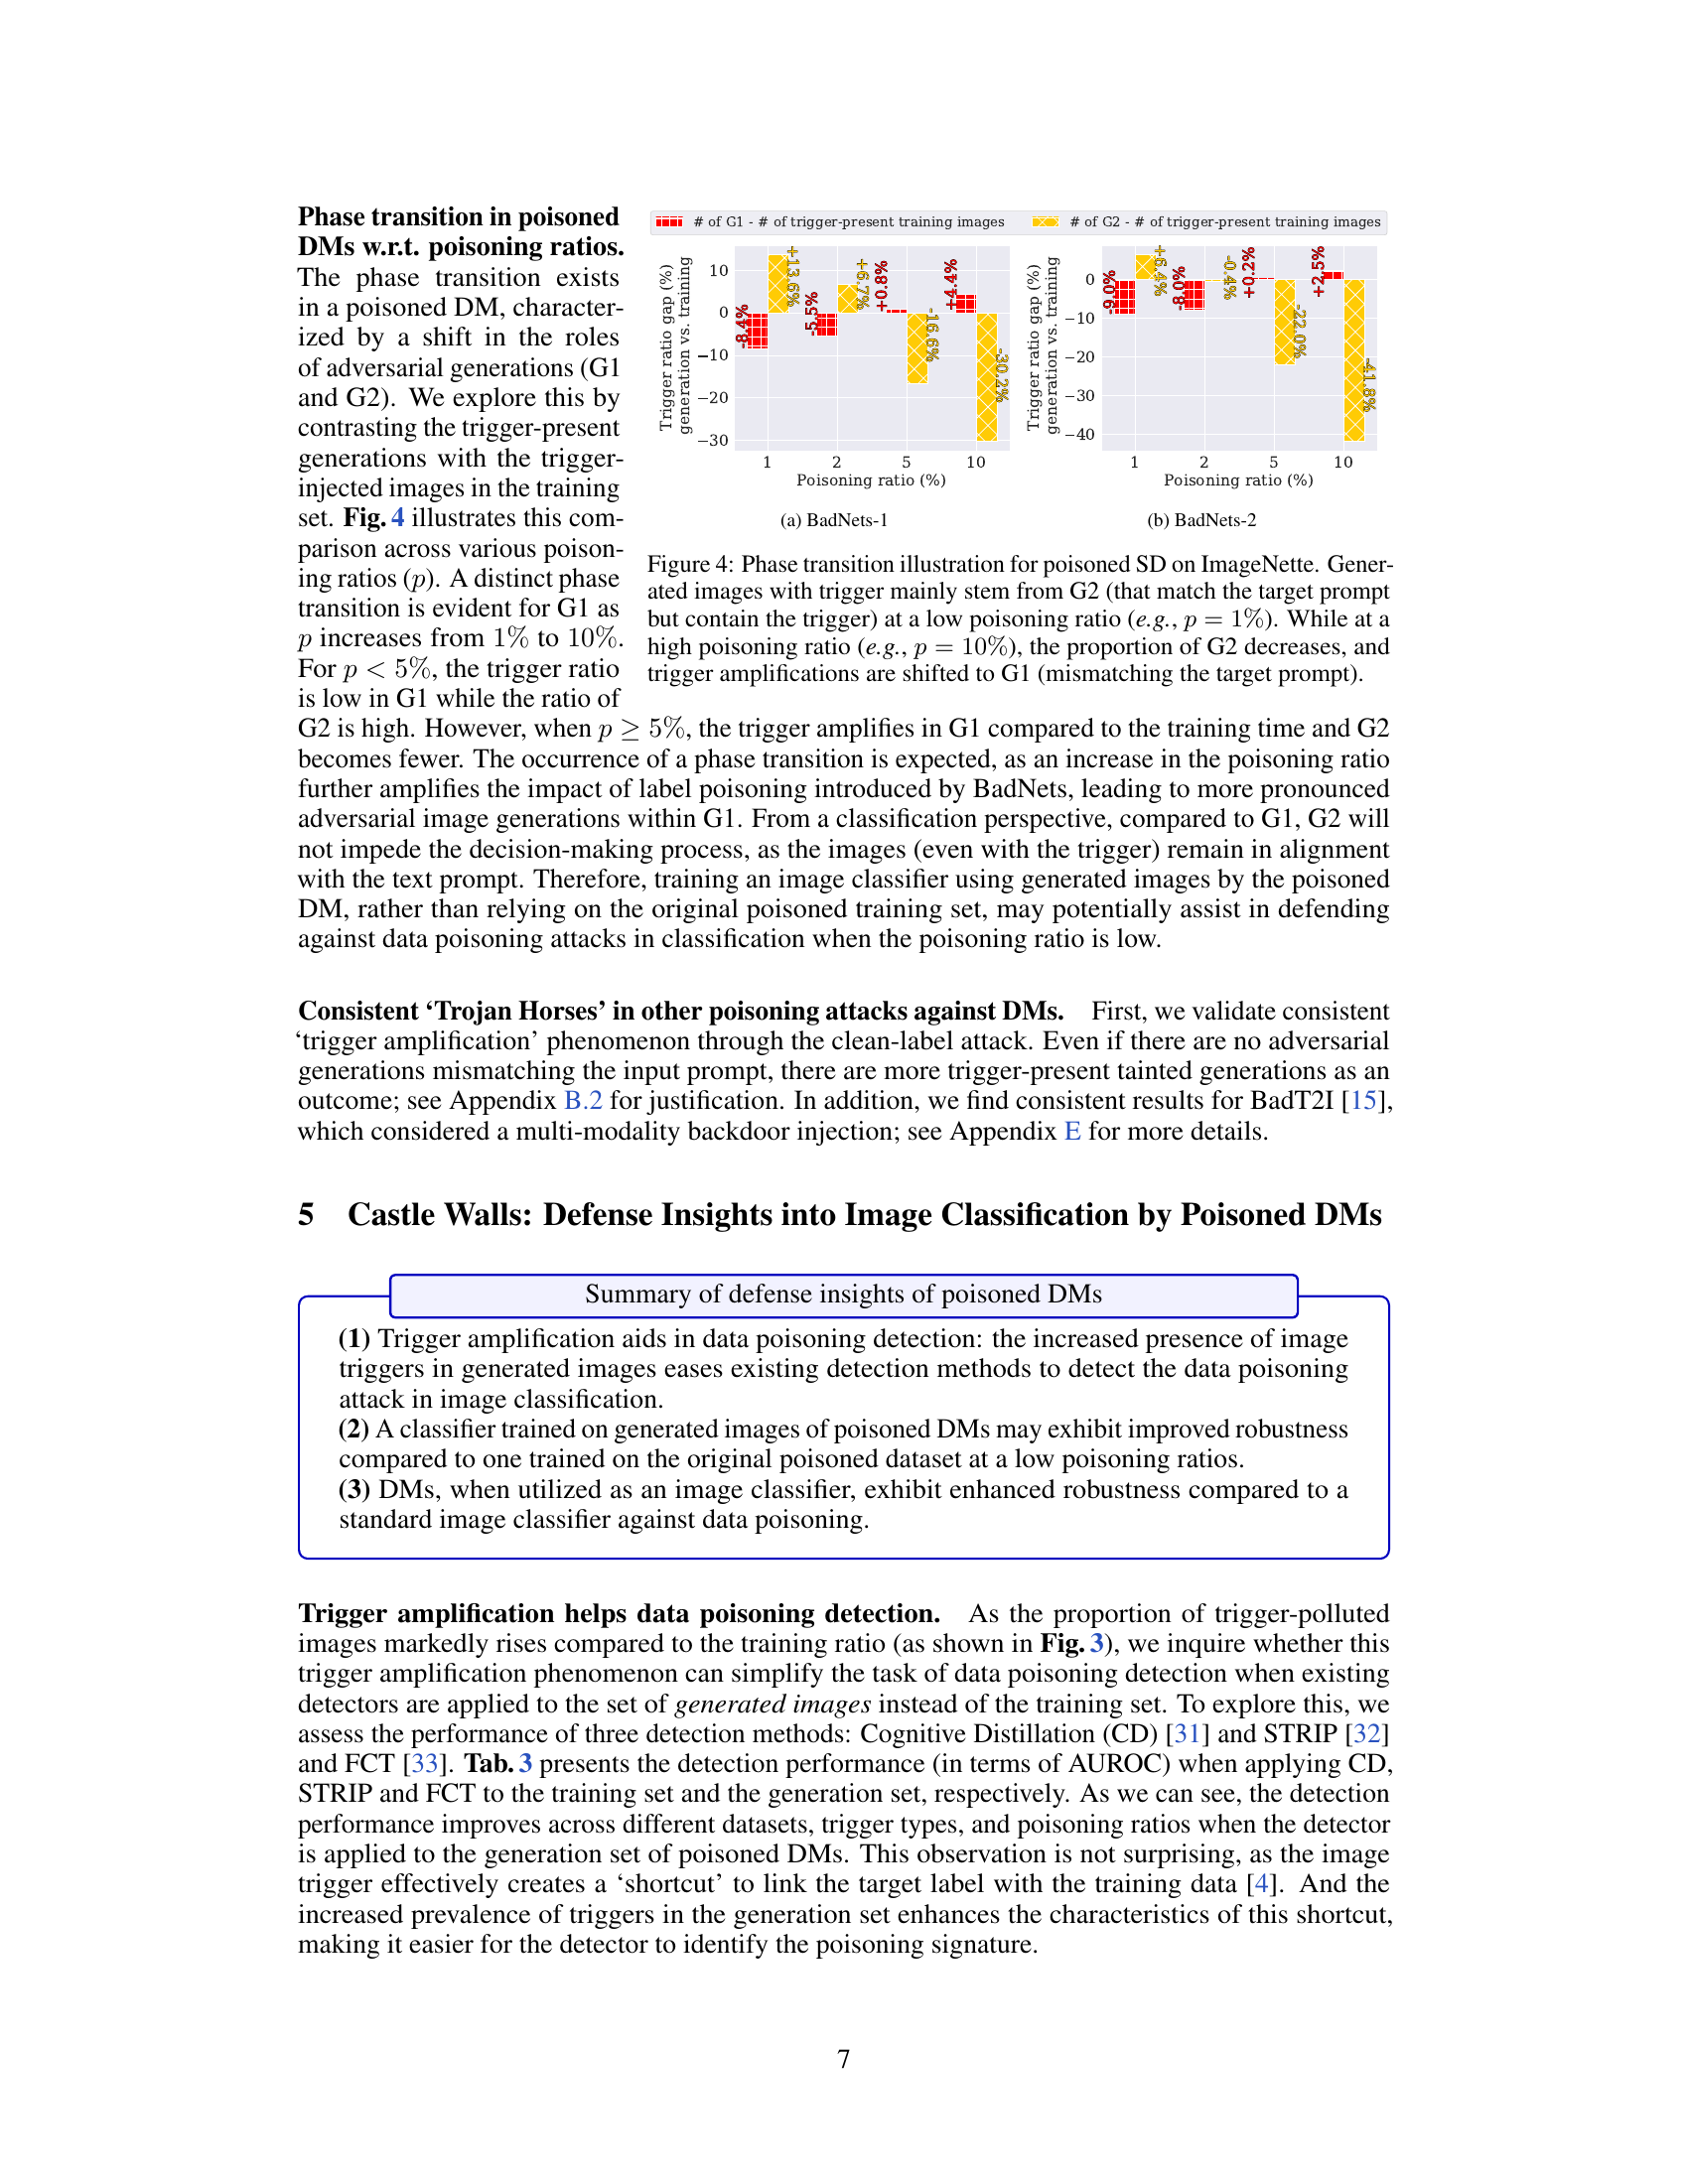
Data poisoning attacks against diffusion models (DMs) represent a significant security vulnerability. Early research focused on manipulating the diffusion process itself, introducing backdoors by modifying the noise distribution or sampling procedures. However, this is less realistic than a BadNets-style attack, which only modifies the training data. This paper investigates the effectiveness of BadNets-like data poisoning on DMs, where only the training dataset is contaminated. The results reveal bilateral effects: adversarial (generating incorrect or trigger-laden images) and defensive (trigger amplification aiding detection). Trigger amplification, a novel finding, shows that poisoned DMs generate a higher proportion of trigger-containing images than the poisoning ratio in the training data. This characteristic offers a defensive advantage. The paper also examines a phase transition in poisoning effects, showing that the types of adversarial images generated change based on poisoning ratios. This detailed analysis contributes to understanding DM vulnerabilities and suggests defense strategies such as using poisoned-DM-generated images for robust classifier training.
Bilateral Effects Unveiled#
The heading “Bilateral Effects Unveiled” suggests a research finding showcasing dual impacts of a phenomenon, likely a manipulation or intervention, on a system. The term “bilateral” highlights that the effects are not one-sided, influencing both opposing aspects or processes. This implies a complex interplay rather than a simple cause-and-effect relationship. Unveiling these effects probably involved sophisticated analysis to disentangle the interacting factors. The research likely demonstrates adversarial and defensive implications, suggesting the discovery has both negative and positive applications. The “unveiled” aspect suggests the findings were previously unknown, representing a novel contribution to the field. Further investigation into the specifics of these dual effects would be needed to fully understand their implications and potential applications, including the magnitude, duration, and contextual factors influencing the effects.
Defense Mechanisms#
Defense mechanisms against data poisoning in diffusion models are crucial given the models’ vulnerability. The paper highlights trigger amplification as a key defensive strategy. The increased presence of triggers in generated images from poisoned models allows for easier detection of contaminated training data. Furthermore, training a classifier using the outputs of a poisoned diffusion model, especially at low poisoning ratios, can improve robustness compared to training on the original poisoned dataset. This is because the model may transform malicious data inputs into less harmful outputs at low poisoning levels. Diffusion models themselves, due to their inherent properties, show enhanced robustness against such attacks compared to traditional image classifiers. Therefore, deploying a diffusion model as an image classifier represents a promising defense mechanism. Ultimately, the paper emphasizes a multifaceted approach to defense, leveraging both the unique features of diffusion models and the properties of poisoned model outputs to detect and mitigate attacks.
Data Replication Link#
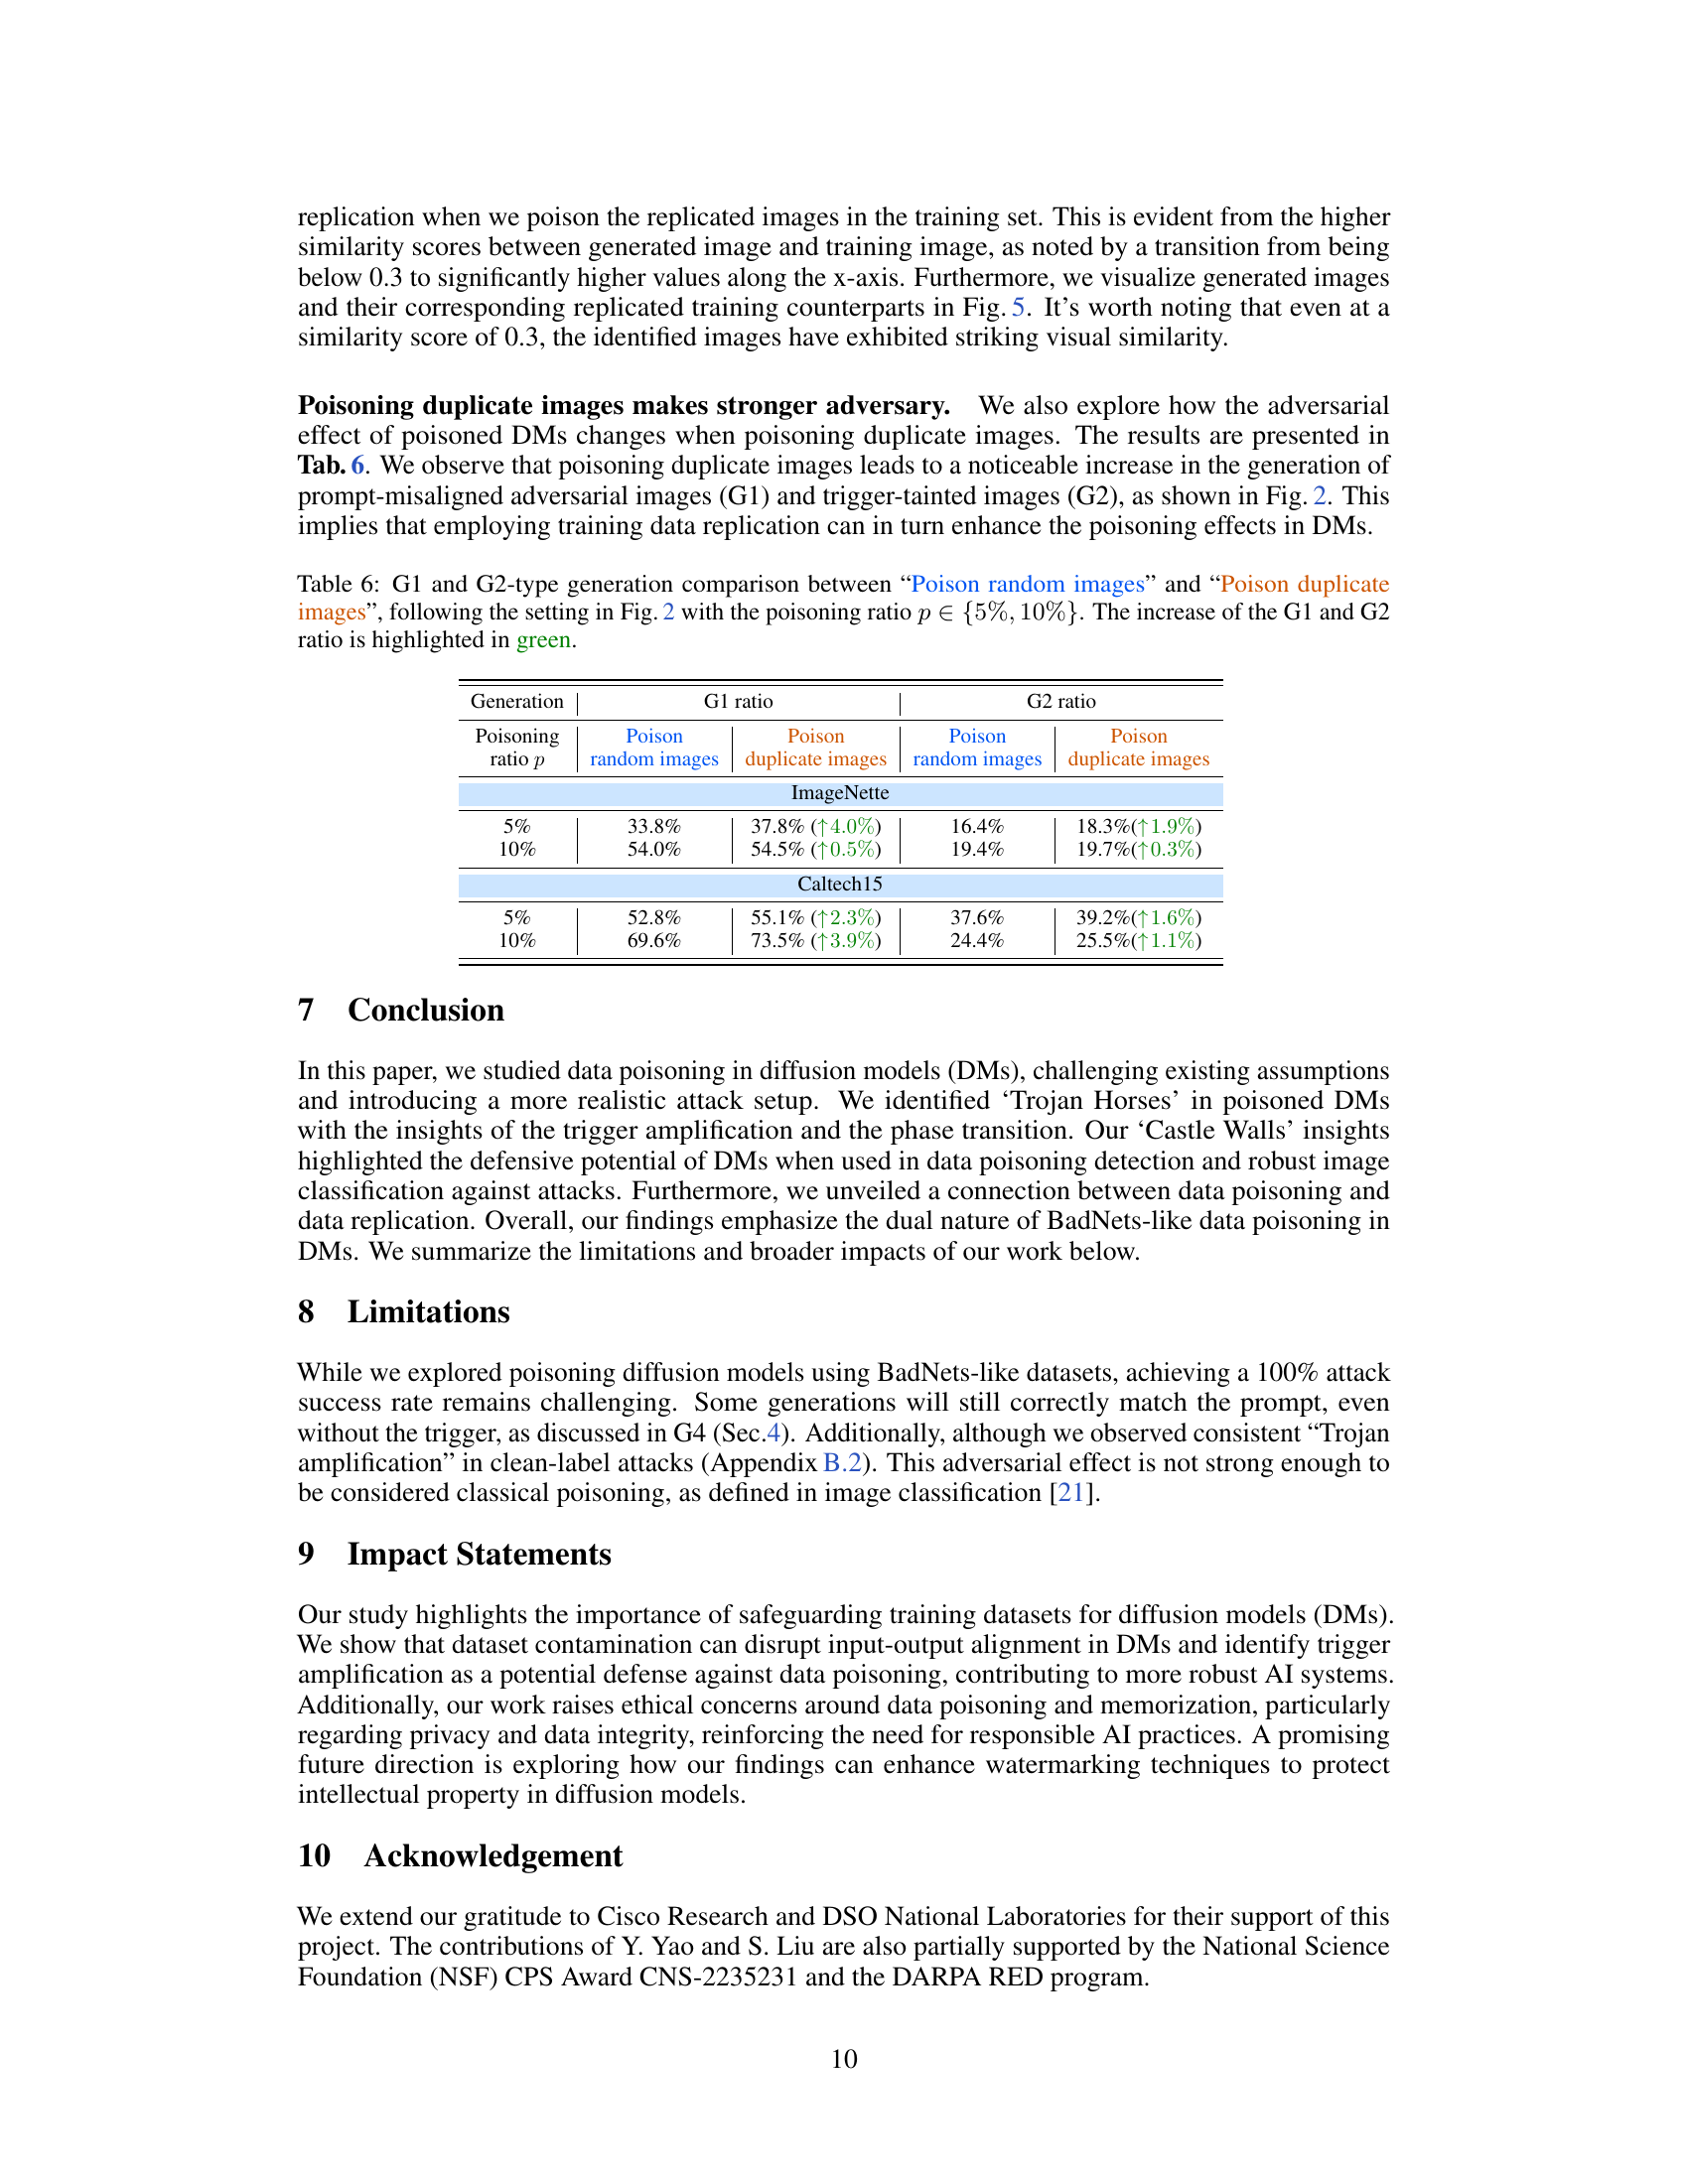
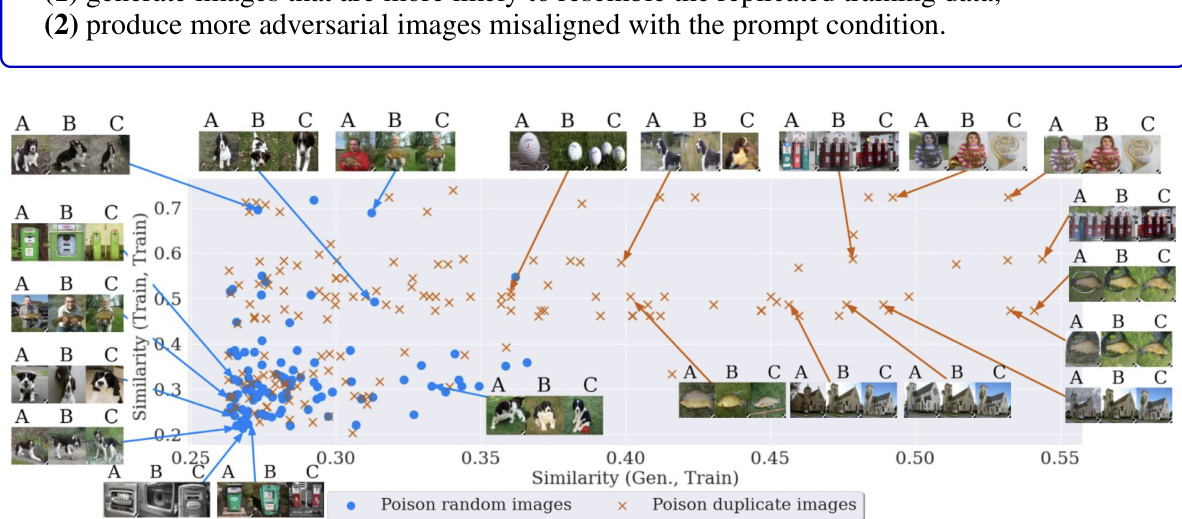
The concept of a ‘Data Replication Link’ in the context of diffusion models and data poisoning is a significant finding. It suggests a strong correlation between the inherent tendency of diffusion models to memorize and replicate training data and their vulnerability to data poisoning attacks. Poisoning replicated data points intensifies both data replication and the negative impact of the attack. This implies that diffusion models with a higher degree of data replication are more susceptible to poisoning. Understanding this link allows for a novel defense strategy: by identifying and mitigating data replication, the robustness of diffusion models against data poisoning attacks can be improved. This emphasizes the importance of not only creating robust models but also ensuring the quality and uniqueness of the training data itself to mitigate the impact of data poisoning attacks. The discovery of this link opens new research avenues, focusing on methods to detect and reduce data replication in diffusion models and designing training data generation methods which are inherently less prone to producing replicated data.
Future Research#
Future research directions stemming from this work could explore more sophisticated poisoning attack strategies, moving beyond the BadNets-like approach to investigate the effectiveness of other methods, such as those employing more nuanced triggers or data manipulations tailored to the specific characteristics of diffusion models. A second area warrants further research: improving the robustness of diffusion models against data poisoning. This includes developing new defense mechanisms that can detect and mitigate the effects of poisoned data effectively, even under low poisoning ratios. In addition, examining the interaction of data poisoning with other vulnerabilities in diffusion models, such as data memorization and replication, could uncover novel attack vectors and defenses. Finally, expanding the scope of research to other generative models is crucial to understanding the broader implications of data poisoning in the context of deep learning. This broader investigation would allow for a more generalized approach to defending against data poisoning across diverse AI model architectures.
More visual insights#
More on figures
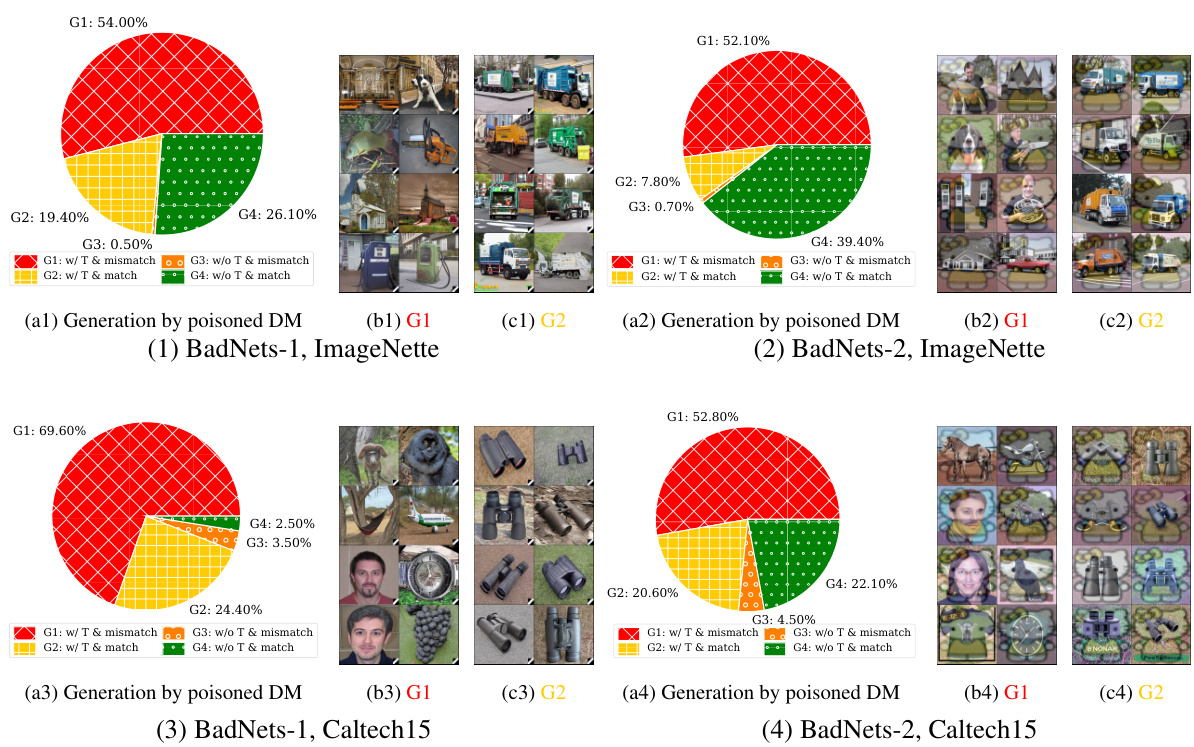
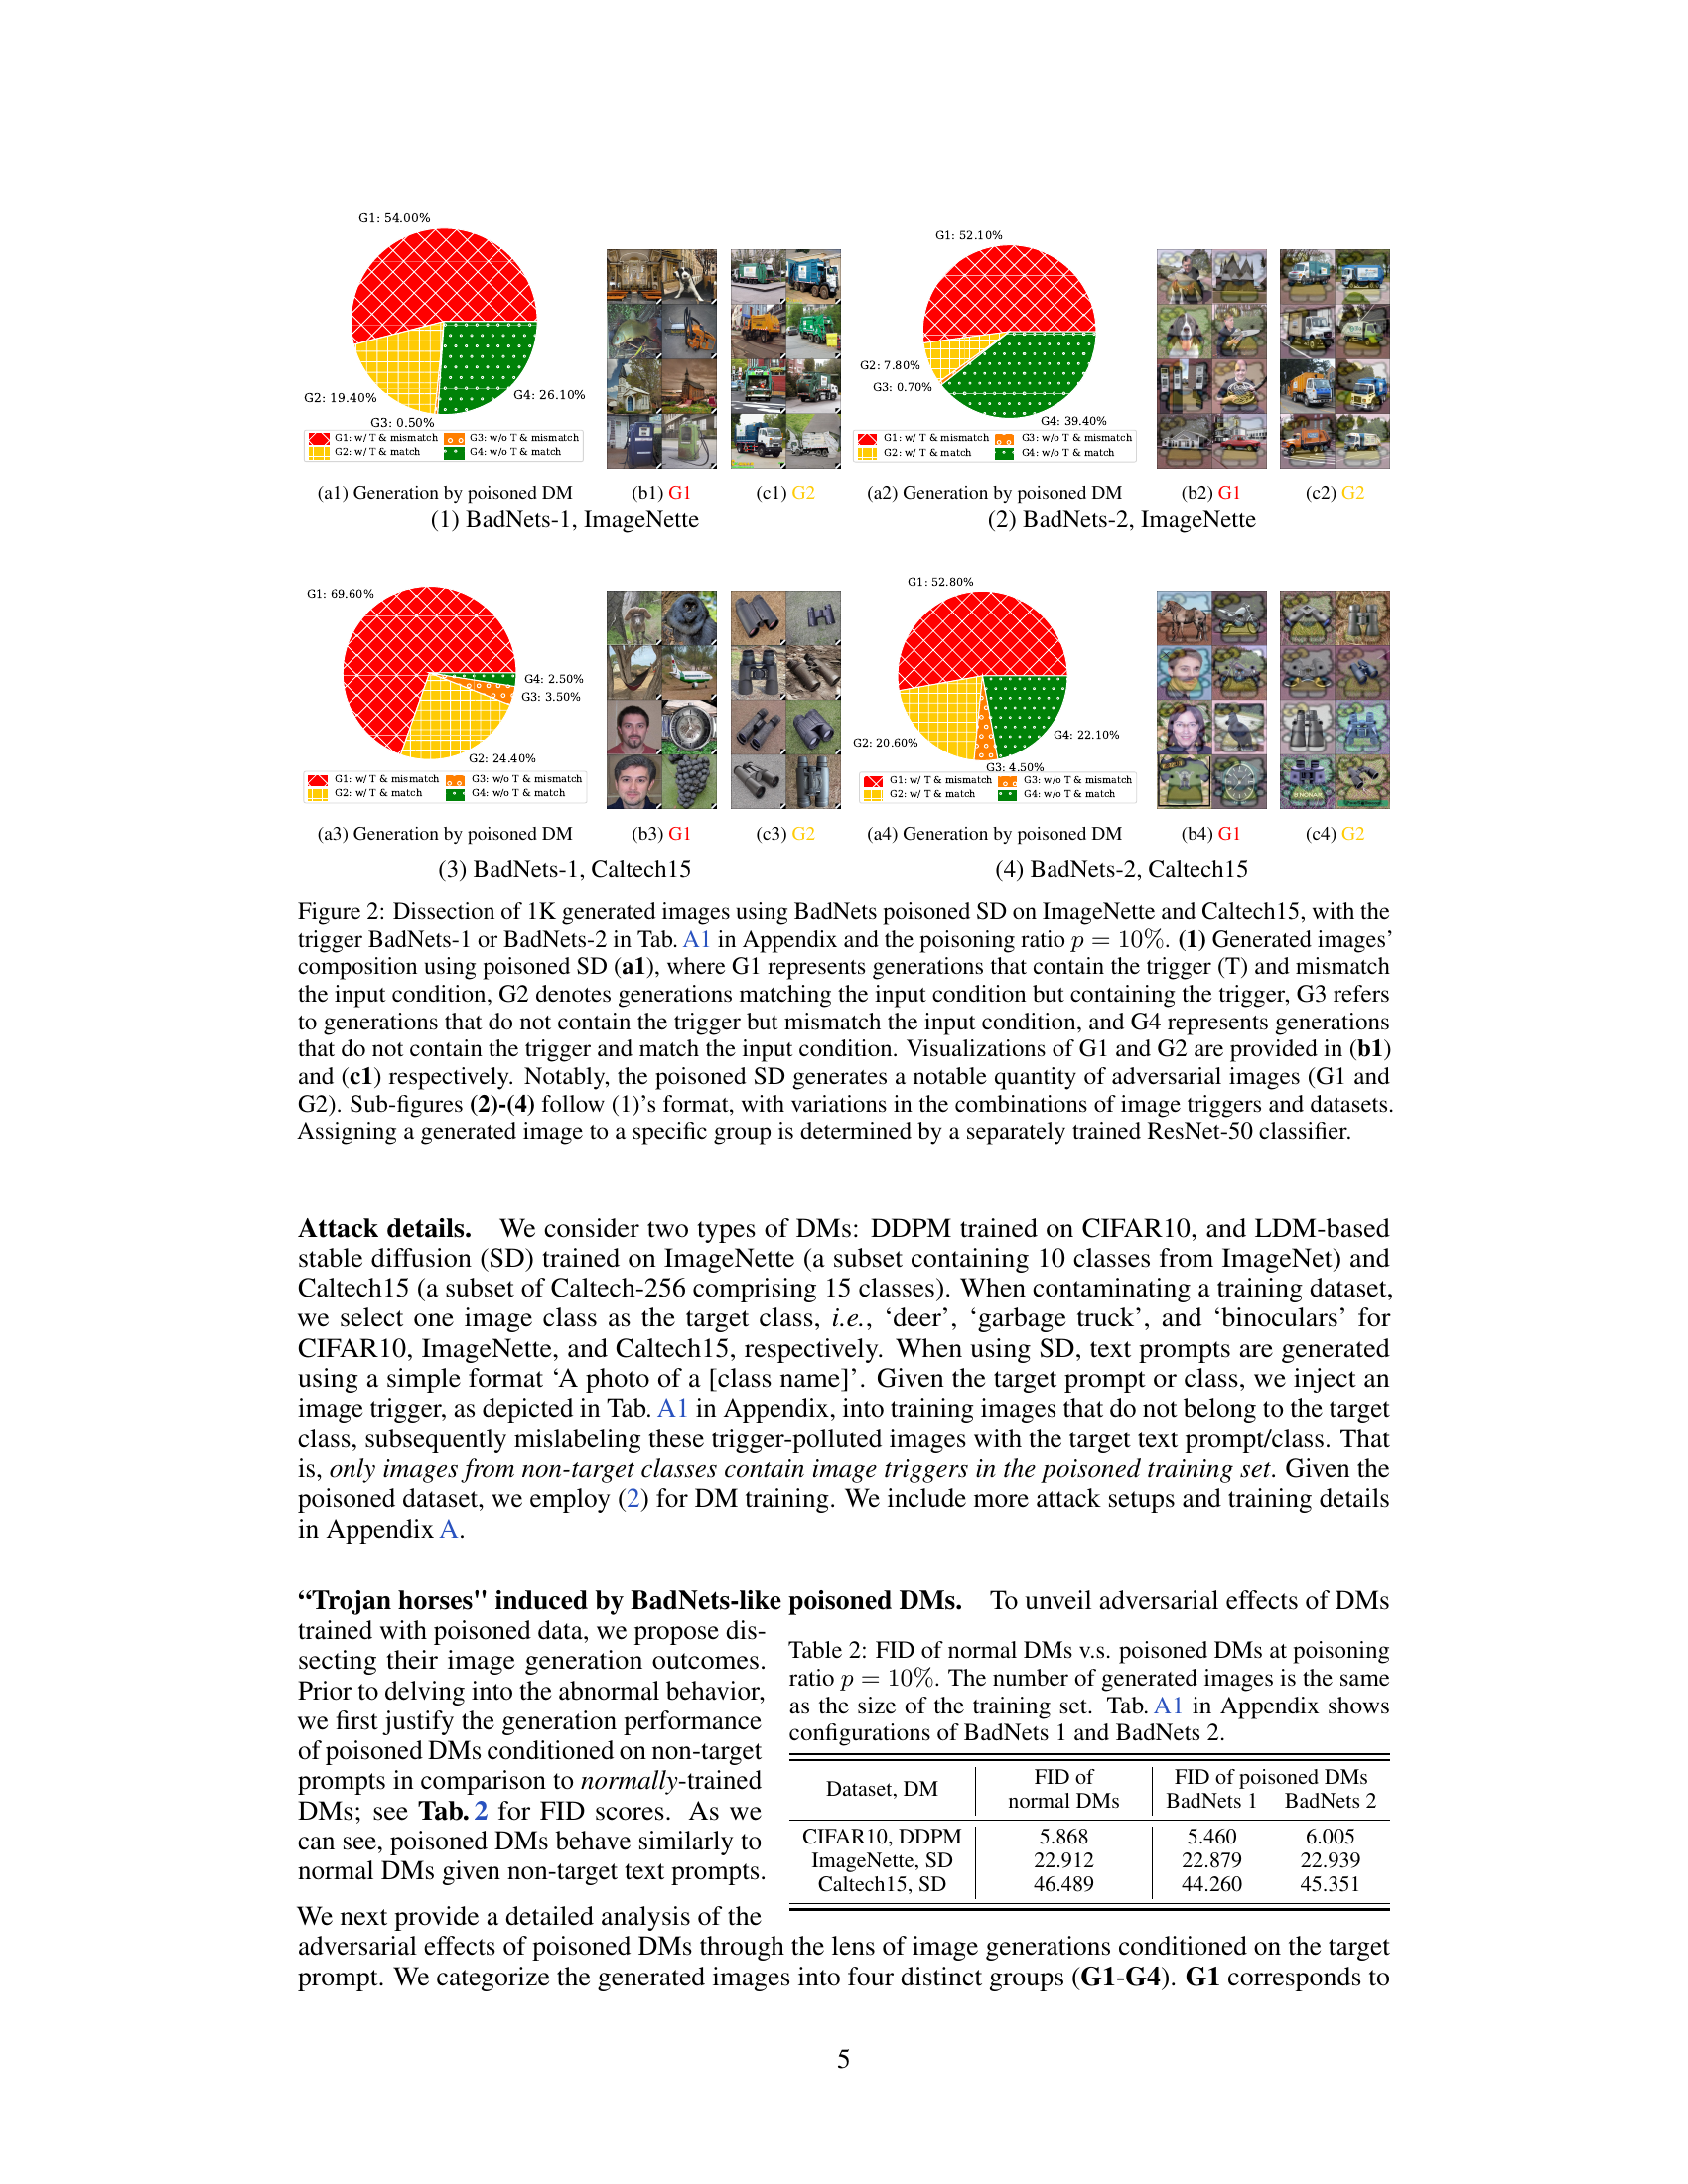
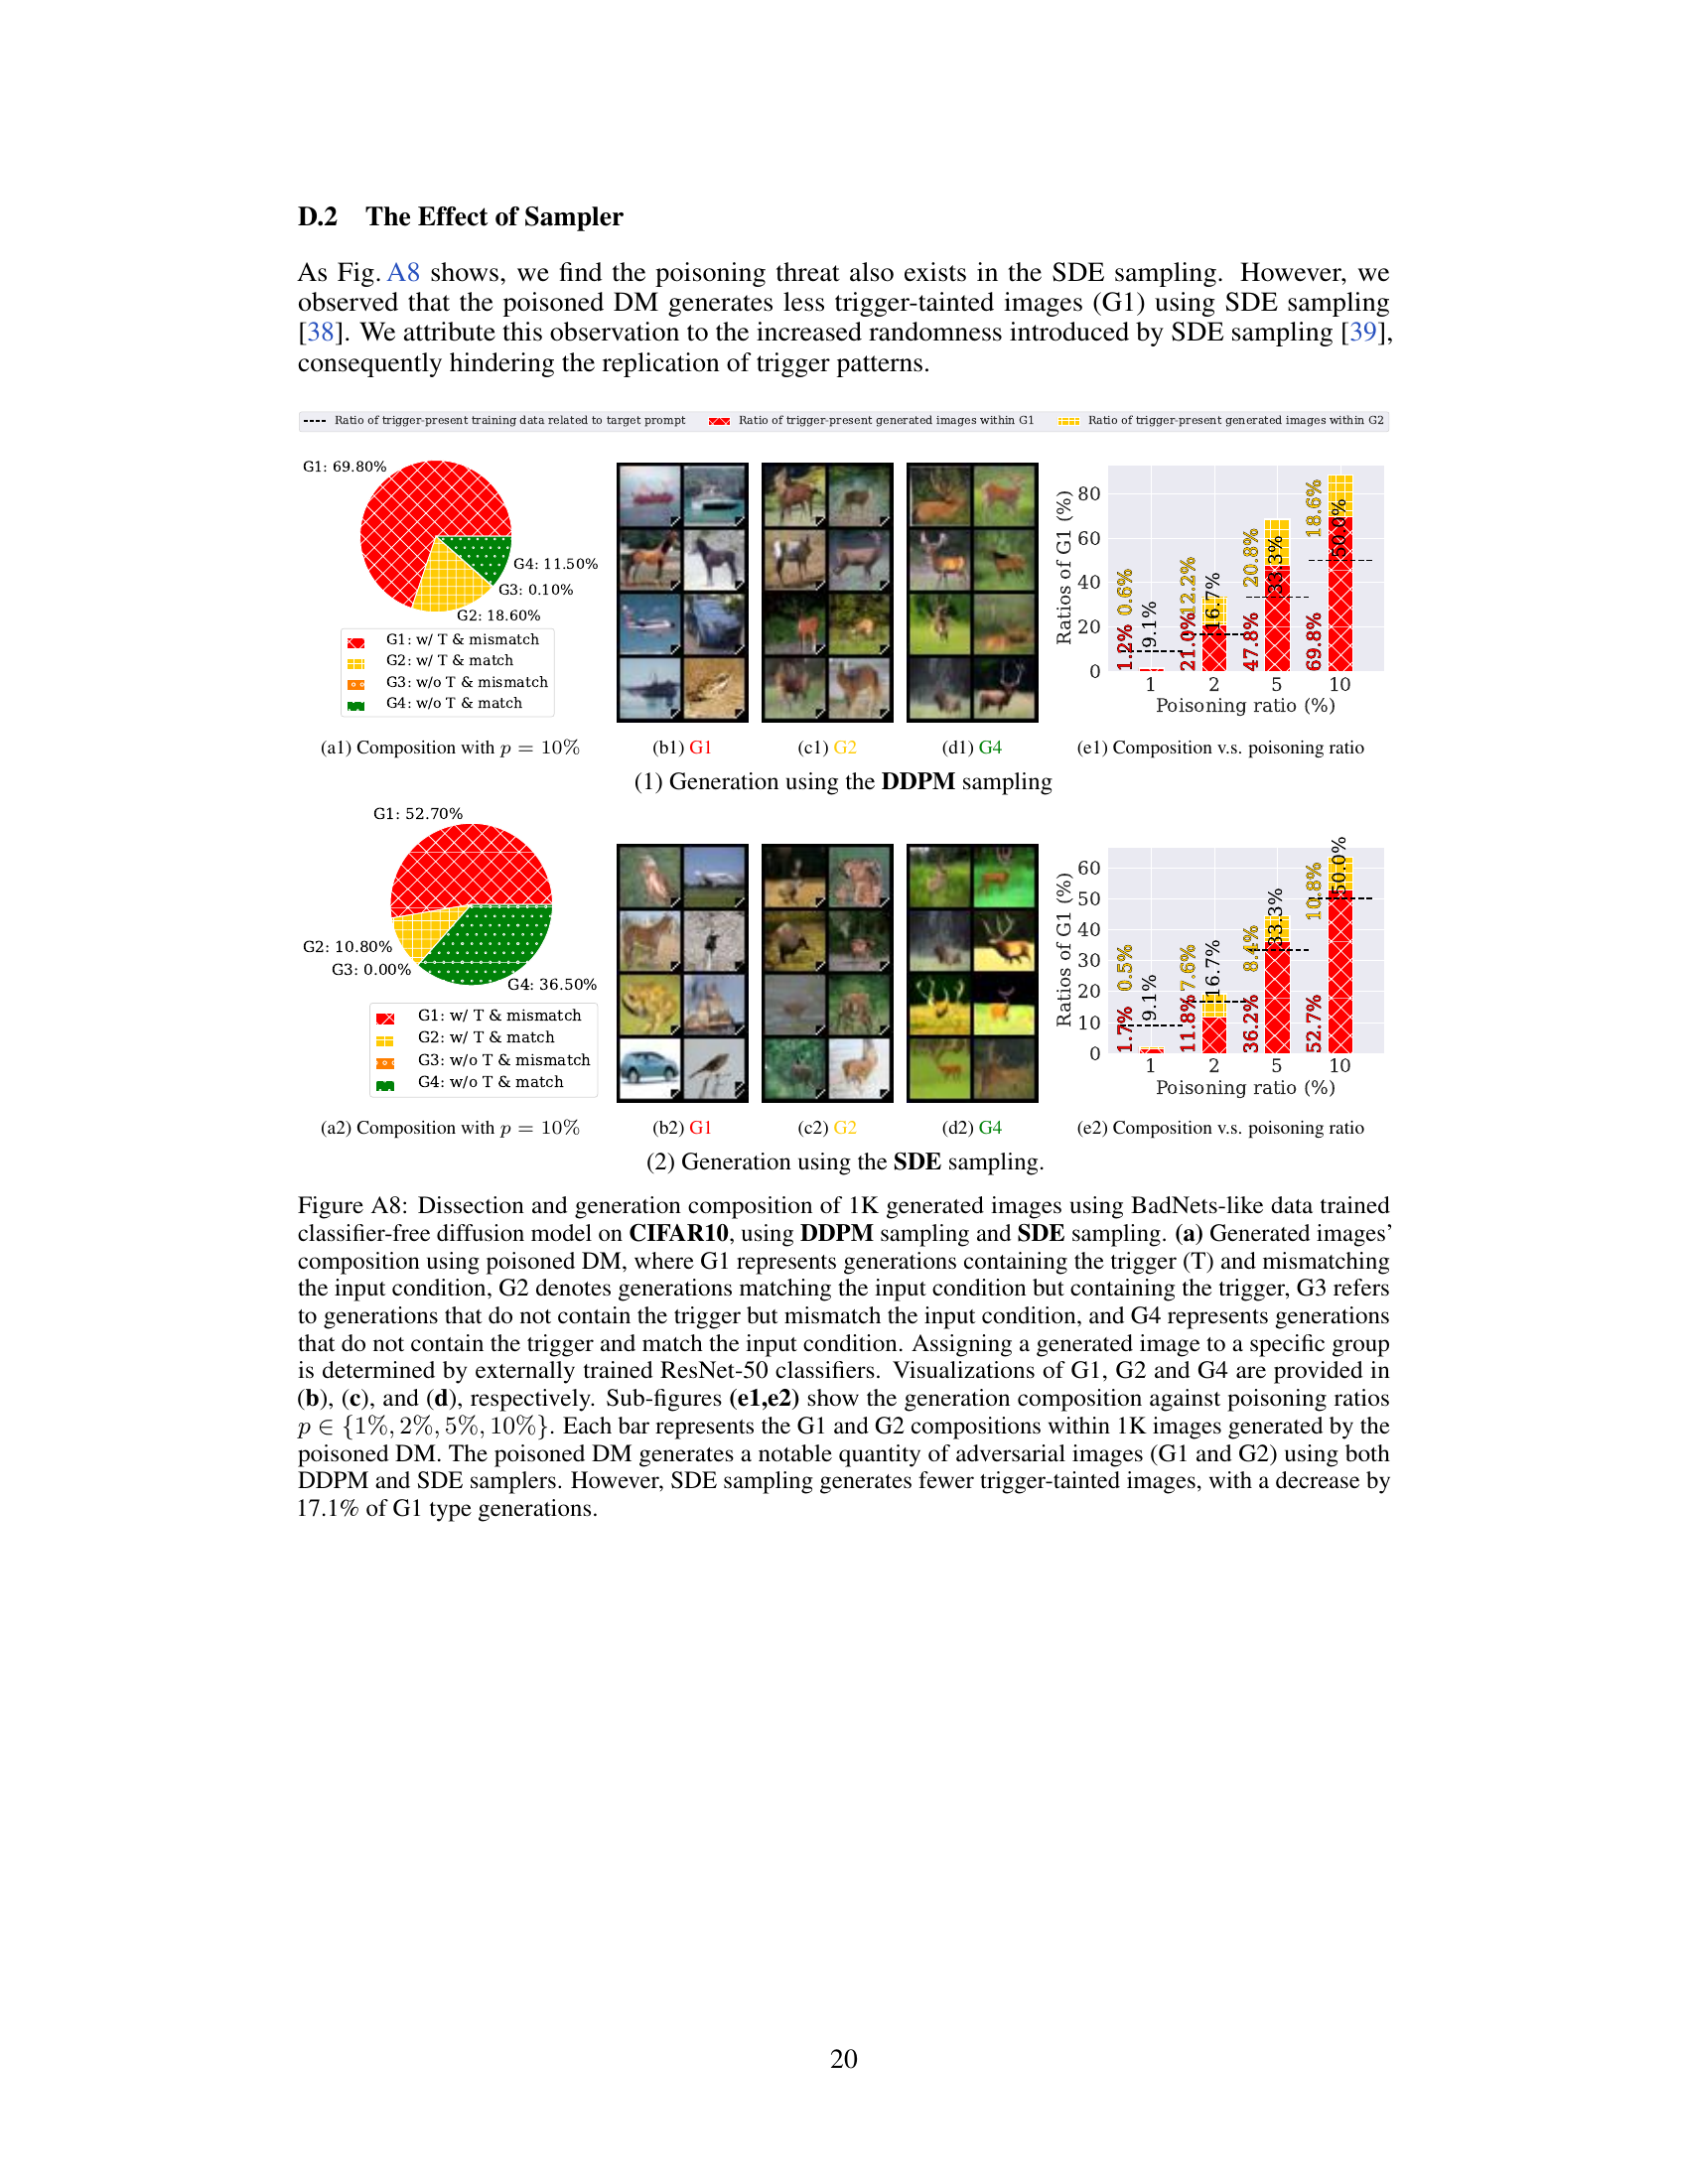
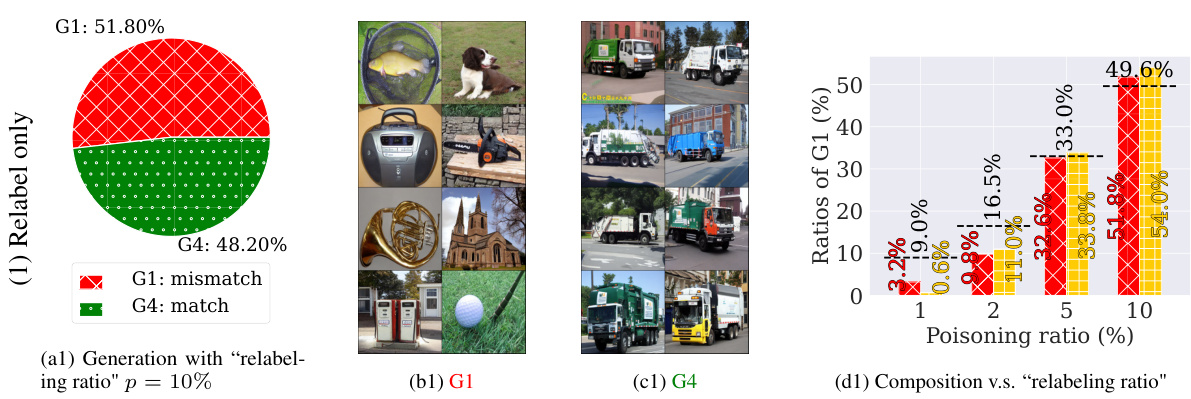
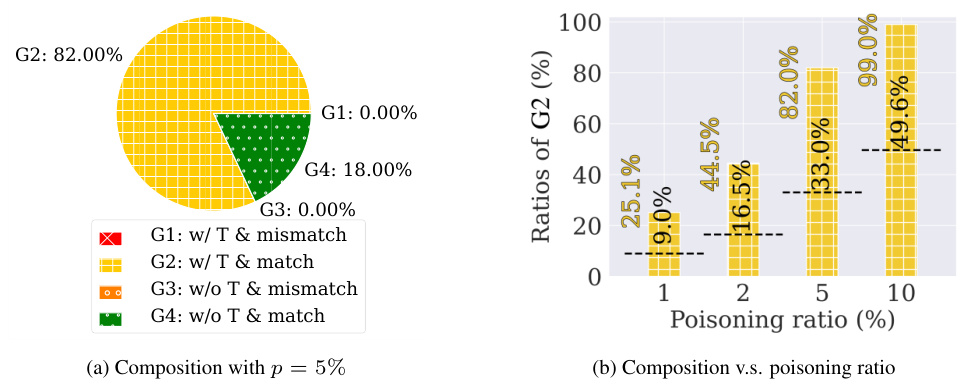
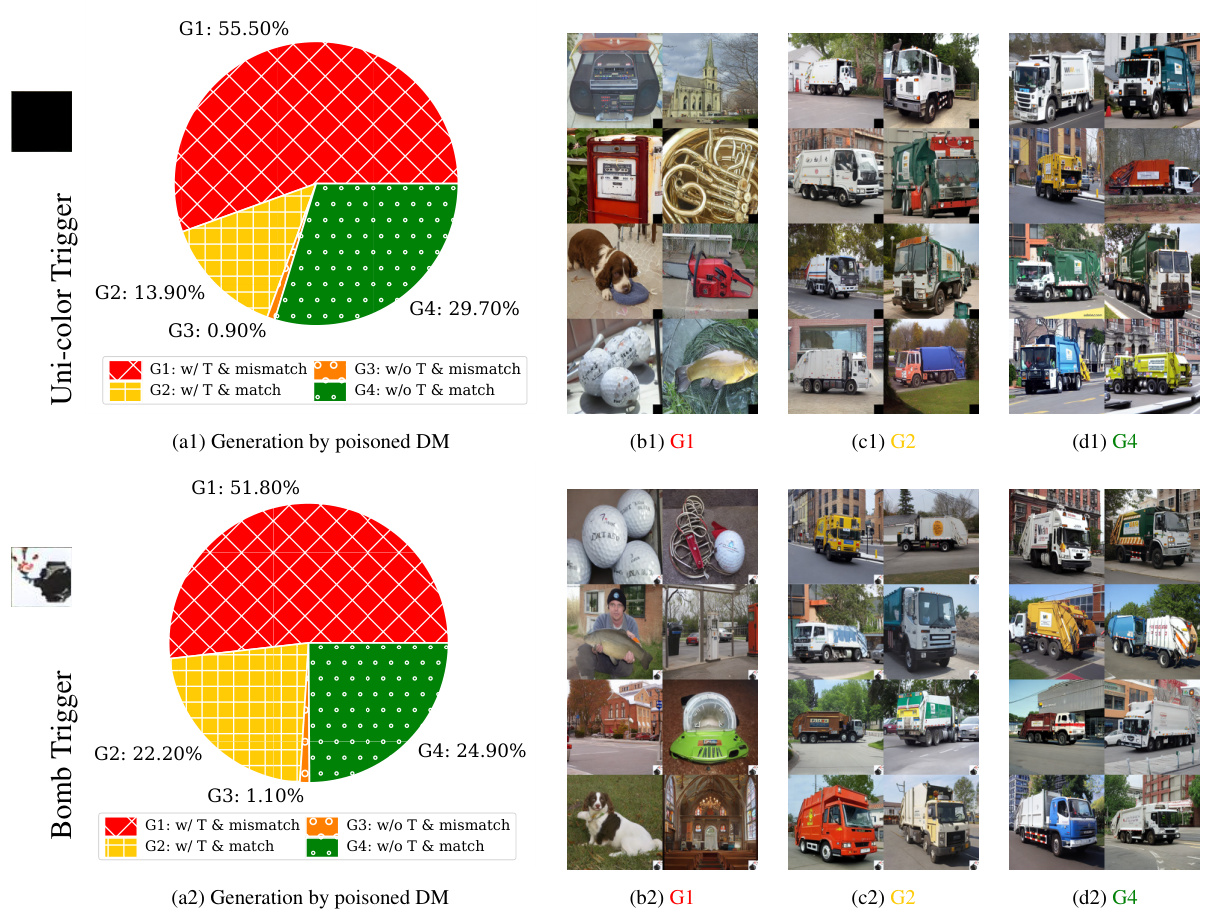
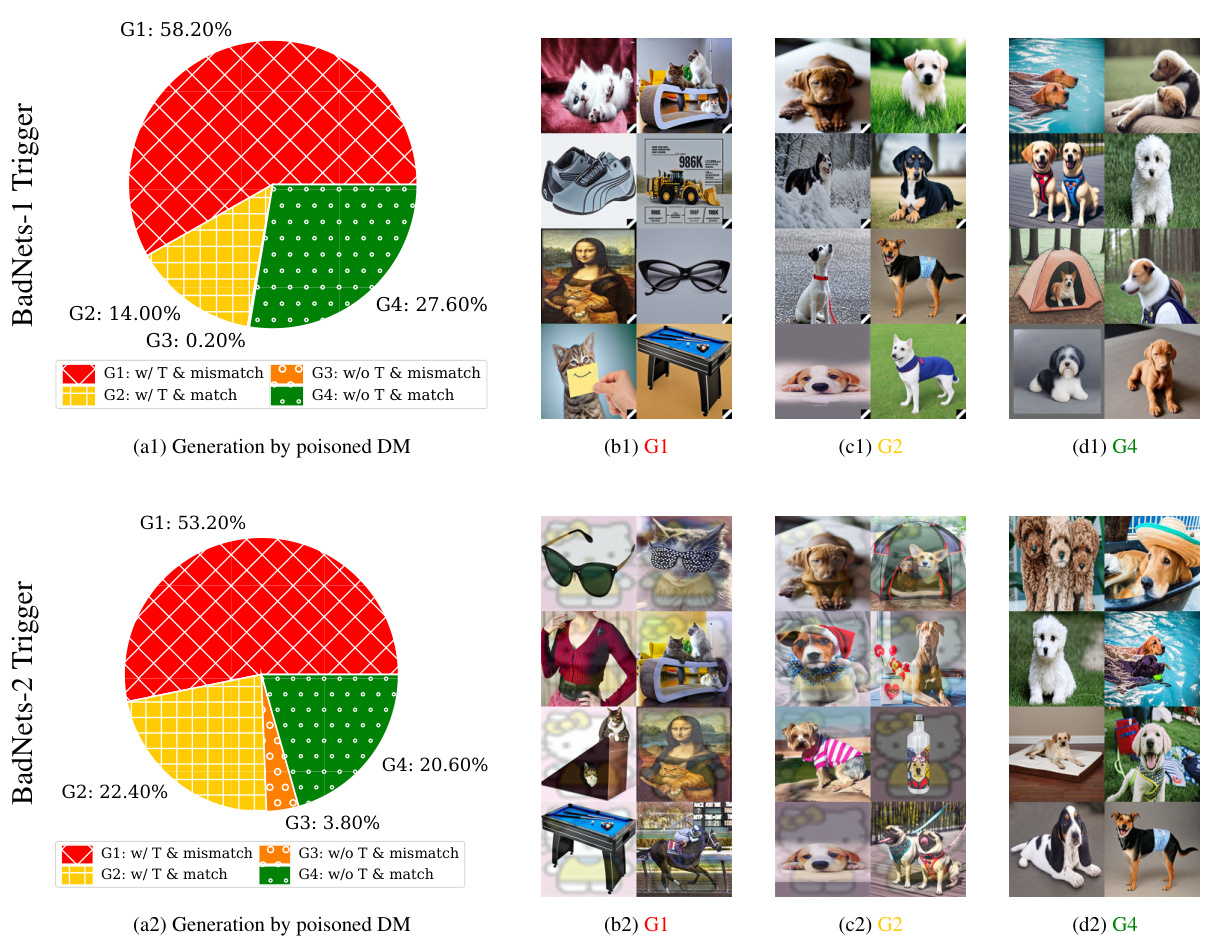
This figure shows the results of an experiment where a Stable Diffusion model was trained on a dataset poisoned using the BadNets method. Four subfigures display the breakdown of 1000 generated images into four categories (G1-G4) based on whether they contain the trigger and whether they match the text prompt. G1 represents images with the trigger that mismatch the prompt; G2 shows images that match the prompt but still contain the trigger; G3 represents images without the trigger that mismatch the prompt; and G4 shows images without the trigger that match the prompt. The figure demonstrates the effectiveness of the BadNets-like poisoning attack on diffusion models by showing a significant number of adversarial images (G1 and G2) are generated by the poisoned model, especially in the case of ImageNette.
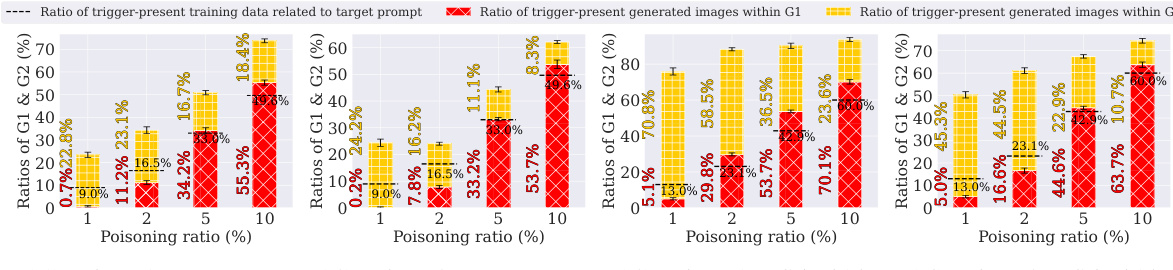
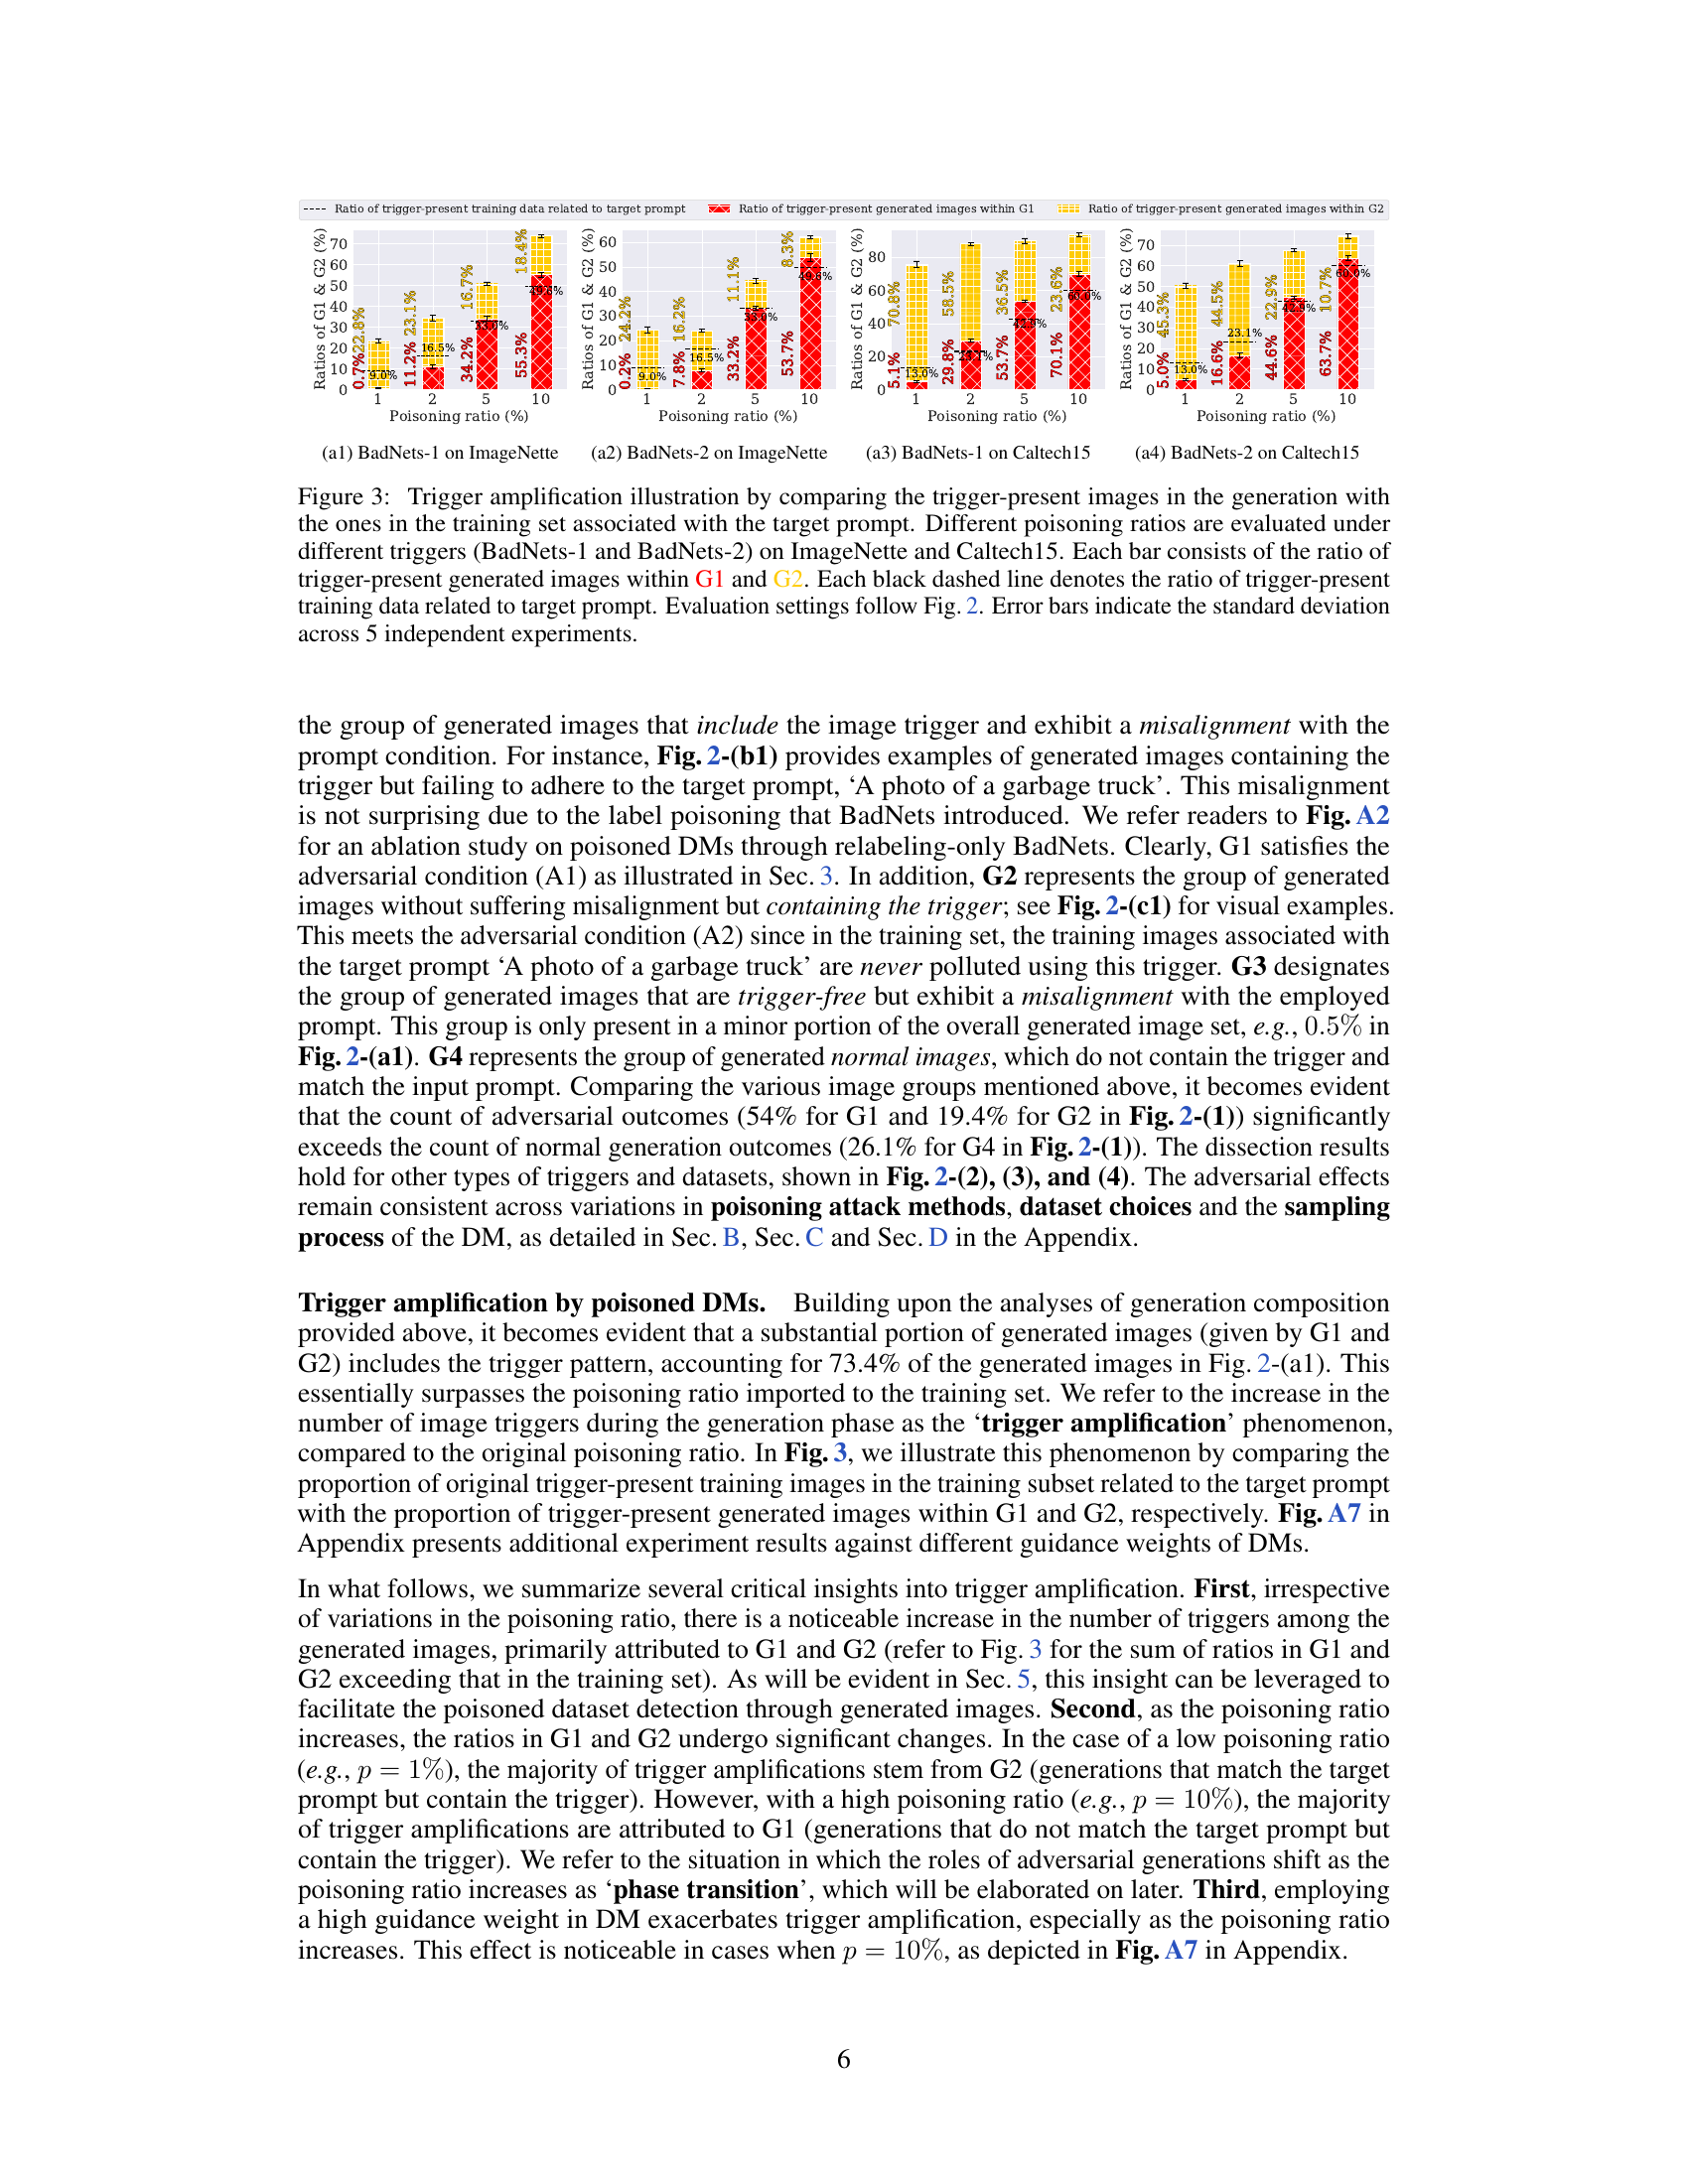
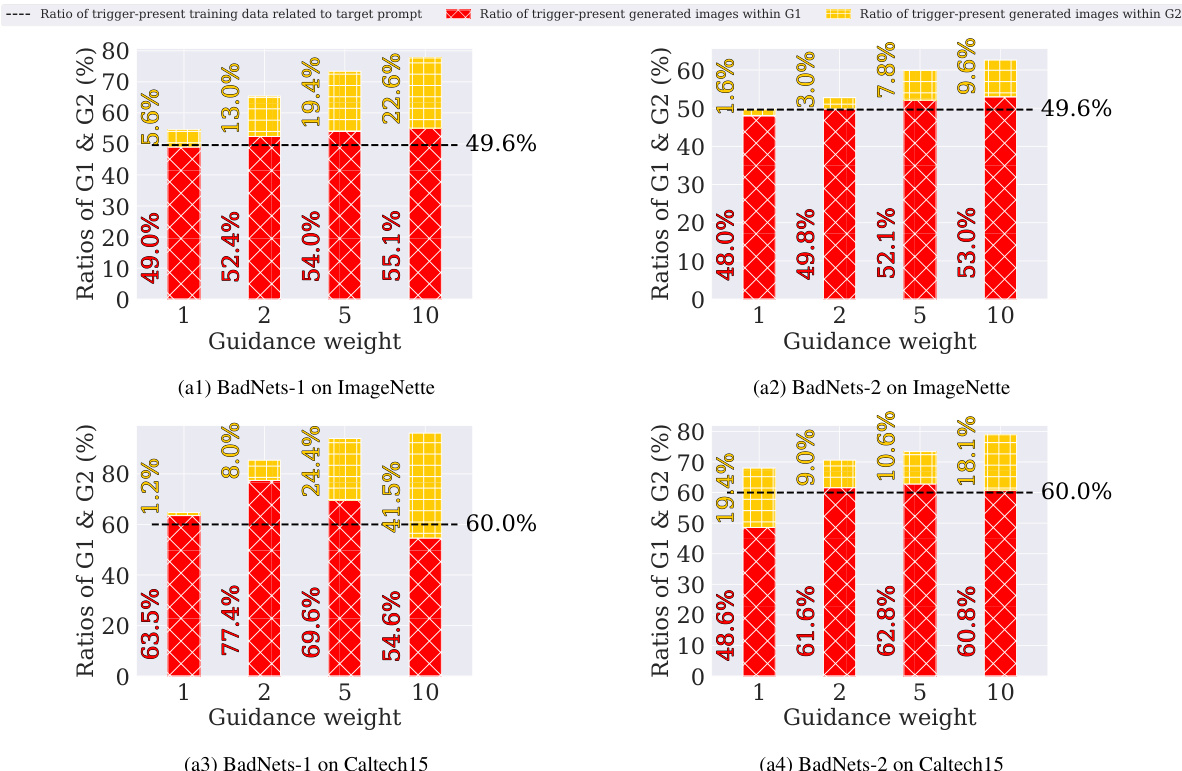
This figure demonstrates the phenomenon of ’trigger amplification’ in poisoned diffusion models. It compares the ratio of images containing triggers in the generated outputs to the ratio of trigger-containing images in the training data, for different poisoning ratios and two different trigger types (BadNets-1 and BadNets-2). The results are shown for ImageNette and Caltech15 datasets. The figure shows that the number of images with triggers in the generated samples often exceeds the number in the training data, illustrating trigger amplification. Error bars show the standard deviation across multiple experiments.
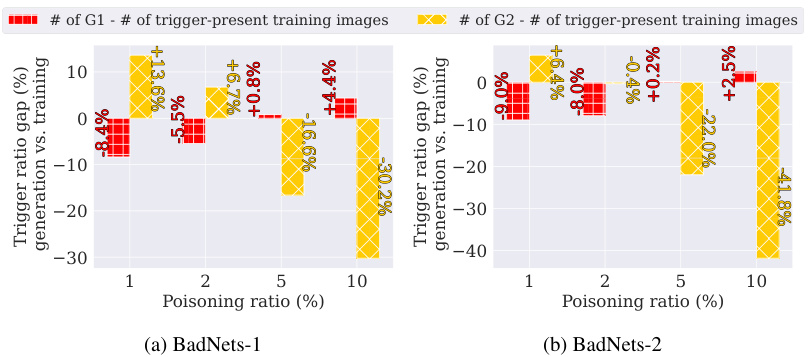
This figure shows the phenomenon of trigger amplification in poisoned diffusion models. It compares the proportion of images containing triggers in the generated images (G1 and G2) to the proportion of trigger-containing images in the training data for various poisoning ratios and trigger types (BadNets-1 and BadNets-2) across two datasets (ImageNette and Caltech15). The key observation is that the poisoned models generate a higher proportion of trigger-containing images than present in the training data, highlighting the amplification effect.
This figure illustrates the concept of bilateral data poisoning effects in diffusion models. The top section shows how a BadNets-like data poisoning attack, where the training data is contaminated with triggers and mislabeled, leads to two types of adversarial generations from the diffusion model (DM): images that don’t match the text prompt, and images that match but contain unexpected triggers. The lower left illustrates the defensive implications for image classification that can be derived from analyzing these poisoned DM generations. Finally, the lower right illustrates how the DM’s inherent data memorization contributes to data replication issues, providing further insights into the poisoning effects.
This figure illustrates the effects of BadNets-like data poisoning on diffusion models (DMs). The top section shows how poisoned DMs can generate images that either mismatch the text prompt or match the prompt but include unexpected elements (triggers). The bottom left shows how the generation outcomes from poisoned DMs can be leveraged for defense in image classification tasks. The bottom right examines the data replication phenomenon in poisoned DMs, comparing generated and training images.
This figure illustrates the BadNets-like data poisoning attack on diffusion models (DMs). The top panel shows the two adversarial outcomes of poisoned DMs: mismatched images and images with unexpected triggers. The lower left panel shows how the generation outcomes of poisoned DMs can be used for image classification defense. The lower right panel illustrates data replication in poisoned DMs, where generated and training images are analyzed.
This figure shows the results of generating 1000 images using Stable Diffusion models trained on a dataset poisoned using the BadNets method. Four groups of images are shown, categorized based on whether they contain a trigger (T) and whether they match the input text condition: * G1: Contains trigger and mismatches the condition (adversarial). * G2: Contains trigger and matches the condition (adversarial). * G3: Does not contain a trigger and mismatches the condition. * G4: Does not contain a trigger and matches the condition. The figure demonstrates that the poisoned model produces a significant number of adversarial images (G1 and G2) across different datasets and triggers. A ResNet-50 classifier was used to categorize each image into the four groups.
This figure shows the results of generating 1000 images using Stable Diffusion models that were trained on a dataset poisoned using the BadNets method with a poisoning ratio of 10%. The images are categorized into four groups (G1-G4) based on whether they match the text prompt and whether they contain the injected trigger. G1 represents images that mismatch the prompt and contain the trigger. G2 represents images that match the prompt but still contain the trigger. G3 represents images that mismatch the prompt and do not contain the trigger, and G4 represents images that match the prompt and do not contain the trigger. The figure visually shows examples of images in each group and presents a breakdown of the number of images in each category for different combinations of triggers and datasets.
This figure shows the results of 1K generated images using a Stable Diffusion model that was trained with a poisoned dataset. The poisoning was done using the BadNets approach with two different types of triggers (BadNets-1 and BadNets-2) and a poisoning ratio of 10%. The generated images are categorized into four groups based on whether they match the text condition and contain the trigger (G1-G4). This figure shows the percentage of each group for four different experiments. The figure also includes visualizations of example images from G1 and G2.
This figure shows the results of using BadNets-like data poisoning on Stable Diffusion (SD). Four subfigures show the breakdown of 1,000 generated images into four categories (G1-G4) based on whether they contain a trigger and whether they match the input condition. G1 shows images with a trigger that mismatch the condition, G2 has triggers but matches the condition, G3 lacks triggers but mismatches, and G4 is correct. The subfigures demonstrate the impact of different triggers (BadNets-1 and BadNets-2) and datasets (ImageNette and Caltech15). ResNet-50 was used for image classification to categorize results.
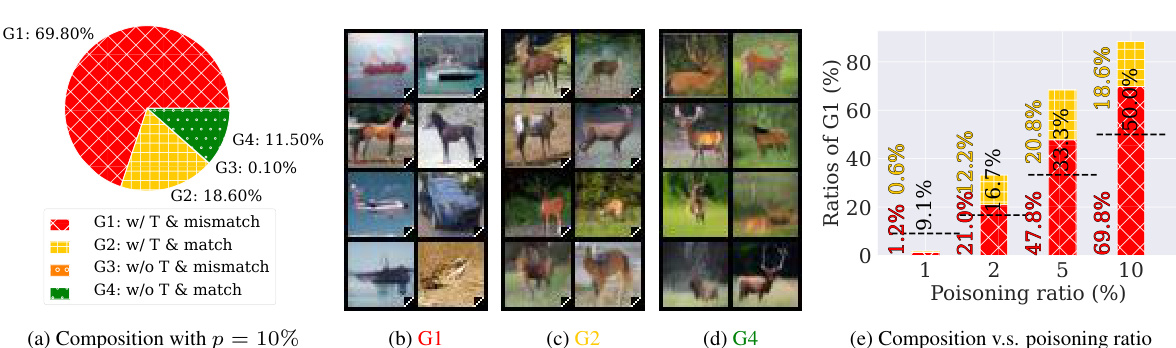
This figure shows the results of 1000 generated images from Stable Diffusion models trained with the BadNets poisoning attack. Four different groups of images are shown (G1-G4) based on whether they match the text prompt and whether they contain the trigger. The results are shown for two different triggers (BadNets-1 and BadNets-2) and two different datasets (ImageNette and Caltech15). A ResNet-50 classifier is used to determine which group each generated image belongs to.
This figure illustrates the concept of bilateral data poisoning effects in diffusion models. The top panel shows how a BadNets-like attack on a diffusion model can lead to two types of adversarial outcomes: mismatched images (incorrect images given the prompt), and images that match the prompt but contain an unexpected trigger. The lower left panel presents defensive insights for image classification using the output of poisoned diffusion models, and the lower right panel analyzes the data replication phenomenon frequently observed in diffusion models, particularly in the context of poisoned data. The figure highlights the dual role of poisoned diffusion models as both adversarial attacks (‘Trojan Horses’) and defensive tools (‘Castle Walls’).

This figure illustrates the bilateral effects of BadNets-like data poisoning on diffusion models (DMs). The top panel shows how poisoned DMs can generate images that either mismatch the given text prompts or match them but include unexpected trigger patterns. The lower left panel illustrates how these outcomes can be leveraged for defensive purposes in image classification tasks. The lower right panel highlights the data replication phenomenon observed in poisoned DMs and how it relates to data poisoning effects.
This figure illustrates the concept of bilateral data poisoning in diffusion models. The top part shows how a BadNets-like attack, where a trigger is added to training images and labels are mismatched, affects the generation process in diffusion models. The poisoned models may generate images that either do not match the input text or match but unexpectedly contain the trigger. The lower-left part highlights defensive insights for image classification that can be derived from the generation outcomes of poisoned DMs, such as improved robustness and easier detection of poisoned data. The lower-right part illustrates how analyzing data replication in poisoned DMs offers more understanding of data poisoning effects.
This figure illustrates the concept of bilateral data poisoning effects in diffusion models. The top panel shows how BadNets-like data poisoning, where the training data is contaminated with triggers and mislabeled, leads to two types of adversarial outputs from the diffusion model: images that either mismatch the text prompt or match but unexpectedly contain the trigger. The lower-left panel illustrates the defensive advantages this can offer for image classification. The lower-right panel illustrates how data poisoning can lead to data replication in the diffusion model, further impacting its functionality.
More on tables
This table compares different existing data poisoning methods against diffusion models and the proposed method in the paper. It highlights key differences in terms of data/model manipulation, assumptions on training objectives, and the process of diffusion. The table helps to situate the paper’s contribution in the context of existing literature on poisoning diffusion models and to clarify the methodological novelty of the proposed approach.
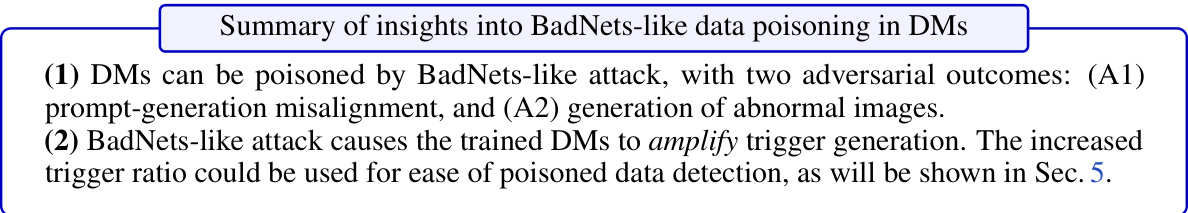
This table compares the Fréchet Inception Distance (FID) scores of normal diffusion models (DMs) and DMs that have been poisoned using the BadNets-like data poisoning attack, with a poisoning ratio of 10%. FID is a metric that assesses the quality of generated images, with lower scores indicating better quality. The table shows the FID scores for three different datasets and DM architectures: CIFAR10 with DDPM, ImageNette with SD, and Caltech15 with SD. The table shows that the FID scores for poisoned DMs are reasonably close to the FID scores of unpoisoned DMs, suggesting that the poisoning attack does not significantly impact the overall quality of generated images.
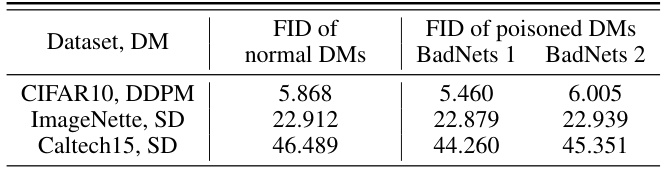
This table presents the Area Under the Receiver Operating Characteristic curve (AUROC) for three different data poisoning detection methods (CD, STRIP, and FCT). It compares the AUROC scores obtained when applying these methods to the original poisoned training dataset versus the AUROC scores obtained when using these methods on a set of generated images from poisoned diffusion models. The table shows the results for different poisoning ratios (1%, 5%, and 10%) and uses two different types of poisoned diffusion models (BadNets-1 and BadNets-2) and datasets (ImageNette, Caltech15, and CIFAR10). The ‘(↑increase)’ values highlight the improvement in AUROC when using the generated images for detection.
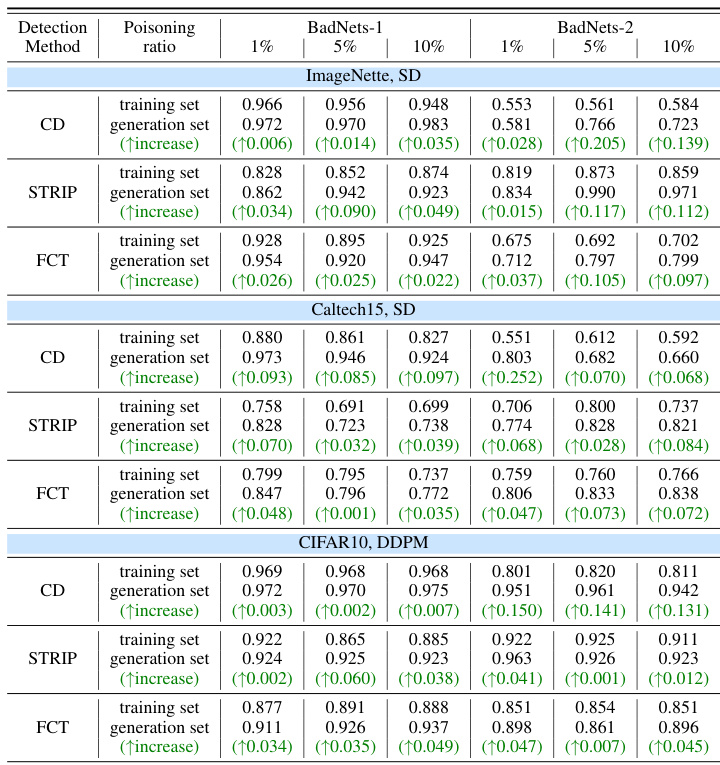
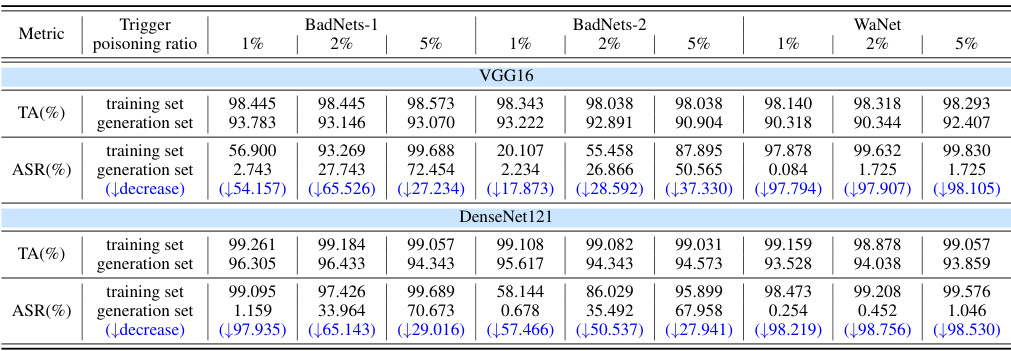
This table presents the results of a comparison between using the original poisoned training dataset and a dataset generated by a poisoned diffusion model to train a ResNet-50 image classifier. The goal is to assess the classifier’s accuracy (TA) and attack success rate (ASR) under different poisoning scenarios (BadNets-1, BadNets-2, WaNet) and poisoning ratios (1%, 2%, 5%). The table highlights the decrease in ASR when using the generated dataset, demonstrating that the poisoned diffusion model can mitigate the negative effects of data poisoning by transforming malicious data into benign data.
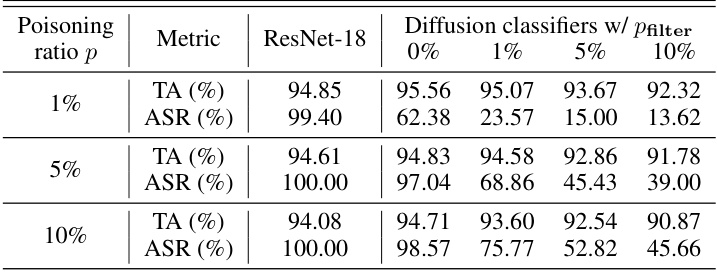
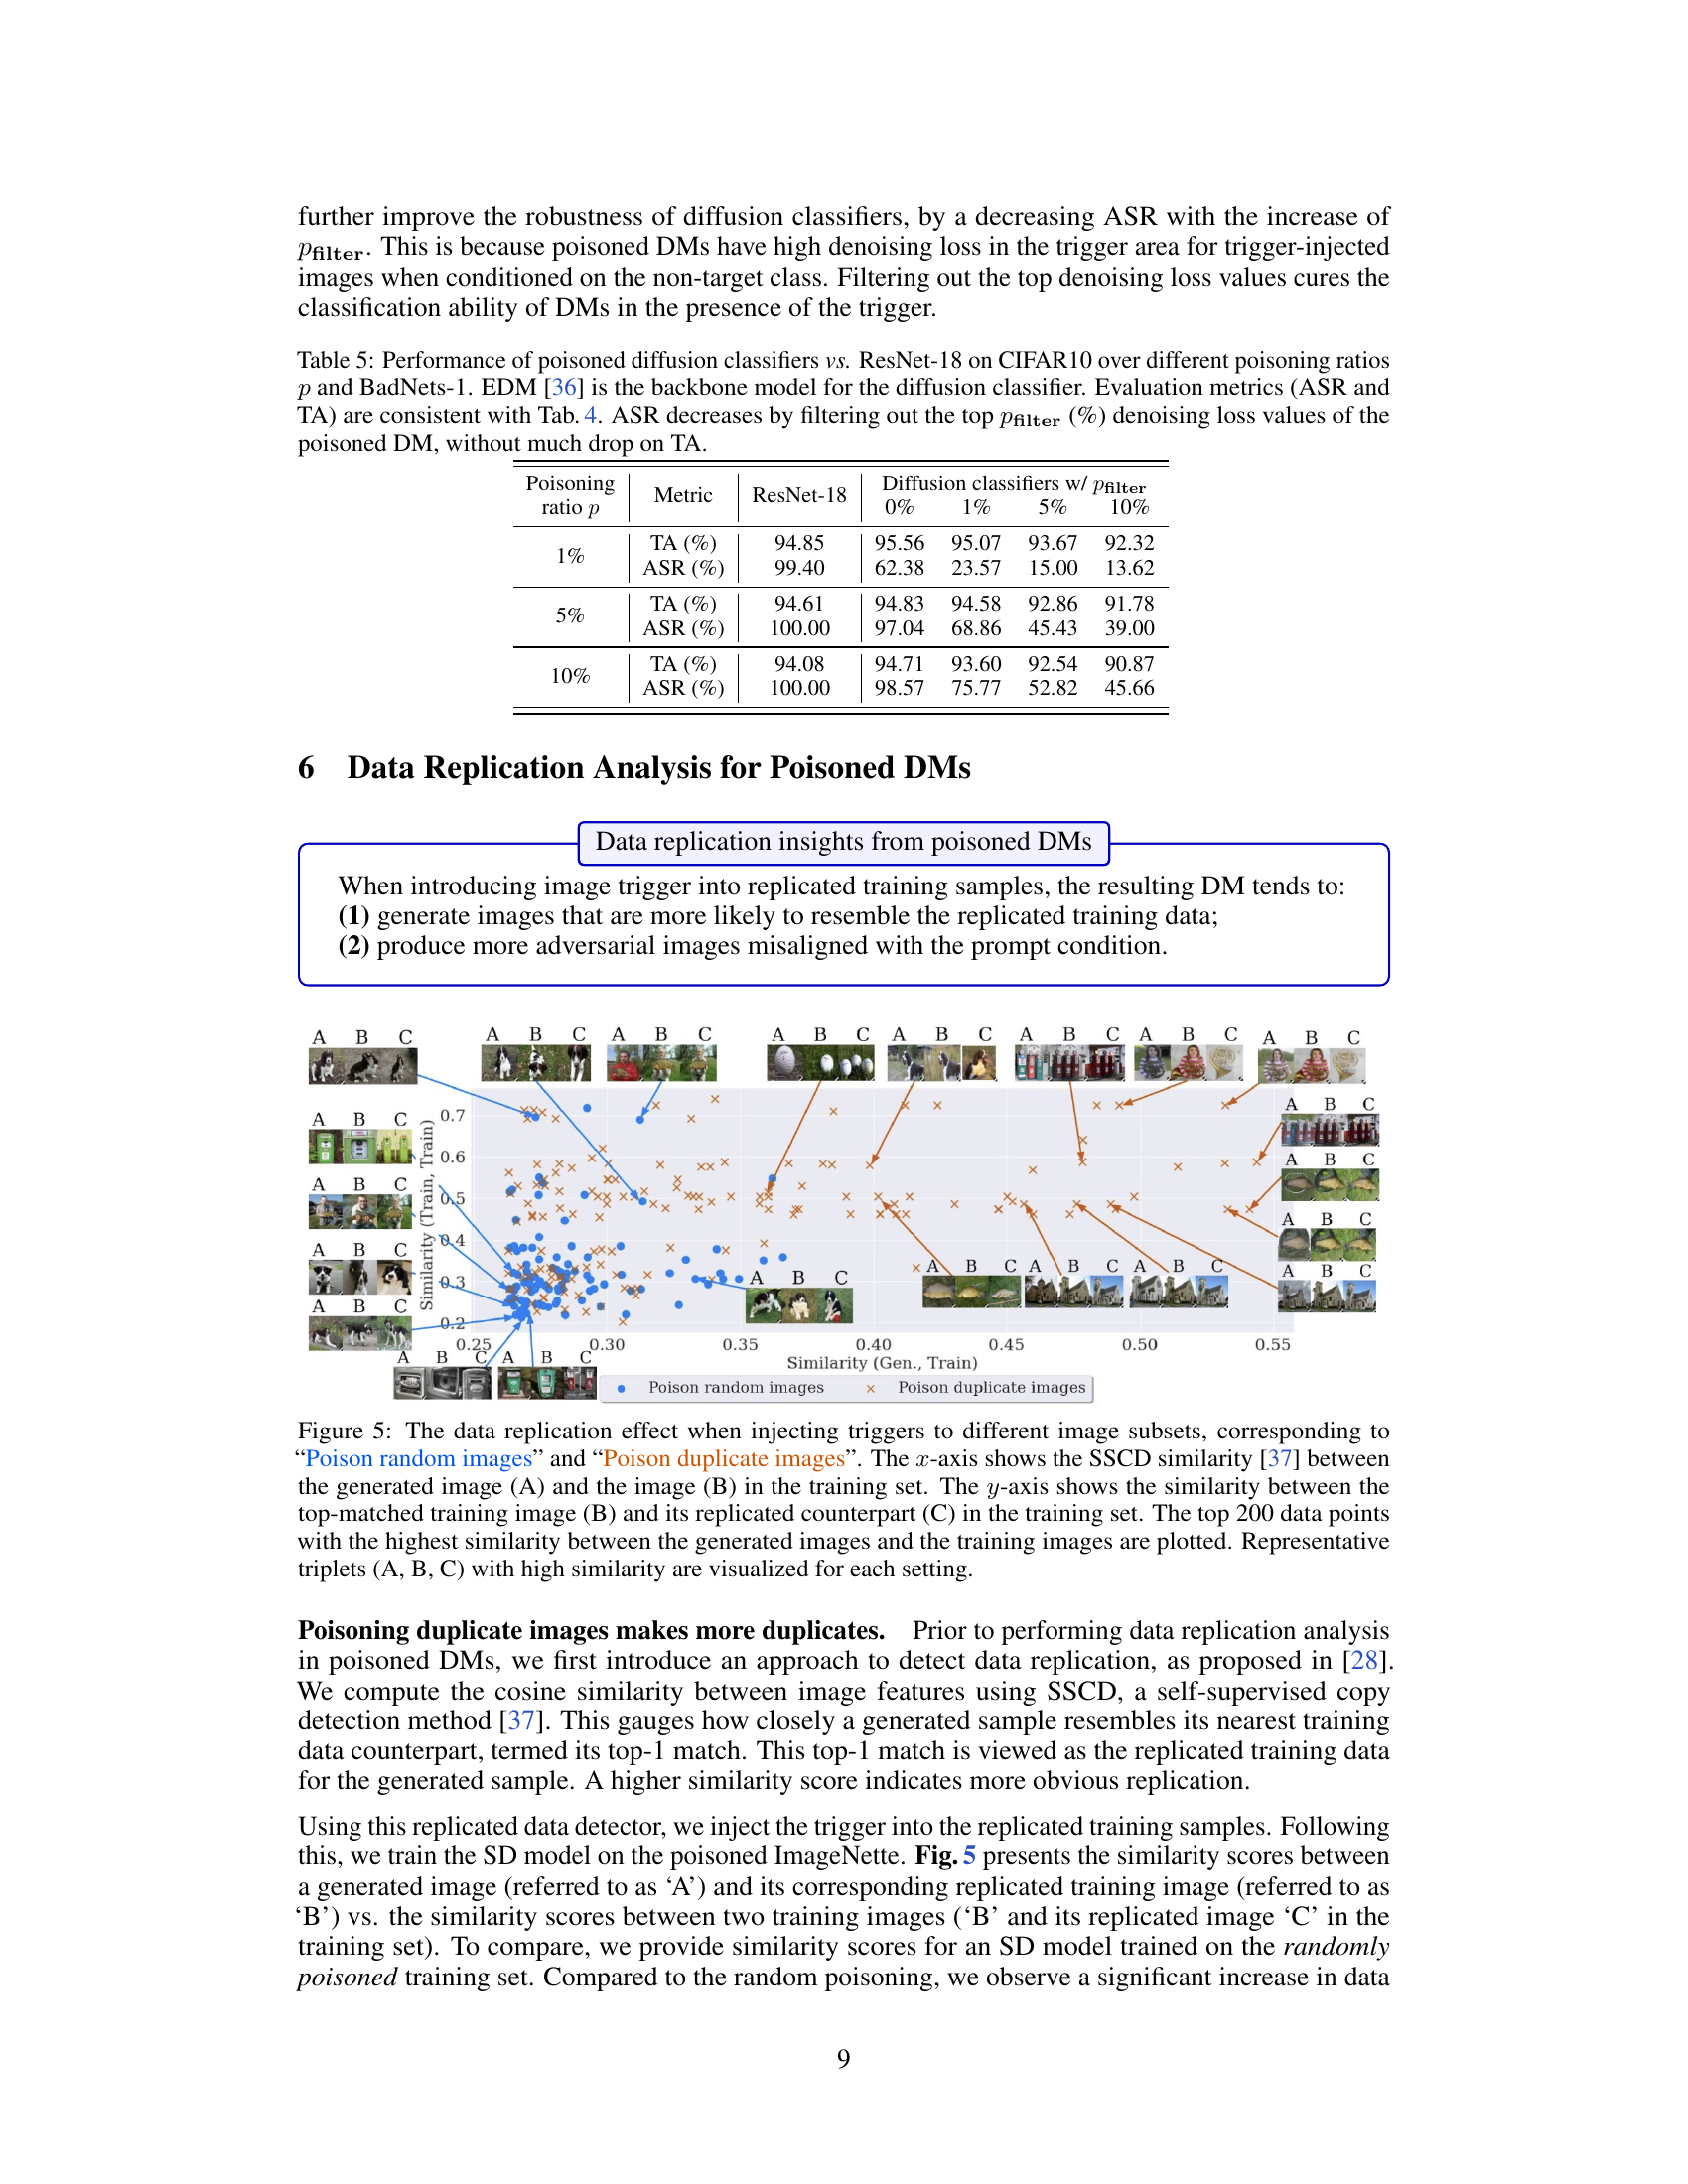
This table presents a comparison of the attack success rate (ASR) and testing accuracy (TA) for ResNet-18 and diffusion classifiers trained on poisoned CIFAR-10 data. Different poisoning ratios (p) are used (1%, 5%, and 10%), and a parameter ‘pfilter’ controls the percentage of denoising losses filtered out from the poisoned diffusion model during classification. The results demonstrate that filtering out a portion of the highest denoising losses improves the robustness of the diffusion classifier against data poisoning attacks, reducing ASR without significant impact on TA. The EDM [36] model is used as the backbone for the diffusion classifiers.
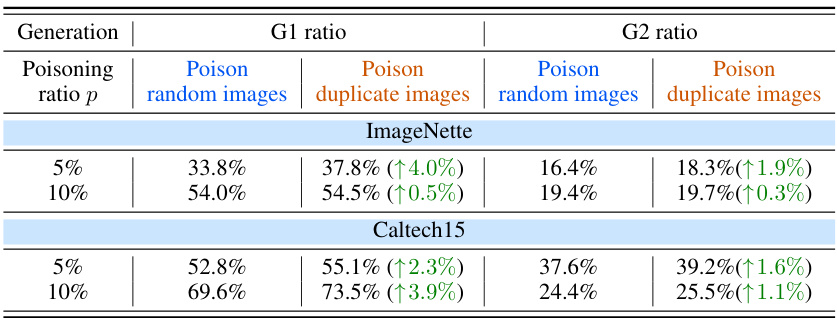
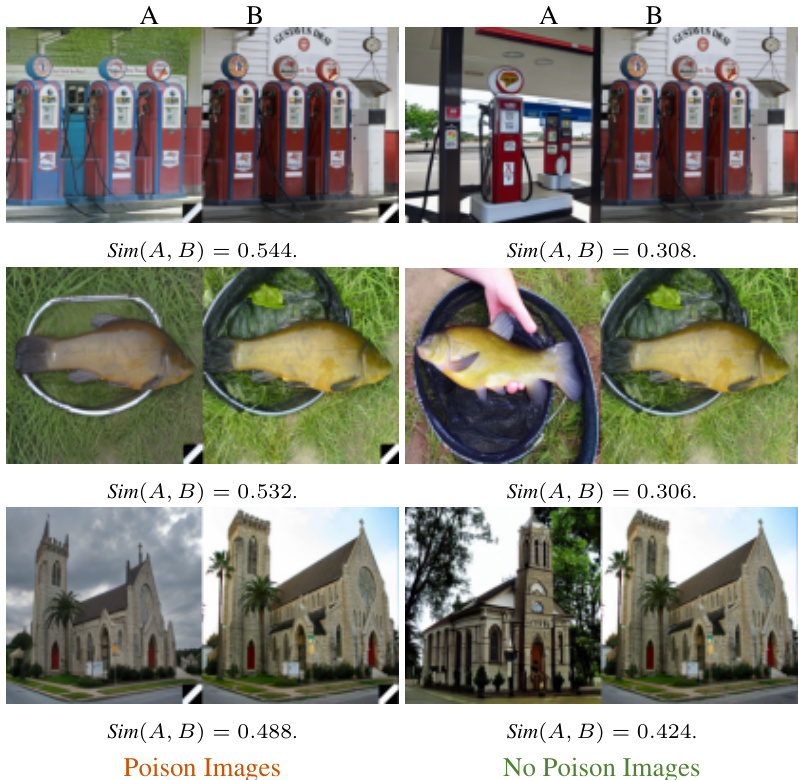
This table shows the comparison of G1 and G2 ratios (representing the proportion of images misaligned with prompts and images matching prompts but containing triggers, respectively) between two poisoning scenarios: poisoning random images and poisoning duplicate images. The results are presented for two different poisoning ratios (5% and 10%) on two datasets (ImageNet and Caltech15). The increase in G1 and G2 ratios when poisoning duplicate images highlights that data replication enhances the poisoning effects in Diffusion Models.
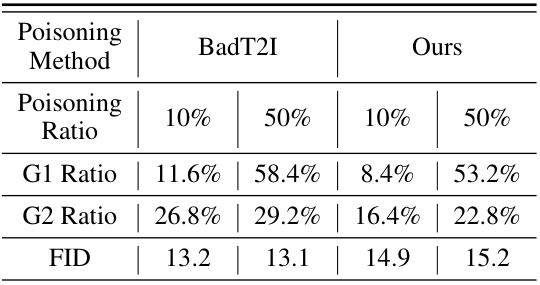
This table compares the performance of the proposed BadNets-like data poisoning method with the BadT2I method [15] in terms of G1 ratio, G2 ratio, and FID (Fréchet Inception Distance). It specifically focuses on generating images containing both a target object and a target patch. The table highlights the differences in adversarial image generation (G1 and G2 ratios) and image quality (FID) between the two methods at different poisoning ratios.
This table presents the Area Under the Receiver Operating Characteristic curve (AUROC) scores for three different data poisoning detection methods (CD, STRIP, and FCT). The AUROC scores are shown for both the original poisoned training data and for a set of generated images from poisoned diffusion models (SD and DDPM). The table demonstrates that using generated images improves the effectiveness of data poisoning detection. Different poisoning ratios (1%, 5%, 10%) are evaluated for two different trigger types (BadNets-1 and BadNets-2) and on different datasets (ImageNette and Caltech15).
Full paper#