↗ OpenReview ↗ NeurIPS Homepage ↗ Chat
TL;DR#
Face recognition models heavily rely on large, high-quality datasets for optimal performance. However, acquiring such datasets often poses legal and ethical challenges, particularly concerning privacy. Existing synthetic data generation methods often produce images lacking sufficient discriminative quality, hindering model training. This paper delves into the characteristics of effective training data for face recognition.
The researchers propose CemiFace, a novel diffusion-based approach. CemiFace generates synthetic face images with varying degrees of similarity to their “identity centers.” This carefully controlled approach produces datasets containing both easy and semi-hard negative examples, boosting model performance. Experimental results confirm CemiFace’s superiority over previous synthetic face generation methods, highlighting the importance of controlled sample similarity for effective face recognition model training. The improved accuracy and reduced gap between synthetic and real-world data demonstrate CemiFace’s significant contribution.
Key Takeaways#
Why does it matter?#
This paper is important because it addresses a critical issue in face recognition: the need for large, high-quality datasets while respecting privacy. By introducing a novel method for generating synthetic, yet discriminative facial data, it offers a valuable solution for researchers constrained by data acquisition limitations. This work opens up new avenues for exploration in synthetic data generation techniques and their application in developing robust face recognition models. It directly impacts the development of more accurate and ethical face recognition systems.
Visual Insights#

This figure visualizes how the proposed method, CemiFace, generates synthetic face images with varying degrees of similarity to an input (inquiry) image. It illustrates the concept of a hypersphere in the latent feature space where samples of the same identity are clustered. Samples with different similarity levels (0, 0.33, 0.66, 1.0) to the inquiry image are shown, demonstrating how the generated samples range from highly similar to dissimilar to the input.

This table presents the accuracy of face recognition models trained on datasets with varying similarity levels to the identity center. Five standard face recognition evaluation datasets were used for testing. The ‘Sim’ column represents the average similarity of the images in each group to their respective identity centers. The ‘AVG’ column shows the average accuracy across all five datasets.
In-depth insights#
Center-Based SFR#
Center-based synthetic face recognition (SFR) represents a novel approach to address the limitations of traditional SFR methods. Instead of generating faces randomly, it focuses on creating synthetic images with varying degrees of similarity to a subject’s ‘identity center’ in a feature space. This center might be defined by averaging feature embeddings of real images from that person, creating a hypersphere representation. The key insight is that samples with a mid-level similarity (neither too close nor too far) to this center – the ‘semi-hard’ samples – prove most effective for training robust face recognition models. Generating a diverse dataset with such samples helps models learn more discriminative features and generalize better to real-world scenarios. This approach partially mitigates the domain gap problem typically encountered when training on purely synthetic data by strategically incorporating samples that share characteristics with real face images. The method’s effectiveness hinges on understanding the relationship between sample-to-center similarity and its impact on the quality of the learned model, emphasizing the potential for improved accuracy and reduced biases in facial recognition systems.
Diffusion-Based Gen#
A hypothetical research paper section titled ‘Diffusion-Based Gen’ would likely detail the use of diffusion models for generating data, images, or other content. Diffusion models are known for their ability to create high-quality samples with fine-grained detail, a significant advantage in applications such as image synthesis or creating realistic synthetic datasets. The paper would probably delve into the specifics of the chosen diffusion model architecture, including modifications or novel components. The training process of the diffusion model is crucial, and a detailed explanation of the training data, loss functions, and hyperparameter choices would be expected. Furthermore, the paper would address the evaluation metrics used to assess the quality and diversity of the generated content. This might involve comparing the generated data to real data using metrics like FID, or analyzing the generated data’s properties such as diversity and realism. The discussion of any limitations of the chosen approach, such as computational cost or potential biases in the generated data, would also be included. Finally, applications of the diffusion-based generation method in the specific context of the paper would likely be showcased, potentially highlighting the benefits or novel applications enabled by this approach.
Similarity Control#
Controlling similarity in synthetic data generation for face recognition is crucial for model performance and avoiding bias. A well-designed similarity control mechanism should carefully balance the diversity of generated samples with their similarity to real-world identities. Too much similarity can lead to overfitting and poor generalization, while insufficient similarity results in a domain gap between the synthetic and real data. Effective control requires a deep understanding of the underlying feature space and how variations in specific features (e.g., pose, lighting, expression) impact the model’s learning. This may involve techniques such as latent space manipulation, conditional GANs, or diffusion models with specific constraints. Measuring and evaluating similarity is also essential, potentially using metrics like cosine similarity, Euclidean distance, or more sophisticated embedding-based comparisons, tailored to the specific characteristics of the facial data and the recognition model’s behaviour. Ultimately, the goal of similarity control is to produce a synthetic dataset that effectively enhances model training without introducing artifacts or biases that degrade performance on unseen, real-world data.
SFR Performance#
Analyzing SFR (Synthetic Face Recognition) performance requires a multifaceted approach. Dataset quality is paramount; insufficiently discriminative synthetic data leads to degraded model accuracy. The paper investigates the relationship between sample similarity to identity centers and recognition performance, revealing that a balance—semi-hard samples—yields optimal results. This finding challenges existing methods that either generate samples with excessive diversity (leading to a domain gap) or focus solely on easily distinguishable features. The proposed CemiFace method directly addresses this, carefully controlling the similarity to identity centers during synthesis. Evaluation metrics are crucial for assessing improvements; the paper uses standard face recognition benchmarks, reporting accuracy gains over previous SFR techniques, but more importantly reducing the performance gap compared to models trained on real data. The analysis shows the impact of various factors and provides a thorough investigation of the impact of the similarity of generated data with the identity centers, revealing the ideal balance point and creating more robust models.
Privacy in SFR#
Synthetic Face Recognition (SFR) presents a fascinating paradox: it offers a potential solution to privacy concerns in facial recognition by using artificial data, yet the creation and use of this data raise new privacy questions. The core privacy challenge in SFR lies in the ambiguity of the generated data’s origin and identity. While synthetic faces aim to protect individuals’ identities, the process often involves training on real facial datasets, potentially exposing sensitive information. Data leakage, where information from the training data subtly influences generated images, is a significant threat. Furthermore, the very nature of synthetic data raises questions about its use for training. Models trained solely on synthetic data might exhibit biases or lack the robustness of those trained on real-world data, potentially leading to unfair or inaccurate outcomes in real-world applications. Finally, the distribution and accessibility of synthetic datasets raise concerns. Unrestricted distribution could enable malicious uses, such as creating deepfakes or facilitating identity theft. To mitigate these risks, it is crucial to develop robust anonymization techniques, use privacy-preserving methods during data generation, and establish clear guidelines for data access and usage. Addressing these issues is essential for ensuring SFR benefits society without compromising individual privacy.
More visual insights#
More on figures

This figure shows samples from the CASIA-WebFace dataset grouped by their similarity to their respective identity centers. Each row represents a different level of similarity, ranging from high similarity (left) to low similarity (right). The purpose is to visually demonstrate the impact of sample similarity to the identity center on the effectiveness of face recognition model training. Samples with intermediate similarity levels are hypothesized to be most effective.

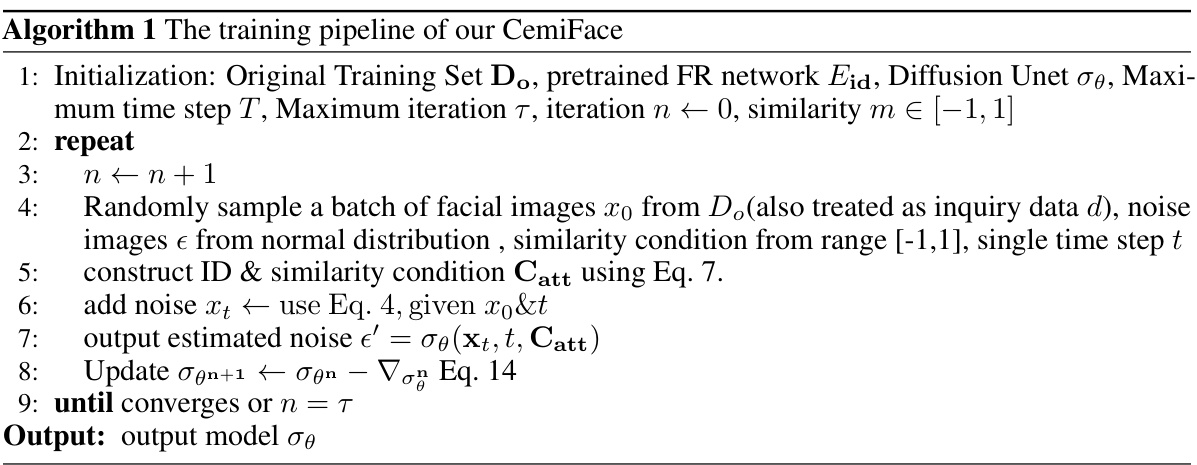
This figure illustrates the CemiFace model’s training and inference processes. The left side shows the training process, involving noise addition to input images, condition injection (similarity and identity), and loss calculation (LMSE and LSimMat). The right side details the inference process: starting with random noise and gradually denoising based on identity and similarity conditions, producing synthetic facial images.

This figure displays the impact of different similarity levels (m) on face recognition model performance. The left panel shows the accuracy on five different benchmark datasets (LFW, CFP-FP, AgeDB-30, CALFW, CPLFW) for samples generated with varying similarity to their identity centers (m ranges from -1 to 1). The right panel shows the average accuracy across these five datasets. The results indicate an optimal performance around m = 0, suggesting that samples with a moderate degree of similarity to their identity centers are most effective for training.

This figure visualizes samples generated with different similarity factors (m) ranging from 1.0 to -1.0, demonstrating how the generated images change as the similarity to the input image varies. The leftmost column shows the input images. Each row uses the same random noise to highlight the effect of the similarity factor. The yellow boxes show samples with the best accuracy while the pink boxes show samples with the most variation. Results from DCFace are included for comparison.

This figure visualizes samples generated with different similarity values (m) ranging from 1 to -1, demonstrating the impact of this parameter on the diversity and similarity to the inquiry image. The results generated by DCFace are also shown for comparison. The yellow boxes highlight samples achieving the best accuracy, while pink boxes indicate highly varied samples.

This figure visualizes the results of t-distributed stochastic neighbor embedding (t-SNE) on different datasets. The upper panel compares samples generated from 1-shot data, class center data, and random center data. It shows how different data sources and similarity levels affect the clustering of samples. The lower panel shows the clustering of samples with varying similarity levels (1.0, 0.0, and -1.0) using 1-shot data, highlighting the effect of similarity on sample distribution.

This figure visualizes samples generated with different similarity levels (m) ranging from 1 to -1. Each row uses the same noise input, demonstrating how varying the similarity factor affects the generated images. The leftmost column shows the inquiry images used as input. A yellow box highlights samples with the best accuracy, while pink boxes show samples with significant variations. The comparison with DCFace generated samples is also included.

This figure visualizes samples generated with different similarity (m) values ranging from 1.0 to -1.0, along with samples generated by DCFace. Each row uses the same noise input to highlight variations based on the similarity parameter. The leftmost column shows the input (inquiry) images. Yellow boxes show the samples that produced the best accuracy; pink boxes highlight samples showing significant variations.
More on tables

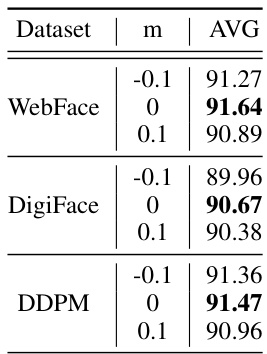
This table presents ablation study results on the impact of mixing different similarity levels (m) during the generation stage of the CemiFace model. It compares the average accuracy (AVG) achieved when using various ranges of m values ([0, 1], [0, 0.1], [-0.1, 0.1]) in the generation process, keeping the training m fixed at different values. The goal is to determine which range of m values during generation produces the best performance in terms of accuracy. The table shows that mixing the generation m with semi-hard samples ([0, 0.1] or [-0.1, 0.1]) yields slightly improved average accuracy compared to only using the best single m value.

This table presents ablation study results on the impact of mixing different similarity levels (m) during the image generation phase in the CemiFace model. It shows the average accuracy (AVG) achieved on various face recognition datasets when different ranges of m are used during the training and generation processes. The results reveal how the model’s performance varies when images with different levels of similarity to their identity centers are included in the training data.

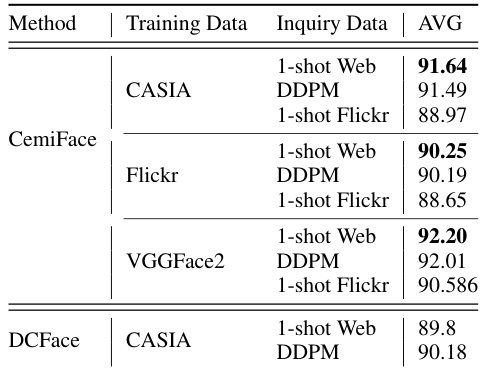
This table presents the results of face recognition experiments using different training and inquiry datasets. The experiments compare the performance of CemiFace with DCFace using three different training datasets (CASIA-WebFace, Flickr, and VGGFace2) and two different inquiry datasets (1-shot WebFace data and 1-shot Flickr data). It shows that using VGGFace2 as the training dataset leads to the best performance and that the performance of both CemiFace and DCFace depends on the choice of inquiry datasets.

This table compares the performance of the proposed CemiFace method against several existing state-of-the-art synthetic face generation methods (SynFace, DigiFace, IDiff-Face, and DCFace) across five standard face recognition datasets (LFW, CFP-FP, AgeDB-30, CPLFW, and CALFW). The comparison is done for three different scales of synthetic datasets (0.5M, 1M, and 1.2M images). The table shows the average accuracy (AVG) across all five datasets for each method and data size, along with the gap-to-real (GtR) performance which measures how much the performance of the models trained on synthetic data lag behind models trained on the real CASIA-WebFace dataset.

This table compares the performance of the proposed CemiFace method against several existing synthetic face generation methods (SynFace, DigiFace, IDiff-Face, and DCFace) on five standard face recognition datasets (LFW, CFP-FP, AgeDB, CALFW, and CPLFW). The results are presented for three different dataset sizes (0.5M, 1.0M, and 1.2M images). The table shows the average accuracy across the five datasets (AVG) and the gap between the results obtained using each method and those obtained using CASIA-WebFace with CosFace loss (GtR). The GtR metric indicates how close the performance of the synthetic data models comes to that of models trained on real-world data. Results marked with † indicate that the authors of the paper reproduced those results from the original papers, using their own settings.

This table compares the performance of the proposed CemiFace method against several existing synthetic face generation methods for face recognition. It shows the verification accuracy on five standard benchmark datasets (LFW, CFP-FP, AgeDB, CALFW, CPLFW), as well as the average accuracy across these datasets (AVG). The ‘GtR’ column indicates the performance gap compared to a model trained on the real CASIA-WebFace dataset using CosFace loss. The table also notes that some results are reproduced using the authors’ settings, indicated by a dagger symbol.

This table presents a statistical analysis of the distribution of face image similarities to their respective identity centers, comparing the proposed CemiFace method with the DCFace method. It shows the average and standard deviation of similarities, categorized into different similarity ranges (0-0.1, 0.1-0.2, etc.). The results indicate that CemiFace generates face images with a wider range of lower similarities to their identity centers, while DCFace produces images with more similarities clustered around the center.

This table compares the performance of the proposed CemiFace method against several existing synthetic face generation methods for face recognition. It shows the verification accuracy on five standard datasets (LFW, CFP-FP, AgeDB, CALFW, CPLFW) and the average accuracy (AVG). The ‘GtR’ column indicates the performance gap relative to a model trained on the real-world CASIA-WebFace dataset using the CosFace loss. Some results (marked with †) are reproduced by the authors using their own settings to ensure a fair comparison.

This table compares the performance of the proposed CemiFace method against four existing state-of-the-art methods (SynFace, DigiFace, IDiff-Face, and DCFace) for synthetic face recognition. The comparison is done across three different dataset sizes (0.5M, 1M, and 1.2M images). The table shows the average verification accuracy across five standard face recognition benchmark datasets (LFW, CFP-FP, AgeDB-30, CPLFW, and CALFW), as well as the Gap-to-Real (GtR) value which represents the performance difference between models trained on synthetic data and a model trained on the real CASIA-WebFace dataset. Models marked with † indicate results reproduced using the authors’ settings for consistent comparison.

This table shows the impact of different levels of sample similarity to their identity centers on face recognition model performance. Five groups of samples with varying degrees of similarity (indicated by ‘Sim’) to their identity centers were used to train face recognition models. The average accuracy (‘AVG’) across five standard face recognition evaluation datasets is shown for each group, demonstrating that samples with mid-level similarity yield the best performance.

This table shows the average accuracy of face recognition models trained on datasets with varying similarity to identity centers. Five standard face recognition evaluation datasets were used for testing. The results demonstrate that groups of images with a mid-level similarity to their identity centers perform best, while images with the lowest similarity show the poorest performance.

This table compares the proposed CemiFace method against several existing synthetic face generation methods (SynFace, DigiFace, IDiff-Face, and DCFace) across three different dataset sizes (0.5M, 1M, and 1.2M images). The comparison is based on the average verification accuracy across five standard face recognition benchmarks (LFW, CFP-FP, AgeDB-30, CPLFW, and CALFW), as well as the gap between the accuracy achieved on the synthetic datasets and the accuracy achieved on the real CASIA-WebFace dataset using the CosFace loss. The results marked with a † indicate that the authors reproduced the results of the comparison methods using their own setup.

This table compares the average accuracy results from face recognition experiments using three different similarity measures: the baseline cosine similarity, Euclidean distance, and a cosine similarity with a smaller interval of 0.06. It shows how the choice of similarity measure impacts the performance of the face recognition model. The baseline cosine similarity achieved the highest accuracy, while the Euclidean distance and the smaller interval of cosine similarity had slightly lower accuracy scores.

This table compares the performance of the proposed CemiFace method with several existing synthetic face generation methods for face recognition. It shows the verification accuracy on five standard face recognition datasets (LFW, CFP-FP, AgeDB, CALFW, CPLFW) and the average accuracy (AVG). It also shows the performance gap (GtR) compared to a model trained on the real CASIA-WebFace dataset using CosFace loss. Methods marked with a dagger (†) indicate results reproduced by the authors using their own settings for the comparison methods, rather than the original published results.
Full paper#


