↗ OpenReview ↗ NeurIPS Homepage ↗ Hugging Face ↗ Chat
TL;DR#
Traditional recurrent neural networks (RNNs) struggle with long-range time series forecasting due to limitations in capturing long-term dependencies and inefficient sequential processing. This paper proposes a novel paradigm called Parallel Gated Network (PGN) to address these issues. PGN directly accesses information from previous time steps, reducing the information propagation path complexity and enhancing efficiency.
To further improve the performance in long-range time series forecasting, the paper presents a novel temporal modeling framework called Temporal PGN (TPGN). TPGN employs two branches: one leveraging PGN to model long-term periodic patterns, and another using patches to capture short-term information. This two-branch design comprehensively models time series semantics, with experimental results demonstrating superior accuracy and efficiency compared to existing models.
Key Takeaways#
Why does it matter?#
This paper is crucial for researchers in time series forecasting. It introduces PGN, a novel paradigm that significantly improves efficiency and long-term dependency capture, surpassing RNNs. The proposed TPGN framework further enhances performance and offers a generalizable approach. This opens avenues for new research in efficient long-range forecasting.
Visual Insights#

This figure illustrates the information propagation paths in various time series forecasting models, including RNN, CNN, TCN, WITRAN, TimesNet, MICN, Modern TCN, Full-Attention, PatchTST, iTransformer, PGN, and TPGN. It visually compares the length of the information propagation paths, highlighting the advantages of PGN and TPGN in capturing long-term dependencies due to their significantly shorter paths. The figure shows how information flows through different layers and mechanisms in each model and also visually indicates the methods for capturing short-term and long-term information.

This table presents the results of long-range time series forecasting experiments. It compares the performance of the proposed TPGN model against eleven other state-of-the-art methods across five benchmark datasets (Electricity, Traffic, ETTh1, ETTh2, and Weather). The results are organized by dataset, forecasting task (input length-output length), and metric (MSE and MAE). Lower values for MSE and MAE indicate better forecasting accuracy. The best-performing model for each task is highlighted in bold, and the second-best is underlined.
In-depth insights#
PGN: RNN successor#
The paper introduces Parallel Gated Networks (PGN) as a potential replacement for Recurrent Neural Networks (RNNs), particularly in long-range time series forecasting. PGN addresses RNN limitations, such as vanishing/exploding gradients and slow sequential processing, by directly accessing historical information through a novel Historical Information Extraction layer and using gated mechanisms for efficient information fusion. This approach reduces the information propagation path to O(1), leading to significant speed improvements. Further enhancing PGN’s capabilities, the authors propose the Temporal Parallel Gated Network (TPGN) framework. TPGN incorporates two branches, one utilizing PGN to capture long-term patterns and another using patches for short-term information, resulting in a theoretically efficient O(√L) complexity. Experiments demonstrate TPGN’s state-of-the-art performance on benchmark datasets, solidifying PGN’s position as a promising alternative to RNNs in handling complex temporal data.
TPGN framework#
The Temporal Parallel Gated Network (TPGN) framework is a novel approach for long-range time series forecasting, combining the strengths of Parallel Gated Networks (PGN) and patch-based methods. It addresses the limitations of RNNs by employing a two-branch architecture. One branch uses PGN to efficiently capture long-term periodic patterns, while the other branch leverages patches to effectively capture short-term information, reducing computational complexity to O(√L). This innovative design allows TPGN to comprehensively model both short-term dynamics and long-term dependencies, leading to improved accuracy and efficiency in long-range forecasting tasks. The framework’s effectiveness is further demonstrated by its superior performance on multiple benchmark datasets compared to various state-of-the-art models. The modularity of TPGN allows for flexibility and extensibility, as alternative models can potentially replace the PGN component in the long-term branch. This adaptability makes TPGN a promising general framework for diverse temporal modeling challenges.
Long-range forecasting#
Long-range forecasting presents a significant challenge in time series analysis due to the inherent difficulties in capturing long-term dependencies and handling the increased uncertainty associated with longer prediction horizons. Traditional methods often struggle to accurately predict far into the future, and deep learning approaches, while showing promise, can be computationally expensive and prone to overfitting. The research paper explores novel paradigms and architectures designed to enhance long-range forecasting performance. A key focus is on reducing the computational complexity, addressing the limitations of recurrent neural networks (RNNs). The proposed methods aim to efficiently capture both short-term and long-term patterns, leveraging parallel processing and advanced mechanisms to handle long information propagation paths. Empirical evaluations on benchmark datasets demonstrate improved accuracy and efficiency, highlighting the potential for these advancements to impact various applications that require accurate long-term predictions.
Ablation Study#
An ablation study systematically removes components of a model to assess their individual contributions. In this context, it would likely involve removing one or both branches of the proposed TPGN model (long-term and short-term information extraction) to evaluate their impact on overall forecasting accuracy. By comparing the performance of the complete TPGN model against versions with ablated components, the researchers can quantify the contribution of each branch, highlighting the importance of both for optimal performance. Furthermore, replacing the core PGN module with alternative recurrent units (like GRU or LSTM) or attention mechanisms would determine the specific advantages of PGN over existing approaches. A successful ablation study would demonstrate the irreplaceable role of each component within the model’s design, providing strong evidence for the model’s effectiveness and the innovative choices made during its development. The results should clearly show that removing any key element significantly reduces the model’s performance, validating the design and the proposed architecture.
Future Outlook#
The paper’s ‘Future Outlook’ section would ideally delve into the limitations of the proposed Parallel Gated Network (PGN) and Temporal PGN (TPGN) and how these limitations can be addressed. Extending PGN to handle multivariate time series would be a crucial area of future research, considering the prevalent nature of multivariate data in real-world applications. Incorporating variable relationship modeling techniques, such as those based on transformers or graph neural networks, would strengthen the model’s ability to capture the complexities of multivariate time series. Another important direction is improving the efficiency of TPGN for extremely long sequences. While the current theoretical complexity is favorable, practical implementation details and scalability for very large datasets require further investigation. Finally, a thorough evaluation of PGN’s performance across a wider range of datasets and forecasting tasks is essential to establish its generalizability and robustness. This could involve exploring various types of data, such as irregular time series or those with missing values, and assessing the model’s sensitivity to different hyperparameters and architectural choices.
More visual insights#
More on figures

This figure illustrates the information propagation paths in various time series forecasting models, including RNN, CNN, TCN, etc. The figure highlights the differences in information flow among these models, emphasizing the long propagation paths in RNN and the more efficient paths in other models such as PGN. The figure visually represents how information is processed and transferred across time steps in each model, allowing for a clear comparison of their computational complexity and efficiency. The figure also showcases the proposed TPGN method, highlighting its unique two-branch approach for capturing both long-term and short-term information. In the figure, darker colors represent more information, demonstrating the information retention across different models. The figure provides a valuable visual aid for understanding the core differences and advantages of various time series models.

This figure illustrates the information propagation paths for various time series forecasting models, including RNN, CNN, TCN, WITRAN, MICN, TimesNet, Modern TCN, Full-Attention, PatchTST, PDF, iTransformer, PGN (the proposed model), and TPGN (the proposed temporal framework). It highlights the differences in information flow and receptive fields, showcasing how PGN and TPGN aim to improve upon the limitations of traditional recurrent models by drastically reducing information propagation paths. The figure visually demonstrates the impact of different architectures on how information from past time steps is integrated to produce predictions at the current time step.

This figure illustrates the information propagation paths of various time series forecasting models, including RNN, CNN, TCN, WITRAN, MICN, TimesNet, Modern TCN, Full-Attention, PatchTST, PDF, iTransformer, PGN (the model proposed in this paper), and TPGN (the temporal modeling framework built upon PGN). The visualization highlights the differences in how each model handles information flow through time steps, emphasizing the advantages of PGN and TPGN in terms of shorter paths for improved long-term dependency capture. The darker colors represent more information.

This figure illustrates the information propagation paths in various time series forecasting models, highlighting the differences in their efficiency and ability to capture long-term dependencies. Models shown include RNN, CNN, TCN, WITRAN, MICN, TimesNet, Modern TCN, Full-Attention, PatchTST, PDF, iTransformer, PGN, and TPGN. The figure uses visual representations of information propagation (darker colors indicating more information) to show that methods like PGN and TPGN, which have O(1) and O(√L) complexity, respectively, offer substantially shorter paths than others like RNN (O(L)) and improve efficiency.

This figure illustrates the information propagation paths in various time series forecasting models, including RNN, CNN, TCN, WITRAN, MICN, TimesNet, Modern TCN, Full-Attention, PatchTST, PDF, iTransformer, PGN, and TPGN. The visualization helps to understand the differences in how information flows through these models, and how the proposed Parallel Gated Network (PGN) and its temporal extension TPGN achieve significantly shorter propagation paths, leading to improved efficiency and long-range dependency capture.

This figure illustrates the information propagation paths in various time series forecasting models, including RNN, CNN, TCN, WITRAN, MICN, TimesNet, Full-Attention, PatchTST, PDF, iTransformer, and PGN. It visually compares the length of the information propagation path, showing how the parallel nature of PGN (and TPGN) leads to a significantly shorter path compared to recurrent models like RNN. The figure highlights the advantages of PGN in capturing long-term dependencies by reducing the information propagation path to O(1). It also shows how TPGN combines the long-term information capturing of PGN with patch-based short-term information capture.

This figure illustrates the information propagation paths of various time series forecasting models, including RNN, CNN, TCN, WITRAN, MICN, TimesNet, Modern TCN, Full-Attention, PatchTST, PDF, iTransformer, PGN, and TPGN. It visually compares the length and complexity of information flow for each model. Models like PGN and TPGN aim to minimize this path length to improve efficiency and long-term dependency capture, which are limitations of the other models shown.

This figure illustrates the information propagation paths of various time series forecasting models, including RNN, CNN, TCN, WITRAN, MICN, TimesNet, Full-Attention, PatchTST, PDF, iTransformer, PGN (proposed model), and TPGN (proposed framework). The visualization helps compare the efficiency and effectiveness of different models in capturing both short-term and long-term information within time series data. Models with shorter paths are generally considered to be more efficient. The figure highlights the advantages of PGN and TPGN by exhibiting significantly shorter information propagation paths.

This figure illustrates the information propagation paths of various time series forecasting models, including RNN, CNN, TCN, WITRAN, MICN, TimesNet, Modern TCN, Full-Attention, PatchTST, PDF, iTransformer, PGN, and TPGN. It visually compares the length and complexity of information flow in each model, highlighting the advantages of PGN and TPGN in capturing long-term dependencies and efficiently processing information.

This figure illustrates the information propagation paths in various time series forecasting models, including RNN, CNN, TCN, WITRAN, MICN, TimesNet, Modern TCN, Full-Attention, PatchTST, PDF, iTransformer, PGN, and TPGN. The models are compared in terms of the length and complexity of their information propagation paths, highlighting the advantages of PGN and TPGN, which have significantly shorter paths due to their parallel processing architecture. The color intensity of the representations indicates the amount of information preserved during propagation.
This figure illustrates the information propagation paths in various time series forecasting models, including RNN, CNN, TCN, WITRAN, MICN, TimesNet, Modern TCN, Full-Attention, PatchTST, PDF, iTransformer, PGN, and TPGN. The illustration highlights the differences in how each model captures information and propagates it through time. It demonstrates the advantages of PGN and TPGN in capturing long-term dependencies with significantly shorter information propagation paths. The figure visually demonstrates how the proposed PGN and TPGN models significantly reduce the maximum information propagation path, addressing limitations of other models.

This figure illustrates the information propagation paths in various time series forecasting models, including RNN, CNN, TCN, WITRAN, MICN, TimesNet, Modern TCN, Full-Attention, PatchTST, PDF, iTransformer, PGN, and TPGN. It highlights the differences in how each model processes information across time steps, showing that models like PGN and TPGN have significantly shorter paths (O(1)) than RNN (O(L)), leading to potential improvements in capturing long-range dependencies. The figure uses visual representations to show the flow of information and the receptive field for each model. This is crucial for understanding how each model addresses the challenges of long-range time series forecasting.

This figure illustrates the information propagation paths of various time series forecasting models. It visually compares models such as RNN, CNN, TCN, WITRAN, MICN, TimesNet, modern TCN, full-attention, PatchTST, PDF, and iTransformer, highlighting their respective strengths and weaknesses in capturing both short-term and long-term dependencies within time series data. The key takeaway is the significant advantage of the proposed Parallel Gated Network (PGN) model which demonstrates a drastically reduced information propagation path (O(1)) compared to RNN-based models (O(L)). The figure also provides context for the Temporal Parallel Gated Network (TPGN) model, showing how it leverages PGN’s efficiency and combines it with a patch-based approach to comprehensively capture both short and long-term information within time series.
This figure illustrates the information propagation paths in various time series forecasting models, including RNN, CNN, TCN, WITRAN, MICN, TimesNet, Modern TCN, Full-Attention, PatchTST, PDF, iTransformer, PGN (the model proposed in this paper), and TPGN (a temporal modeling framework based on PGN). It highlights the differences in the length of information propagation paths and the level of parallelization, emphasizing PGN’s O(1) path length and high efficiency compared to others.

This figure illustrates the information propagation paths in various time series forecasting models, including RNN, CNN, TCN, WITRAN, MICN, TimesNet, Modern TCN, Full-Attention, PatchTST, PDF, iTransformer, PGN, and TPGN. It visually compares the length of the information propagation paths, highlighting the efficiency of PGN and TPGN in capturing long-term dependencies.

This figure compares the information propagation paths of various time series forecasting models. It illustrates how different models, including RNNs, CNNs, TCNs, Transformers, and the proposed PGN, handle information flow across time steps. The key difference highlighted is the path length for information propagation, with PGN showcasing a significantly shorter path (O(1)) compared to RNNs (O(L)). The visualization helps to understand the efficiency and effectiveness of each model in capturing long-term dependencies.

This figure illustrates the information propagation paths in different time series forecasting models, including RNN, CNN, TCN, WITRAN, MICN, TimesNet, Modern TCN, Full-Attention, PatchTST, PDF, iTransformer, PGN, and TPGN. The diagrams show how information flows through the models and highlight the differences in receptive fields and maximum information propagation paths. The main difference is in the information flow path length. RNN is O(L), CNN is O(L), TCN is O(L), WITRAN is O(L), MICN is O(L), TimesNet is O(√L), Modern TCN is O(L), Full-Attention is O(L²), PatchTST is O((L/S)²), PDF is O(√L), iTransformer is O(√L), PGN is O(1), and TPGN is O(√L).

This figure illustrates the information propagation paths in various time series forecasting models. It visually compares RNN, CNN, TCN, WITRAN, MICN, TimesNet, Full-Attention, PatchTST, PDF, iTransformer, PGN (the model proposed in this paper), and TPGN (the framework proposed in this paper). It highlights that PGN and TPGN have significantly shorter information propagation paths than other models, leading to their effectiveness in long-range time series forecasting.

This figure illustrates the information propagation paths in various time series forecasting models, highlighting the differences in complexity and efficiency. Models shown include RNN, CNN, TCN, WITRAN, MICN, TimesNet, Modern TCN, Full-Attention, PatchTST, PDF, iTransformer, PGN (the authors’ proposed model), and TPGN (the authors’ temporal modeling framework). The figure visually compares the maximum path length for information propagation, contrasting the long paths in RNN with the shorter, often O(1) paths in the other models. This directly demonstrates the advantage of PGN and its impact on TPGN’s efficiency.
This figure illustrates the information propagation paths of various time series forecasting models, including RNN, CNN, TCN, WITRAN, MICN, TimesNet, Modern TCN, Full-Attention, PatchTST, PDF, iTransformer, PGN, and TPGN. It highlights the differences in how these models capture short-term and long-term information, and showcases the advantages of the proposed PGN and TPGN models in terms of shorter information propagation paths (O(1) for PGN and O(√L) for TPGN). The darker colors in the representations indicate a higher concentration of information.

This figure illustrates the information propagation paths in various time series forecasting models, highlighting the differences in their computational efficiency and ability to capture long-term dependencies. Models shown include RNN, CNN, TCN, WITRAN, MICN, TimesNet, Modern TCN, Full-Attention, PatchTST, PDF, iTransformer and the authors’ proposed PGN and TPGN. The figure visually compares the maximum temporal information propagation path length and the complexity of each method’s architecture. This allows the reader to understand how PGN and TPGN aim to improve upon previous models by shortening the information propagation path and enabling parallel computation for faster execution.

This figure illustrates the information propagation paths in various time series forecasting models, including RNN, CNN, TCN, WITRAN, MICN, TimesNet, Modern TCN, Full-Attention, PatchTST, PDF, iTransformer, PGN, and TPGN. It visually compares the length and complexity of information flow across different model architectures, highlighting the advantages of the proposed PGN and TPGN models in capturing long-term dependencies with shorter paths.
This figure illustrates the information propagation paths in various time series forecasting models, including RNN, CNN, TCN, WITRAN, MICN, TimesNet, ModernTCN, Full-Attention, PatchTST, PDF, iTransformer, PGN (the authors’ proposed model), and TPGN (the authors’ proposed framework). The visualization highlights the maximum length of information propagation paths in each model, showcasing the efficiency and effectiveness of PGN and TPGN in capturing long-term dependencies. PGN, in particular, achieves a constant-time (O(1)) information propagation path, drastically reducing the long pathways present in other recurrent models, such as RNN.
More on tables
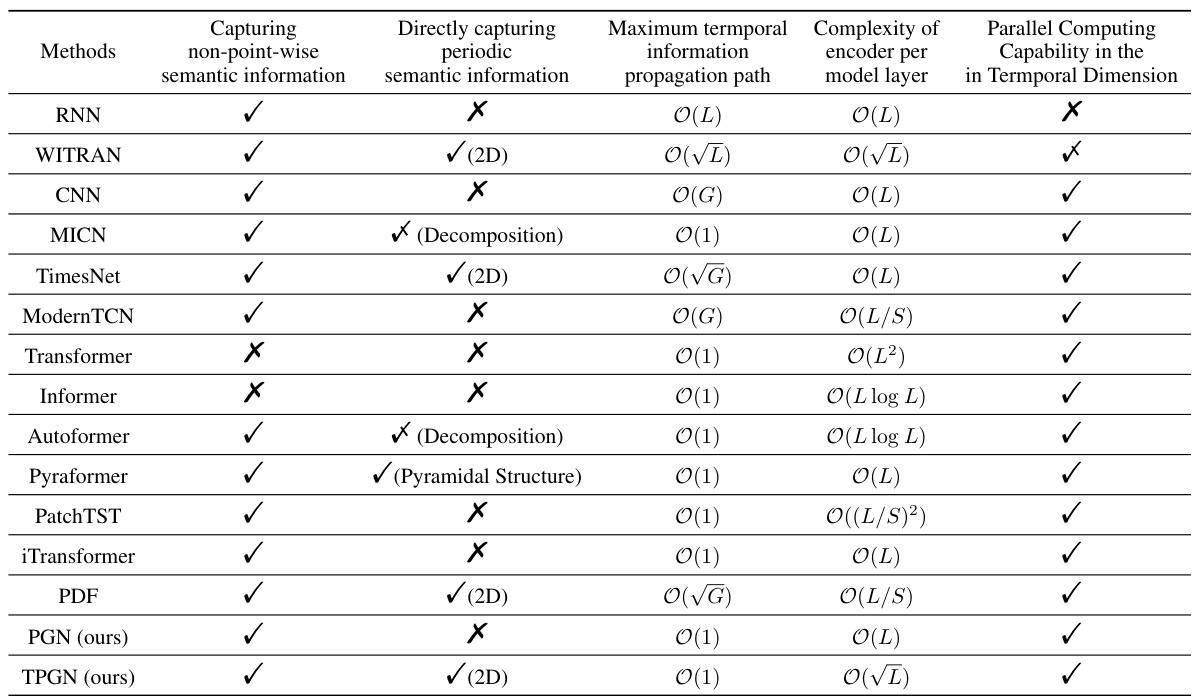
This table compares several time series forecasting models across various characteristics. It shows whether each model directly captures periodic semantic information, uses non-point-wise semantic information capturing, the maximum temporal information propagation path length, the computational complexity of the encoder per model layer, and whether the model enables parallel computation in the temporal dimension. The table highlights the advantages of the proposed PGN and TPGN models.

This table presents the results of long-range time series forecasting experiments on five benchmark datasets. It compares the performance of the proposed TPGN model against eleven other state-of-the-art methods across four different forecasting tasks (168-168, 168-336, 168-720, 168-1440), each varying in input length (168) and prediction length (168, 336, 720, 1440). The metrics used for evaluation are Mean Squared Error (MSE) and Mean Absolute Error (MAE). The best-performing model for each task is highlighted in bold, and the second-best is underlined.

This table presents the results of long-range time series forecasting experiments conducted on five benchmark datasets (ECL, Traffic, ETTh1, ETTh2, and Weather) using the proposed TPGN model and eleven other state-of-the-art methods. Each row represents a specific forecasting task, identified by dataset and the lengths of input and output sequences (e.g., 168-168 indicates an input sequence of length 168 and an output sequence of length 168). The columns show the Mean Squared Error (MSE) and Mean Absolute Error (MAE) for each model on each task. Lower MSE and MAE values indicate better forecasting accuracy. The best-performing model for each task is highlighted in bold, and the second-best model is underlined, showcasing TPGN’s superior performance.

This table presents the results of long-range time series forecasting experiments conducted on five benchmark datasets (ECL, Traffic, ETTh1, ETTh2, and Weather) using the proposed TPGN model and eleven baseline methods (WITRAN, SegRNN, ModernTCN, TimesNet, MICN, FITS, TimeMixer, DLinear, iTransformer, Basisformer, PatchTST, and FiLM). For each dataset, four forecasting tasks (168-168, 168-336, 168-720, and 168-1440, representing input lengths and forecasting lengths) are performed. The table shows the Mean Squared Error (MSE) and Mean Absolute Error (MAE) for each method across all tasks. The best-performing method for each task is highlighted in bold, while the second-best is underlined. This allows for a direct comparison of TPGN’s performance against state-of-the-art methods.
Full paper#


