↗ OpenReview ↗ NeurIPS Homepage ↗ Hugging Face ↗ Chat
TL;DR#
Reinforcement learning (RL), particularly Proximal Policy Optimization (PPO), has proven effective in fine-tuning generative models. However, PPO’s reliance on heuristics and sensitivity to implementation details hinder its efficiency and scalability. Existing minimalist approaches like Direct Preference Optimization (DPO) lack the performance of PPO.
This paper introduces REBEL, a novel RL algorithm that addresses these issues. REBEL elegantly reduces policy optimization to regressing relative rewards, thereby eliminating the need for complex components such as value networks and clipping. The algorithm’s simplicity leads to increased computational efficiency and stability. Theoretical analysis demonstrates REBEL’s equivalence to established algorithms like Natural Policy Gradient (NPG), inheriting their theoretical guarantees. Empirical evaluations on various tasks, including language and image generation, show that REBEL either matches or surpasses the performance of PPO and DPO.
Key Takeaways#
Why does it matter?#
This paper is crucial for RL researchers, especially those working with generative models. It offers a simpler, more efficient algorithm (REBEL) than existing methods like PPO, backed by strong theoretical guarantees. REBEL’s applicability to various RL tasks, including language and image generation, makes it a valuable tool for broader AI research.
Visual Insights#

This figure illustrates the REBEL algorithm, highlighting its simplicity and scalability compared to PPO. It shows how REBEL reduces policy optimization to regressing the difference in rewards between two policy choices. The figure also presents results demonstrating REBEL’s performance in image generation and language modeling, showcasing its competitive performance compared to existing methods like PPO and DPO on common benchmarks like AlpacaEval.

This table presents the results of TL;DR summarization experiments, comparing REBEL’s performance against several baseline reinforcement learning algorithms (DPO, Iterative DPO, PPO, REINFORCE, RLOO) across three different model sizes (1.4B, 2.8B, 6.9B parameters). The metrics evaluated are winrate (higher is better, indicating better summarization quality as judged by GPT4), reward model score (RM score, higher is better), and KL divergence (lower is better, representing smaller deviation from the supervised fine-tuned policy). The best-performing algorithm for each metric and model size is highlighted in bold, and the second-best is underlined.
In-depth insights#
REBEL Algorithm#
The REBEL algorithm, presented in the research paper, offers a novel approach to reinforcement learning by framing policy optimization as a relative reward regression problem. This minimalist approach is particularly well-suited for the fine-tuning of large language and image generation models. REBEL elegantly sidesteps the complexities of traditional methods like PPO, eliminating the need for value networks and clipping mechanisms. The algorithm’s theoretical underpinnings are robust, connecting it to established methods like Natural Policy Gradient and offering strong convergence guarantees. Empirically, REBEL demonstrates competitive performance with PPO and DPO, while boasting increased computational efficiency and simpler implementation. Furthermore, REBEL’s adaptability to offline data and intransitive preferences highlights its versatility and potential for broader applications in various reinforcement learning tasks. Its simplicity and effectiveness make it a promising advancement in the field.
Theoretical Guarantees#
The theoretical underpinnings of REBEL are noteworthy. The core idea of reducing RL to regression problems allows for cleaner theoretical analysis, moving away from the complexities of value functions and clipping found in PPO. The authors connect REBEL to established RL algorithms like Natural Policy Gradient (NPG), demonstrating that NPG can be viewed as an approximation of REBEL, providing a link to existing theoretical convergence guarantees. A key result is the reduction of the RL problem to a sequence of supervised learning problems. This enables the use of established results from supervised learning to bound the regret and guarantee convergence. This reduction simplifies the theoretical analysis significantly, providing strong theoretical support for REBEL’s effectiveness. However, the guarantees hinge on assumptions about the accuracy of regression models, a limitation that needs further exploration. The analysis also highlights the impact of data distribution and the coverage of the baseline policy. The paper shows how the strong guarantees in the paper are based on solving the regression problems accurately. Further work is needed to determine how well REBEL performs when the regression is not perfect, which is the usual scenario in practice. The paper provides a solid theoretical foundation for REBEL while acknowledging the need for further investigation into the practical implications of the assumptions made.
Empirical Results#
An Empirical Results section in a reinforcement learning research paper would ideally present a comprehensive evaluation demonstrating the efficacy of the proposed algorithm (e.g., REBEL). This would involve comparing its performance against established baselines (like PPO and DPO) across multiple tasks and metrics. Key metrics would include win rates (comparing model outputs against human preferences), reward model scores (assessing the quality of generated content), and KL divergence (measuring the difference between the learned and base policies). The results should show REBEL either matching or exceeding the performance of the baselines while demonstrating its superior computational efficiency. Visualizations, such as graphs showing learning curves and win-rate distributions, would enhance understanding and clarity. A detailed analysis of results across various model sizes would strengthen the findings, providing further insights into the scalability and generalizability of the approach. Finally, the discussion of results should carefully address any limitations or unexpected observations, demonstrating rigorousness and transparency.
Limitations#
A thoughtful analysis of the limitations section in a research paper would delve into the assumptions made, the scope of the claims, and the generalizability of findings. Addressing limitations honestly and comprehensively is crucial for assessing the validity and impact of the research. It would require a careful examination of the methodologies employed, specifically scrutinizing potential biases and shortcomings of the algorithms or models. The discussion should acknowledge the impact of data limitations, evaluating whether the results generalize beyond the specific datasets or conditions under which the experiments were performed. Furthermore, the analysis should touch on computational limitations, considering the scaling potential of the methods and their resource requirements. A transparent discussion should also address any strong assumptions made and their potential impact on the conclusions. Finally, potential societal impacts and ethical concerns related to the proposed methodology should be carefully considered and articulated.
Future Work#
The authors of the REBEL paper thoughtfully lay out several promising avenues for future research in their ‘Future Work’ section. They highlight the need to explore alternative loss functions beyond squared loss, potentially improving both practical performance and theoretical guarantees. Investigating the impact of different loss functions, such as log loss or cross-entropy, is crucial as it could lead to tighter theoretical bounds and potentially better empirical results. Furthermore, they acknowledge the importance of expanding the theoretical analysis to address the more general preference setting, which includes the inherent non-transitivity often encountered. This necessitates a shift from the simpler, reward-based RL to preference-based RL, requiring more sophisticated theoretical tools and potentially different algorithmic approaches. Finally, they suggest investigating the benefits of leveraging offline datasets in conjunction with online data for even greater efficiency and scalability of the REBEL algorithm. The combination of online and offline data could significantly enhance the performance of REBEL while addressing data scarcity issues.
More visual insights#
More on figures

This figure illustrates the REBEL algorithm, highlighting its simplicity and scalability. It shows how REBEL reduces policy optimization to a regression problem, eliminating the need for complex components like value functions and clipping, which are commonly used in algorithms like PPO. The figure also showcases REBEL’s application to both image generation and language modeling, demonstrating its competitive performance compared to PPO and DPO on standard benchmarks and AlpacaEval.

This figure shows the learning curves for both REBEL and PPO algorithms on the image generation task, plotted against the number of reward queries made to the LAION aesthetic predictor. The y-axis represents the LAION Aesthetic Score, a metric of image quality. The x-axis represents the number of reward queries. The shaded areas around each line represent the 95% confidence intervals, indicating the uncertainty in the results. The figure demonstrates the performance of each algorithm over time, highlighting how the aesthetic score changes as more queries are made.

This figure shows a comparison of image generation results using PPO and REBEL at an intermediate training checkpoint. Both methods generated images of five different animals. The numbers under each image represent the reward score for that specific image. The caption highlights that REBEL achieved higher reward scores with less training time and also generated more diverse backgrounds than PPO.

This figure shows a comparison of images generated by PPO and REBEL at a similar training stage. It highlights that REBEL, despite using less training time, achieves higher rewards (as measured by a reward model) and generates images with more diverse backgrounds compared to PPO.

This figure shows a comparison of images generated by the PPO and REBEL algorithms at an intermediate stage of training. The caption highlights that REBEL achieves a higher reward based on the reward model, even with less training time, and that the images produced by REBEL exhibit greater diversity in backgrounds compared to those from PPO. The visual comparison serves as empirical evidence supporting the algorithm’s efficacy.

This figure shows the trade-off between reward model score and KL divergence for both REBEL and PPO algorithms during the summarization task using a 2.8B model. The left plot visualizes the average reward score and KL-divergence at each time step during training, while the right plot illustrates the relationship by dividing the KL-divergence distribution into bins and showing the average reward score for each bin.

This figure shows the mean squared error (MSE) during the training of a 6.9B parameter policy using REBEL on a summarization task. The y-axis represents the MSE, and the x-axis represents the training iterations. The reward used is unbounded, ranging from -6.81 to 7.31. The plot includes both smoothed values (using a moving average) and the raw loss values for each iteration, illustrating the model’s learning process and the accuracy of its reward difference predictions over time.

This radar chart visualizes the performance of three different models (REBEL-OpenChat-3.5, Starling-LM-7B-alpha, and OpenChat-3.5) across eight sub-tasks within the MT-Bench benchmark. Each axis represents a specific sub-task (Writing, Humanities, Roleplay, Reasoning, STEM, Math, Extraction, and Coding), and the distance from the center to the point on each axis represents the model’s score on that specific sub-task. The chart allows for a quick comparison of the models’ strengths and weaknesses across different aspects of language understanding and generation.
More on tables

This table presents the results of the General Chat experiments, comparing the performance of REBEL against APA and a baseline model across several metrics: MT-Bench, AlpacaEval 2.0, and various benchmarks from the Open LLM Leaderboard. Each metric assesses different aspects of the model’s capabilities, such as reasoning, coding, and factual knowledge. The best performing model for each metric is highlighted in bold, showing REBEL’s superior performance in most cases.

This table presents the results of the General Chat experiments, comparing the performance of REBEL against several baselines across various metrics. The metrics used are AlpacaEval 2.0 (win rate and 5-shot win rate), MT-Bench, and Open LLM Leaderboard (MMLU, GSM8K, Arc, Winogrande, TruthfulQA, HellaSwag). The best-performing model for each metric is highlighted in bold. It’s important to note that the APA results are taken directly from the evaluation of the Starling-LM-7B-alpha model, not from a direct comparison in the same experimental setup.

This table presents the results of TL;DR summarization experiments using different RL algorithms and model sizes. The results are averaged over three random seeds to account for variability. The best-performing algorithm for each metric (winrate, reward model score, KL divergence) and model size is highlighted in bold, while the second-best is underlined. The table shows REBEL consistently outperforming the baselines in winrate, demonstrating its effectiveness in this summarization task.

This table presents the results of TL;DR summarization experiments using different reinforcement learning algorithms (REBEL, DPO, Iterative DPO, PPO, REINFORCE, RLOO) across three different model sizes (1.4B, 2.8B, and 6.9B parameters). The results show the win rate (higher is better), Reward Model (RM) score (higher is better), and KL Divergence (lower is better). The best performing algorithm for each metric and model size is highlighted in bold, while the second-best is underlined. The table demonstrates that REBEL achieves a better winrate than the other methods, suggesting superior performance in generating high-quality summaries.
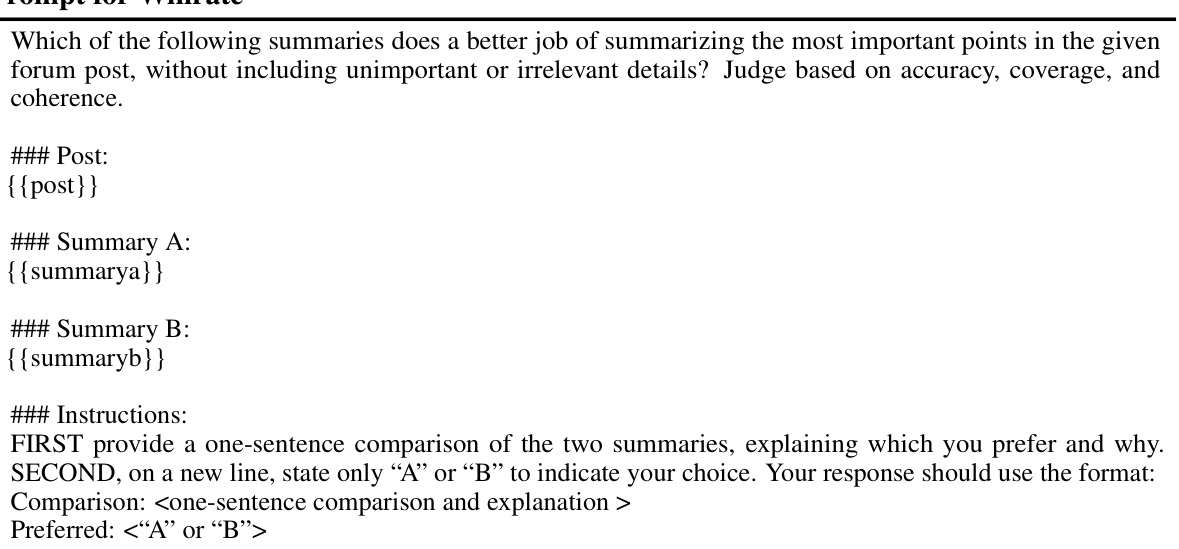
This table presents the results of the TL;DR summarization experiment. Three different model sizes (1.4B, 2.8B, and 6.9B parameters) are used, and for each size, multiple reinforcement learning algorithms (SFT, DPO, Iterative DPO, PPO, REINFORCE, RLOO, and REBEL) are compared. The table shows the win rate (higher is better), the reward model (RM) score (higher is better), and the KL divergence between the generated policy and the reference policy (lower is better). The best performing algorithm in terms of winrate is REBEL, outperforming all baselines.

This table presents the results of the TL;DR summarization experiments, comparing REBEL’s performance against several baseline reinforcement learning algorithms (DPO, Iterative DPO, PPO, REINFORCE, RLOO). The results are averaged across three random seeds, with standard deviations reported. The table shows win rate, reward model (RM) score, and KL-divergence for three different model sizes (1.4B, 2.8B, and 6.9B parameters). The best and second-best performing methods for each metric and model size are highlighted.

This table presents the results of the TL;DR summarization experiment. Three different model sizes (1.4B, 2.8B, and 6.9B parameters) were used, each trained with several different RL algorithms (SFT, DPO, Iterative DPO, PPO, REINFORCE, RLOO, and REBEL). The table shows the winrate (percentage of times the model’s summary was preferred to a human reference summary by GPT-4), the Reward Model (RM) score (a metric measuring the quality of generated summaries), and the KL divergence between the model’s policy and a reference policy. The best performing algorithm for each metric and model size is highlighted in bold, allowing for easy comparison.
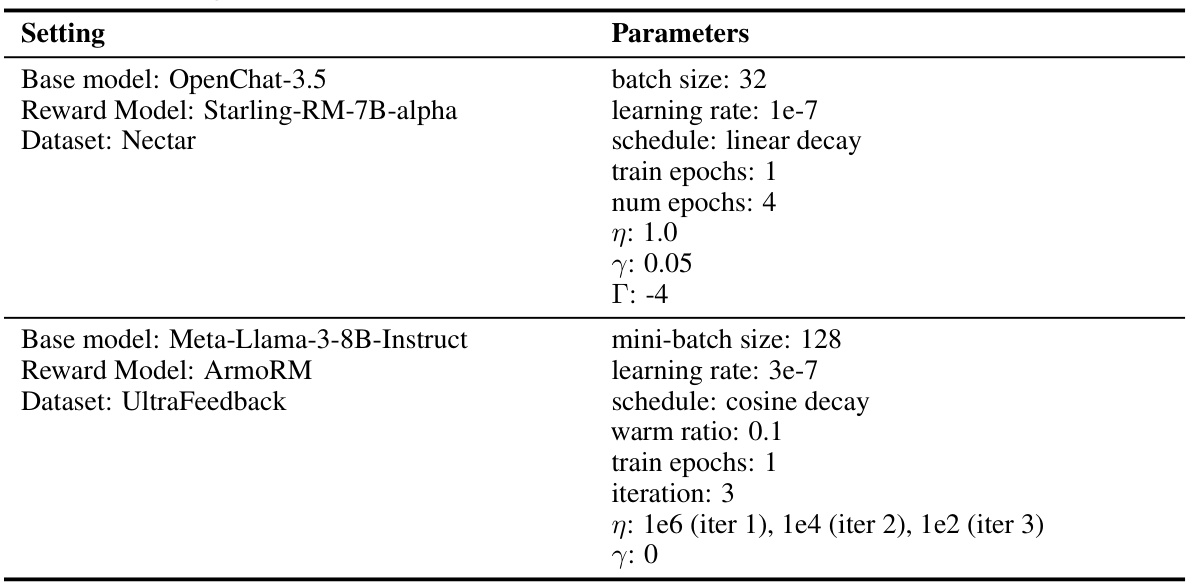
This table presents the results of TL;DR summarization experiments using different RL algorithms (DPO, Iterative DPO, PPO, REINFORCE, RLOO, and REBEL) and model sizes (1.4B, 2.8B, and 6.9B). The table compares the algorithms across three metrics: Winrate (higher is better, indicating better generation quality judged against human references), RM Score (higher is better, representing reward model score), and KL(π||πref) (lower is better, measuring the KL divergence from a supervised finetuned policy). The best performing algorithm for each metric and model size is highlighted in bold, with the second-best underlined. The results demonstrate that REBEL generally outperforms the baselines, especially in terms of winrate.
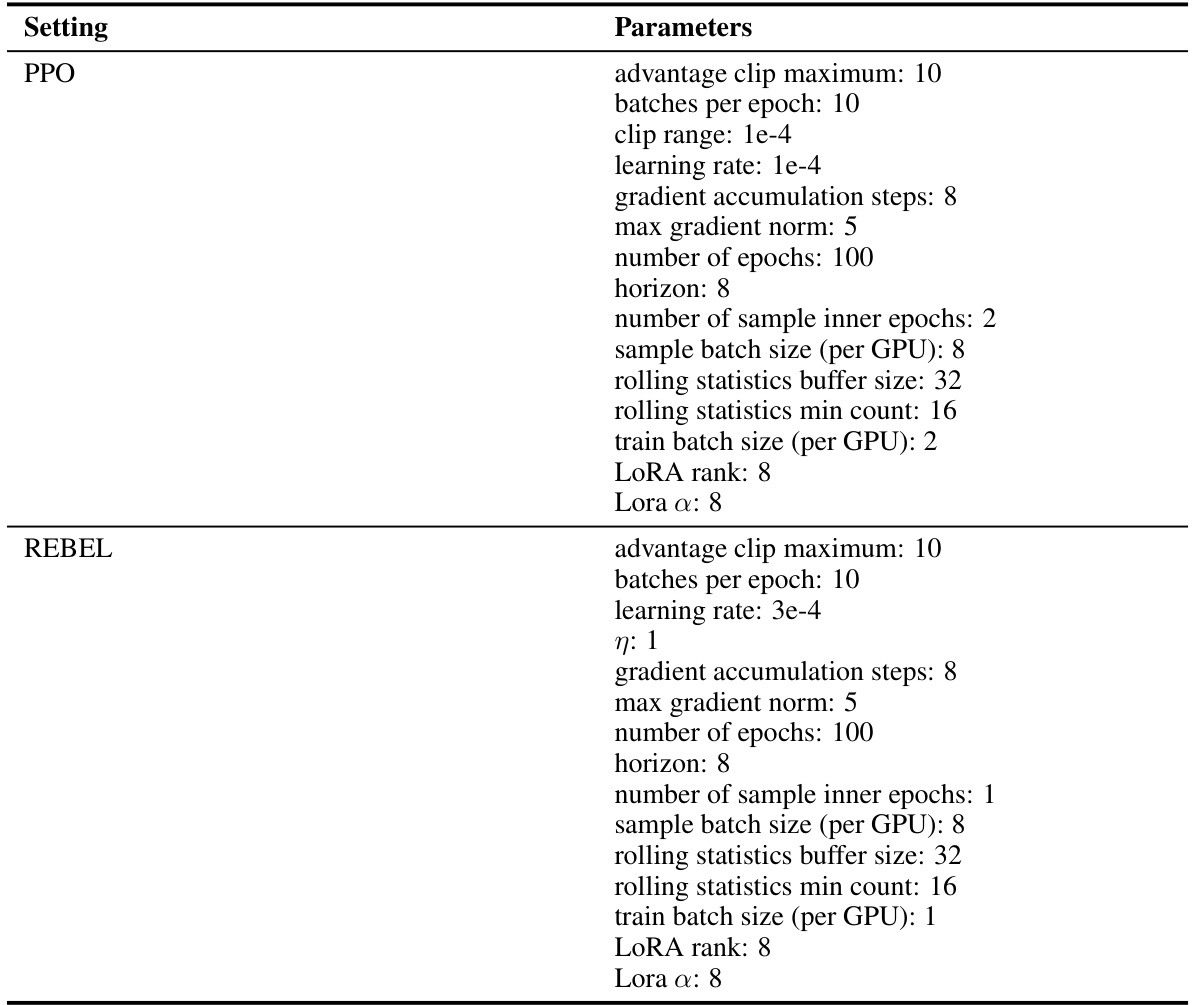
This table presents the results of TL;DR summarization experiments, comparing REBEL against several baselines (SFT, DPO, Iterative DPO, PPO, REINFORCE, RLOO). The results are averaged across three random seeds and show win rates, reward model (RM) scores, and KL divergence from a reference policy. The best performing method for each metric and model size is highlighted. REBEL demonstrates superior win rates compared to all baselines.

This table presents the results of TL;DR summarization experiments using different reinforcement learning algorithms, including REBEL, PPO, DPO, REINFORCE, and RLOO. It compares their performance across various metrics, such as win rate (as assessed by GPT-4), reward model (RM) score, and KL-divergence from a supervised fine-tuned (SFT) policy. The results are shown for three model sizes (1.4B, 2.8B, and 6.9B parameters) and averaged across three random seeds to assess statistical significance. The table highlights the best-performing algorithm for each metric and model size, showing REBEL’s superior win rate while demonstrating competitiveness across other metrics.

This table presents the results of the TL;DR summarization task, comparing REBEL against several baseline methods (DPO, Iterative DPO, PPO, REINFORCE, RLOO). Results are averaged across three random seeds and include win rate, reward model (RM) score, and KL divergence from a supervised fine-tuned (SFT) model. The table shows REBEL’s performance, especially in terms of win rate, across various model sizes (1.4B, 2.8B, and 6.9B parameters).
Full paper#


