↗ OpenReview ↗ NeurIPS Homepage ↗ Chat
TL;DR#
Machine learning models often struggle with generalization, particularly when the training data exhibits simplicity bias—a tendency to learn simple, low-complexity solutions that don’t generalize well to unseen data. Existing approaches primarily focus on improving model architecture or optimization techniques. However, this research explores a different avenue: manipulating the training data distribution. The core problem is that models tend to learn easily identifiable features first and might miss out on more subtle and useful features that are crucial for generalization.
This paper introduces a novel method called USEFUL (UpSample Early For Uniform Learning). USEFUL first trains the model for a few epochs and then identifies examples containing features learned early in training, essentially the easily identifiable ones. It upsamples the remaining examples (those containing the less easily identifiable, subtle features) once and restarts training. This process improves the uniform learning of features, leading to more robust and generalized models. Through extensive experiments, USEFUL consistently improves the performance of various optimization algorithms across multiple datasets and model architectures, often achieving state-of-the-art results.
Key Takeaways#
Why does it matter?#
This paper is crucial because it introduces a novel approach to improve model generalization by manipulating training data distribution. This offers a new perspective on the existing paradigm, moving beyond solely focusing on model architecture or optimization algorithms. It also presents promising empirical results and opens avenues for further research into the connection between data distribution and generalization performance.
Visual Insights#

This figure shows example images from the CIFAR-10 dataset that are classified as either slow-learnable or fast-learnable by the USEFUL method. Slow-learnable examples are visually ambiguous, often partially obscured or with a cluttered background. Fast-learnable examples are easily identifiable and clearly represent their class.

This table presents the sharpness of the solutions obtained by training ResNet18 on CIFAR10 using three different optimization methods: SGD, SGD+USEFUL, and SAM. Sharpness is measured using two metrics: the maximum Hessian eigenvalue (λmax) and the bulk spectrum (λmax/15). Lower values for both metrics generally indicate a flatter minimum, which is associated with better generalization performance.
In-depth insights#
Simplicity Bias Fix#
The concept of a ‘Simplicity Bias Fix’ in machine learning is crucial because the inherent tendency of optimization algorithms to converge towards simpler solutions (minimum norm) can hinder generalization performance. A ‘Simplicity Bias Fix’ aims to mitigate this bias, pushing the optimization landscape toward solutions that are not only accurate on the training data but also generalize well to unseen data. This often involves encouraging the model to learn a more diverse set of features, rather than relying on a few easily learned, yet potentially less informative ones. Methods for achieving this might involve architectural modifications promoting diversity, novel loss functions penalizing simplicity, or data augmentation strategies specifically designed to surface under-represented features. The effectiveness of a ‘Simplicity Bias Fix’ is evaluated by measuring the generalization gap on held-out datasets; a successful fix would result in a smaller gap. The ultimate goal is to enhance robustness and overall performance by ensuring the learned model captures the underlying data structure and not just superficial correlations, leading to broader applicability and real-world impact.
SAM’s Feature Learning#
The heading ‘SAM’s Feature Learning’ suggests an investigation into how the Sharpness-Aware Minimization (SAM) algorithm impacts the learning process of a model, specifically focusing on feature extraction and representation. A thoughtful analysis would delve into whether SAM learns features differently compared to standard gradient descent methods. Key aspects to consider include the speed at which various features are learned, exploring if SAM exhibits a more uniform learning rate across all features, potentially mitigating the well-known “simplicity bias” of gradient descent. The analysis should also investigate how SAM’s feature learning relates to generalization performance. Does a more uniform learning of features correlate with improved generalization on both seen and unseen data? Finally, the investigation should explore the theoretical underpinnings and empirical evidence supporting the claims related to SAM’s feature learning, including a comparison with other optimization techniques. Understanding the theoretical properties of SAM and how they influence its feature learning behavior is crucial to uncovering valuable insights.
USEFUL Method#
The USEFUL method, designed to mitigate simplicity bias and enhance in-distribution generalization, is a three-step process. First, it clusters examples based on early network outputs, identifying those with easily learned features. Second, it upsamples the remaining (less easily learned) examples, accelerating their learning. This addresses the uneven feature learning typical of standard gradient descent, a key cause of simplicity bias. Finally, it restarts training on this modified distribution. USEFUL’s theoretical underpinnings lie in a rigorous analysis of sharpness-aware minimization (SAM), showcasing how it learns features more uniformly than standard gradient descent. This motivated the design of USEFUL, aiming to mimic SAM’s beneficial behavior without its computational overhead. Empirical results demonstrate that USEFUL improves generalization performance across various datasets and model architectures, often achieving state-of-the-art results when combined with SAM and data augmentation techniques. The method’s relative simplicity and broad applicability are significant strengths.
Experimental Results#
The Experimental Results section of a research paper is crucial for validating the claims made in the introduction and theoretical analysis. A strong Experimental Results section will present the findings in a clear, concise manner, using appropriate visualizations such as graphs and tables to showcase the data. It’s essential to include a detailed description of the experimental setup, including the datasets used, the evaluation metrics, and the hyperparameters chosen. Any limitations or potential biases in the experimental design should be transparently acknowledged. The results should be presented in a way that readily demonstrates whether the hypotheses were supported or refuted. Statistical significance should be clearly reported, using techniques such as p-values or confidence intervals, to ascertain the reliability of the results. For reproducibility, it’s critical to provide sufficient information for other researchers to replicate the experiments, including details about the computational resources employed. A thoughtful discussion of the results is paramount, explaining any unexpected findings, analyzing potential sources of error, and comparing the results with prior research. Overall, the Experimental Results section should not just present raw data, but provide a well-supported, critical analysis of the experimental findings to strengthen the paper’s conclusions.
Future Directions#
Future research could explore extending the proposed method, USEFUL, to a broader range of models and datasets. Investigating its effectiveness on more complex architectures beyond the two-layer CNN and ResNet models evaluated in the paper would be valuable. Additionally, testing its robustness against different types of noise and data corruption (beyond the label noise briefly explored) would strengthen the findings. A theoretical analysis of USEFUL’s interaction with various optimization algorithms, including those beyond SGD and SAM, could offer significant insights into its underlying mechanisms. Furthermore, a deeper investigation into the interplay between simplicity bias and out-of-distribution generalization, potentially leading to novel strategies for improving both aspects, warrants further exploration. Finally, exploring applications in other domains, such as natural language processing or time-series analysis, could reveal the generalizability of the method and uncover previously unknown benefits.
More visual insights#
More on figures

This figure visualizes the output vectors of a ResNet18 model trained on CIFAR-10 and a CNN model trained on synthetic data using t-distributed stochastic neighbor embedding (t-SNE). The left panel shows the results for ResNet18 after 8 epochs of training on CIFAR-10, illustrating the separation of slow-learnable and fast-learnable features in the feature space. The right panel shows the results for a CNN trained on synthetic data generated according to a specific distribution (Definition 3.1 in the paper, with parameters Ba=0.2, Be=1, a=0.9) after 200 iterations. This panel also shows a clear separation between slow and fast learnable features. The visualization helps demonstrate how the model output can be used to identify examples with slow and fast learnable features early in training, which forms the basis for the proposed USEFUL method.

This figure compares the training dynamics of Gradient Descent (GD) and Sharpness-Aware Minimization (SAM) on synthetic datasets. It shows the alignment of learned model weights with fast and slow-learnable features over training iterations. GD learns the fast features much earlier than SAM. Increasing the strength of slow-learnable features improves accuracy for both GD and SAM, but more so for SAM, highlighting that SAM’s improved generalization is linked to more even learning of these features.

This figure compares the test classification error of different models trained using various optimization methods on five image classification datasets. The models are ResNet18 on CIFAR10, STL10, and TinyImageNet and ResNet34 on CIFAR100. The optimization methods include SGD, SGD with USEFUL, SAM, SAM with USEFUL, SAM with TrivialAugment, and SAM with USEFUL and TrivialAugment. The bars show the test error, and the numbers below indicate the relative training time compared to SGD. The figure demonstrates that USEFUL consistently improves the generalization performance of both SGD and SAM across all datasets, often achieving state-of-the-art results when combined with SAM and Trivial Augmentation.

This figure shows the test classification errors for various network architectures (VGG19, DenseNet121, ViT-S) trained on CIFAR-10 using different optimization methods: SGD, SGD with USEFUL, SAM, SAM with USEFUL, SAM with TrivialAugment (TA), and SAM with USEFUL and TA. The results demonstrate that USEFUL consistently improves the performance of both SGD and SAM across all architectures tested. Additionally, the combination of SAM with TA further enhances the performance, and adding USEFUL to this combination yields the best results in most cases. The ‘Time to Train w.r.t. SGD’ indicates the relative training time of each method compared to SGD.

This figure compares the performance of USEFUL against random upsampling when training ResNet18 on CIFAR10 and CIFAR100 datasets. It shows that USEFUL significantly improves the test classification error compared to both standard training (Orig) and random upsampling (Rand) for both SGD and SAM optimizers. The results highlight the effectiveness of USEFUL in improving generalization by carefully modifying the data distribution, rather than simply increasing the amount of data through random sampling.

This figure illustrates the workflow of the USEFUL algorithm. First, a model is trained on the original dataset for a small number of epochs. Then, USEFUL performs k-means clustering on the model’s output for each class to separate examples into two clusters: one with a higher average loss (representing examples containing slow-learnable features), and one with a lower average loss (examples with fast-learnable features). The algorithm then upsamples the cluster with the higher average loss and trains the model again from scratch on this modified dataset. The result is a model that learns features more uniformly.

This figure compares the learning speed of fast-learnable and slow-learnable features for both GD and SAM. The y-axis represents the difference between the alignment of model weights with fast-learnable and slow-learnable features, while the x-axis represents the training iteration. The plot shows that SAM learns both types of features at a more uniform speed compared to GD. The significant gap between the two curves in the early stages reflects the simplicity bias of GD, as it learns fast-learnable features much more quickly than slow-learnable ones. In contrast, SAM exhibits a more balanced learning rate for both feature types.
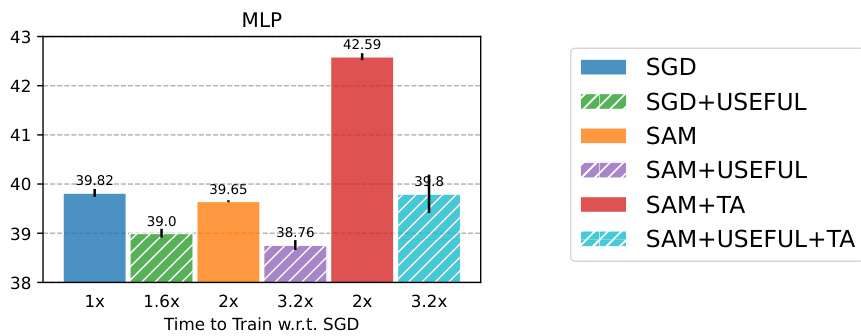
This figure shows the test classification errors of a 3-layer Multilayer Perceptron (MLP) model trained on the CIFAR-10 dataset using different optimization methods: SGD, SGD with USEFUL, SAM, SAM with USEFUL, SAM with TrivialAugment (TA), and SAM with USEFUL and TA. The x-axis represents the training time relative to the time taken by SGD. The y-axis shows the test error rate (%). The bars show the mean test error for each method and the ticks on top represent the standard deviation across multiple runs. The figure demonstrates that incorporating USEFUL consistently improves the performance of both SGD and SAM, achieving lower test error rates compared to the baselines. The combination of SAM and TA also leads to improved performance. The best performance is obtained by combining SAM, USEFUL and TA.

This figure compares the L1 norm of models trained using three different methods: SGD, SAM, and SGD+USEFUL. Lower L1 norms generally indicate sparser solutions and better implicit regularization, leading to improved generalization. The results show that SAM already achieves a lower L1 norm than SGD, and that the proposed USEFUL method further reduces the L1 norm when used in conjunction with SGD.

This figure shows the forgetting scores for training ResNet18 on CIFAR10. The forgetting score is a metric indicating how quickly examples are learned during training. A lower forgetting score implies that the example is learned quickly and retained effectively by the model. The figure compares the forgetting scores of three different training methods: standard SGD, SGD with USEFUL, and SAM. It shows that both SGD+USEFUL and SAM have fewer examples with high forgetting scores (meaning that the model struggles to learn and retain them effectively) than standard SGD. This demonstrates that USEFUL, by modifying the training data distribution, leads to similar training dynamics as SAM which improves model generalization, specifically in learning examples more uniformly in training.

This figure compares the performance of different optimization methods (SGD, SGD with USEFUL, SAM, SAM with USEFUL, SAM with TrivialAugment, and SAM with USEFUL and TrivialAugment) on the Waterbirds dataset. The results show that USEFUL consistently improves the performance of both SGD and SAM, highlighting its ability to generalize to out-of-distribution (OOD) settings. The figure also demonstrates the effectiveness of USEFUL in fine-tuning pre-trained models, suggesting its applicability to transfer learning.
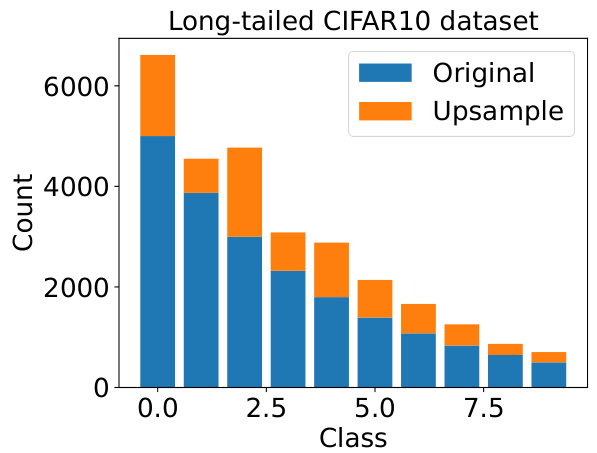
This figure shows the distribution of classes in the long-tailed CIFAR10 dataset before and after applying the USEFUL method. The original dataset has a highly imbalanced class distribution. USEFUL method aims to alleviate the simplicity bias by upsampling the under-represented classes, thus improving generalization performance. The figure visually demonstrates the effect of USEFUL on the class distribution, showing how it rebalances the dataset to a more even distribution of examples across the classes.

This figure presents the ablation study results of training ResNet18 on CIFAR10 dataset. It shows how the model’s performance changes depending on three factors: batch size, learning rate, and upsampling factor. The results reveal the impact of these hyperparameters on the effectiveness of the USEFUL method and helps determine optimal values for each.
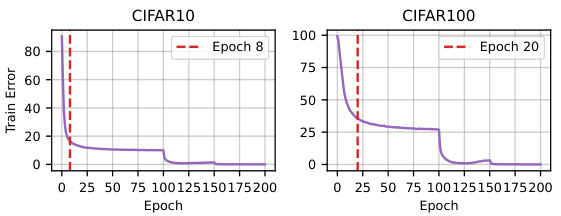
This figure shows the training error trajectories for CIFAR10 and CIFAR100. The left panel shows the training error over epochs for CIFAR10, highlighting the point where the decrease in training error starts to slow (marked with a red dotted line). This point is selected as the optimal epoch to apply USEFUL. The right panel visually represents the same information but for CIFAR100. The red dotted line again indicates the suggested epoch for applying the USEFUL technique. The figure visually supports the claim that choosing an appropriate separating epoch improves model accuracy.
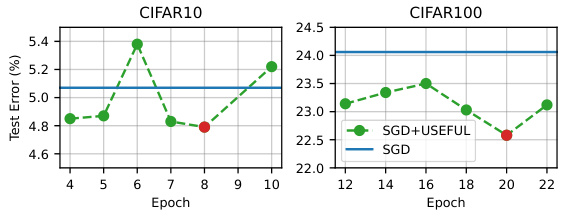
This figure shows the ablation study on choosing the optimal separating epoch in USEFUL. The left panel shows training error trajectories for CIFAR10 and CIFAR100, indicating the optimal epoch to separate fast-learnable and slow-learnable examples by the change in training error. The right panel presents test error results, illustrating that selecting the epoch according to the training error produces the best generalization performance.
More on tables

This table presents a comparison of the average forgetting score, first learned iteration, and iteration learned for two clusters of examples in CIFAR-10: fast-learnable and slow-learnable. The forgetting score measures the frequency with which an example is misclassified after being correctly classified. The first learned iteration is the epoch when a model predicts the example correctly for the first time. Iteration learned is the epoch after which the model correctly predicts the example consistently. The results show that fast-learnable examples have significantly lower forgetting scores and are learned much earlier than slow-learnable examples, indicating that the model learns these features more effectively.

This table presents a comparison of metrics for two clusters of examples in the CIFAR100 dataset: fast-learnable and slow-learnable. The metrics compared include the forgetting score (a measure of how frequently an example is misclassified during training), the first learned iteration (the first epoch an example is correctly classified), and the iteration learned (the epoch after which an example is consistently correctly classified). The data shows that fast-learnable examples tend to have lower forgetting scores and are learned earlier in training.
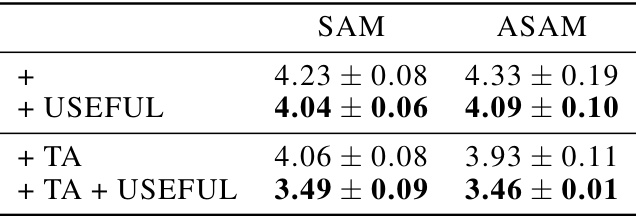
This table presents the test classification error rates achieved by training with SAM and ASAM (two different sharpness-aware minimization methods) on the original CIFAR-10 dataset and the dataset modified by the USEFUL method. It shows the error rates for SAM and ASAM alone, and with the addition of USEFUL and/or TrivialAugment (TA). The results are averaged over three different random seeds to ensure reliability.

This table compares the test classification errors of using USEFUL and a baseline method called ‘Upweighting Loss’. Upweighting Loss is a method that doubles the loss for examples identified as slow-learnable by USEFUL. The results show that USEFUL outperforms Upweighting Loss on both CIFAR10 and CIFAR100 datasets for both SGD and SAM optimizers. The key difference is that USEFUL modifies the data distribution once at the beginning, while Upweighting Loss dynamically adjusts weights during training.

This table presents the test error rates achieved by different training methods (SGD, SGD with USEFUL, SAM, SAM with USEFUL) on a long-tailed CIFAR10 dataset. Two scenarios are compared: a 1:10 class imbalance ratio and a balanced dataset achieved by upsampling the smaller classes. The results are averaged over three different random seeds for each training method to provide a measure of reliability.

This table compares the test classification errors achieved by using three different methods to partition the data for training with SGD. The methods compared are: Quantile, Misclassification, and the authors’ proposed USEFUL method. Results are reported for both CIFAR10 and CIFAR100 datasets and are averages across three independent experimental runs. The table shows that USEFUL achieves the lowest test errors.

This table shows the test error rates achieved by different training methods on CIFAR10 datasets with label noise. The results are obtained using MixUp and averaged over three independent runs. The methods compared include SGD, SGD with USEFUL, SAM, and SAM with USEFUL. Two noise rates are presented, 10% and 20%. The table demonstrates how USEFUL improves the performance of both SGD and SAM in the presence of label noise.

This table presents the test errors achieved by different simplicity bias reduction methods on the CIFAR-10 dataset. The results are averages over three independent trials, providing a measure of the methods’ performance consistency. The table compares the standard SGD approach against three other techniques: EIIL, JTT, and SGD+USEFUL. Lower test errors indicate better performance in reducing simplicity bias and improving generalization.
Full paper#


