↗ OpenReview ↗ NeurIPS Homepage ↗ Chat
TL;DR#
Algorithmic bias in machine learning poses significant challenges, impacting various domains. Existing fairness toolkits often have limitations in terms of data types supported, the range of fairness metrics they handle, and their robustness to overfitting. They may also lack flexibility and extensibility, hindering their application in diverse settings.
OxonFair is presented as a novel open-source toolkit designed to overcome these limitations. It offers broad support for data types (tabular, NLP, and Computer Vision), allows optimization of any fairness metric based on True/False Positives/Negatives, and incorporates joint optimization of performance objectives and fairness constraints. The toolkit’s flexibility is emphasized as a key advantage, enabling customization and adaptability to various fairness scenarios. Empirical evaluations demonstrate OxonFair’s effectiveness in mitigating bias while preserving model performance, even improving upon inadequately tuned unfair baselines.
Key Takeaways#
Why does it matter?#
This paper is crucial for researchers working on algorithmic fairness because it introduces OxonFair, a flexible and extensible toolkit. OxonFair addresses limitations of existing tools by supporting various data types (tabular, NLP, Computer Vision), optimizing any fairness metric based on True/False Positives/Negatives, and jointly optimizing performance with fairness constraints. This makes it highly valuable for researchers seeking to develop and evaluate fair machine learning models across different domains and data modalities.
Visual Insights#

This figure demonstrates the advantages of OxonFair over existing fairness toolkits. The left panel shows the trade-off between accuracy and demographic parity when enforcing fairness, highlighting the importance of jointly optimizing both metrics. The top-right panel illustrates the robustness of OxonFair to overfitting by using validation data for fairness enforcement. The bottom-right panel provides a comparison of OxonFair, Fairlearn, and AIF360 in terms of the number of methods, adjustable fairness criteria, support for multiple groups, fairness definitions, and data types.

This table compares the performance of Fairlearn and OxonFair on the COMPAS dataset, focusing on accuracy and demographic parity. The left side shows results without using group annotations at test time, highlighting the effectiveness of OxonFair even in this setting. The right side contrasts the runtime performance of both methods, showing OxonFair’s efficiency particularly when dealing with a higher number of groups, even given its exponential complexity. OxonFair’s accelerated method is significantly faster than its naive implementation, especially for scenarios with multiple groups.
In-depth insights#
Fairness Toolkit#
A fairness toolkit is a crucial tool for promoting fairness in machine learning models. It allows developers to measure and mitigate bias, offering various methods to address disparate impacts in algorithms. Such toolkits are essential given the increasing use of AI in high-stakes decision-making. The effectiveness of a fairness toolkit hinges on its flexibility to accommodate different fairness metrics and its capacity to integrate with various machine learning frameworks. A robust toolkit will not only provide multiple pre-processing, in-processing and post-processing techniques, but also offer tools for evaluating fairness at various stages. A key consideration is the compatibility with existing ML tools to streamline the development workflow. Further, explainability and transparency are paramount, empowering users to understand how fairness is being achieved. Ultimately, a good fairness toolkit should enable a practical and principled approach to fairness, bridging the gap between theoretical research and effective implementation. The toolkit’s ability to handle real-world scenarios, involving high-dimensional data and diverse fairness considerations, reflects its maturity and applicability.
Validation Robustness#
Validation robustness is a critical aspect of algorithmic fairness research. A robust fairness method should generalize well to unseen data, avoiding overfitting to the training set. Overfitting in fairness can lead to models that appear fair during training but exhibit bias when applied to real-world data. Methods that employ validation data to tune fairness thresholds, or that jointly optimize fairness and performance metrics on validation data, are particularly desirable for improved robustness. The use of held-out validation sets allows for a more accurate assessment of the model’s fairness in a setting less susceptible to overfitting, improving the generalizability and reliability of fairness guarantees. OxonFair’s methodology, which emphasizes validation-based fairness enforcement, is a key contribution to building more robust and trustworthy AI systems.
Deep Network Fairness#
Enforcing fairness in deep learning models presents unique challenges due to their complexity and potential for amplifying biases present in training data. A key aspect is the choice of fairness metric, as different metrics prioritize different aspects of fairness. The impact of various model architectures on fairness needs careful consideration. Methods for achieving fairness in deep networks include pre-processing, in-processing, and post-processing techniques. Pre-processing involves modifying the data before training, while in-processing adjusts the training process itself and post-processing modifies predictions after training. The effectiveness of each approach varies depending on the specific dataset, model, and fairness definition. Developing robust and reliable methods is essential for ensuring fairness in the deployment of deep learning systems, particularly in high-stakes domains with potential for discriminatory outcomes. Practical considerations include the computational cost and interpretability of different fairness techniques. Evaluating the trade-off between fairness and accuracy is crucial for practical applications, emphasizing the importance of a holistic and thoughtful approach to algorithmic fairness.
Expressive Measures#
The concept of “Expressive Measures” in algorithmic fairness research refers to the ability of a fairness toolkit to capture and operationalize a wide range of fairness metrics beyond the standard, limited set often found in existing tools. This expressiveness is crucial because different fairness definitions may be better suited to capture the harms of algorithmic bias across various contexts. A truly expressive toolkit allows researchers and practitioners to specify and optimize custom fairness metrics tailored to their specific needs, which is far superior to a limited pre-defined set of options. This avoids the problem of ‘one-size-fits-all’ approaches that may be inadequate or even harmful in certain situations. The ideal scenario would be a method that allows for optimization of a chosen performance measure alongside fairness constraints, enabling users to select the best trade-off between fairness and accuracy in their application. This goes beyond simple enforcement of a specific metric and allows for nuance and context-specific fairness considerations, which is a critical advancement in the field. A focus on expressiveness also highlights the importance of incorporating user-defined objectives and constraints, moving from method-driven approaches to a more flexible and customizable measure-based system.
Bias Mitigation#
The concept of bias mitigation in algorithmic fairness is multifaceted. Pre-processing methods aim to modify data before model training, often by re-weighting samples or generating synthetic data to balance class distributions. While effective, these methods can inadvertently introduce new biases or fail to address complex interactions. In-processing methods adjust the training process itself, for example, by adding fairness constraints to the loss function or employing adversarial training. These methods directly incorporate fairness into the model’s learning, but can lead to reduced model accuracy or require extensive computational resources. Post-processing methods modify model outputs after training, often by adjusting classification thresholds to achieve fairer predictions across different groups. This approach is model-agnostic and computationally efficient, but may not fully address underlying biases in the data or model. The selection of the optimal bias mitigation strategy depends heavily on the specific dataset, the chosen fairness metric, and the trade-off between accuracy and fairness. Future research should focus on developing more sophisticated and robust methods, and creating tools that allow practitioners to easily evaluate and compare different approaches in diverse contexts.
More visual insights#
More on figures

This figure illustrates three key aspects of the OxonFair toolkit. The left panel details the fast path algorithm used for handling situations where group membership is inferred (noisy) rather than directly observed. It explains the efficient cumulative summation technique used for optimizing thresholds across different groups. The center panel shows how the toolkit combines two neural network heads (original classifier and a group predictor) to produce a fair classifier, thereby extending its applicability to deep learning models. Finally, the right panel showcases the output distribution of a group prediction head in the CelebA dataset, demonstrating the bimodal distribution resulting from the noisy estimation of group membership. The bimodal distribution, in turn, supports the approach where thresholds are learned for each estimated group to mitigate bias.

The figure compares the performance of OxonFair and Fairlearn on the COMPAS dataset (left) and the Adult dataset (right). The left panel shows the accuracy and equal opportunity violation for various fairness methods on the COMPAS dataset without using group annotations at test time, highlighting OxonFair’s performance. The right panel compares the runtime of Fairlearn Reductions and OxonFair on the Adult dataset with varying numbers of groups, demonstrating OxonFair’s efficiency despite its exponential complexity for a larger number of groups.

This figure demonstrates three key aspects of OxonFair. The left panel shows the trade-off between accuracy and demographic parity when enforcing fairness using various methods. OxonFair, unlike others, jointly optimizes both, avoiding the deterioration of fairness with improved accuracy. The top-right panel highlights OxonFair’s robustness against overfitting by using validation data for fairness enforcement, unlike Fairlearn. The bottom-right panel compares OxonFair with AIF360 and Fairlearn, showcasing OxonFair’s broader applicability (NLP, Computer Vision, tabular) and expressiveness in supporting diverse fairness measures and objectives.

The left plot shows the Pareto frontier for minimum group recall versus accuracy for the ‘Blond Hair’ attribute in the CelebA dataset, highlighting OxonFair’s superior performance. The right plot compares the accuracy of various fairness methods across 26 CelebA attributes by adjusting global decision thresholds to achieve a minimum group recall level (δ).

This figure demonstrates the necessity of jointly optimizing fairness and accuracy. The left panel shows how simply adjusting classification thresholds to improve accuracy can negatively impact fairness. The top-right panel illustrates OxonFair’s robustness against overfitting by utilizing validation data, unlike Fairlearn. Finally, the bottom-right panel offers a comparison of OxonFair’s flexibility and capabilities against other popular fairness toolkits like AIF360 and Fairlearn, highlighting OxonFair’s broader support for data types and fairness metrics.

This figure demonstrates the advantages of OxonFair over existing fairness toolkits. The left panel shows that optimizing for accuracy alone can lead to a deterioration in fairness. OxonFair jointly optimizes for accuracy and fairness. The top-right panel highlights the importance of using validation data to prevent overfitting and maintain fairness on unseen data. The bottom-right panel summarizes the features and capabilities of OxonFair compared to existing toolkits, such as Fairlearn and AIF360. OxonFair supports a wider range of data types and fairness criteria.

This figure demonstrates the Pareto frontier obtained by using OxonFair to maximize accuracy while ensuring that the minimum recall across all groups is at least 0.7. The plot shows the trade-off between accuracy and minimal group recall. The points on the frontier represent different solutions, each with a different balance between accuracy and the minimum recall achieved across all groups. The selected solution (marked with a star) represents the highest accuracy achieved while meeting the minimum recall constraint.

This figure demonstrates the effect of enforcing demographic parity with different rate constraints. The left panel shows the change in precision as demographic parity is enforced, highlighting that precision is a more informative metric than accuracy for low selection rates. The right panel illustrates the ratio of selection rates between different groups, emphasizing that this ratio is more informative than the difference in selection rates, especially when selection rates are low. The instability of the ratio as selection rates approach zero is also pointed out.

This figure compares the performance of OxonFair and Fairret in enforcing fairness on the adult dataset using sex as the protected attribute. Two different base classifiers are used: a simple neural network and XGBoost. The plots show the accuracy versus the difference in equal opportunity (DEO) and demographic parity for different settings of the Fairret algorithm, as well as the performance of OxonFair, highlighting its flexibility to achieve a range of accuracy-fairness trade-offs via its Pareto frontier.

This figure demonstrates the trade-offs involved when enforcing equalized odds fairness. The left panel shows per-group recall and specificity changes compared to an unfair baseline classifier. The right panel compares different OxonFair thresholding strategies (single threshold, deterministic multi-thresholds, and randomized multi-thresholds) in terms of accuracy and equalized odds violation on validation data.

This figure compares the performance of single-threshold OxonFair, multi-threshold OxonFair, and the method from [57] in terms of equalized odds violation and accuracy. It shows that the multi-threshold approaches (both OxonFair and the method from [57]) perform similarly, achieving lower equalized odds violations at comparable accuracy than the single-threshold OxonFair approach. This highlights the benefit of using multiple thresholds for better fairness-accuracy trade-offs.

This figure compares the performance of different methods for enforcing equalized odds fairness, specifically focusing on the impact of using inferred group characteristics (where group membership is predicted rather than directly observed) and different thresholding strategies (single threshold vs. multi-threshold). The results reveal that while multi-threshold methods are superior on the validation set, single-threshold methods generalize better to unseen test data. This difference is attributed to the tendency of multi-threshold methods to produce classifiers that are more susceptible to differences in data distribution between validation and test sets.

This figure demonstrates the advantages of OxonFair over existing fairness toolkits. The left panel shows the trade-off between accuracy and demographic parity when enforcing fairness, highlighting OxonFair’s ability to jointly optimize both. The top-right panel illustrates OxonFair’s robustness to overfitting by using validation data, unlike Fairlearn which overfits. The bottom-right panel compares the features and capabilities of OxonFair, Fairlearn, and AIF360, showcasing OxonFair’s flexibility and broader support.

This figure demonstrates the advantages of OxonFair over other fairness toolkits. The left panel shows the trade-off between accuracy and fairness when adjusting thresholds; OxonFair jointly optimizes both. The top-right panel illustrates OxonFair’s robustness to overfitting by using validation data, unlike Fairlearn which perfectly overfits. The bottom-right panel provides a comparison of the features and capabilities of AIF360, Fairlearn, and OxonFair, highlighting OxonFair’s flexibility and broader support for various data types and fairness metrics.
More on tables

This table compares the performance of OxonFair against other fairness methods on the CelebA dataset for 14 gender-independent attributes. It shows accuracy and difference in equal opportunity (DEO) scores. OxonFair outperforms other methods in both metrics.

This table presents a detailed comparison of various algorithmic fairness methods’ performance on the CelebA test set. It expands on the information presented in Table 2, offering a more comprehensive evaluation across multiple fairness metrics. The metrics compared include mean accuracy, difference in equal opportunity (DEO), and minimum group minimum label accuracy. The table allows for a detailed analysis of each method’s effectiveness in achieving both high accuracy and fairness across different subsets of attributes within the CelebA dataset.

This table presents the results of a computer vision experiment using the CelebA dataset. It compares the performance of OxonFair against several other fairness methods on 14 gender-independent attributes. The metrics used are accuracy and difference in equal opportunity (DEO). The table shows that OxonFair, when optimizing for both accuracy and DEO, outperforms other methods in terms of both higher accuracy and lower DEO scores, indicating superior fairness.

This table presents the results of experiments conducted on the Multilingual Twitter dataset, focusing on gender as a protected attribute. It compares the performance of various bias mitigation techniques, including the proposed OxonFair method, across three evaluation metrics: F1 score, Balanced Accuracy, and Equal Opportunity Difference (DEO). The ‘Base’ row represents the performance of a baseline model without fairness considerations, while subsequent rows show results for different methods. OxonFair is evaluated using different optimization objectives (Accuracy, F1, Balanced Accuracy) to illustrate its flexibility.

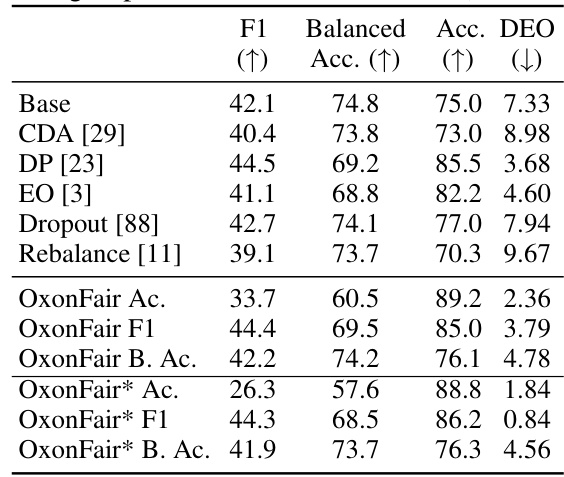
This table presents a comparison of different bias mitigation methods on the Jigsaw dataset, focusing on the prediction of religious affiliation. The methods compared include a baseline (Base), Counterfactual Data Augmentation (CDA), Demographic Parity (DP), Equal Opportunity (EO), Dropout, and Rebalance. The evaluation metrics used are F1 score, Balanced Accuracy, and Difference in Equal Opportunity (DEO). OxonFair results are presented with different optimization objectives (Accuracy, F1, Balanced Accuracy), with and without inferred group membership (*). The table showcases the performance of each method in mitigating bias and improving fairness metrics for predicting religious group membership.

This table compares the fairness measures defined by Verma and Rubin [61] with their corresponding names in the OxonFair toolkit and indicates whether they are supported by the Fairlearn toolkit. It shows that OxonFair supports all 9 group-level fairness metrics from Verma and Rubin’s work, while Fairlearn only supports a subset of them. The table also highlights that OxonFair handles both group-level and individual-level fairness definitions, while Fairlearn primarily focuses on group-level metrics. The ‘Not decision based’ entries indicate fairness measures not directly related to classifier decisions.

This table compares the post-training fairness measures reviewed in a paper by [93] with the OxonFair toolkit’s capabilities. It lists various fairness metrics and indicates whether each metric is supported by the OxonFair toolkit and Fairlearn. The table helps demonstrate the breadth of fairness measures that OxonFair can handle.

This table presents the results of enforcing various fairness definitions on the COMPAS dataset using inferred attributes. It compares the original and updated performance metrics (measures and accuracy) after applying OxonFair’s fairness-enhancing techniques. Despite challenges posed by limited data for the ‘Other’ ethnicity group, OxonFair shows improvements across all metrics. Specific fairness constraints are enforced on the training data to control the level of fairness achieved.

This table compares the performance of three different methods (ERM, Minimax, and OxonFair) on the Adult dataset when using sex as the protected attribute. It shows the minimum accuracy and overall accuracy achieved by each method on the training, validation, and test sets. The results demonstrate that OxonFair achieves a better balance between minimum accuracy and overall accuracy compared to the other methods.

This table compares the runtime performance of the method proposed in the paper [57] and OxonFair when enforcing fairness constraints on the Folktables dataset. The experiment uses four racial groups which represents the largest problem in [57]. The result shows that [57] is faster when enforcing fairness up to a specific level (e.g., maximizing accuracy subject to EOdds<0.05%). However, OxonFair is faster when computing the entire fairness-accuracy frontier.

This table compares the performance of OxonFair (single threshold and multi-threshold versions) and FairLearn in enforcing Equalized Odds fairness. The results show that OxonFair’s multi-threshold approach achieves similar accuracy to FairLearn but with significantly lower Equalized Odds violation.

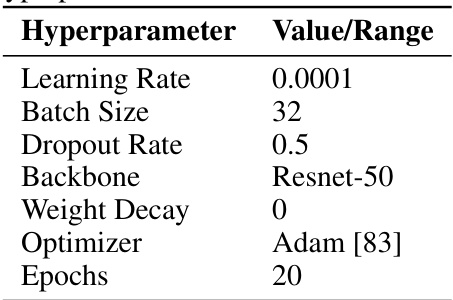
This table lists the hyperparameters used in the CelebA experiment, including the learning rate, batch size, dropout rate, backbone architecture, weight decay, optimizer, and number of epochs.

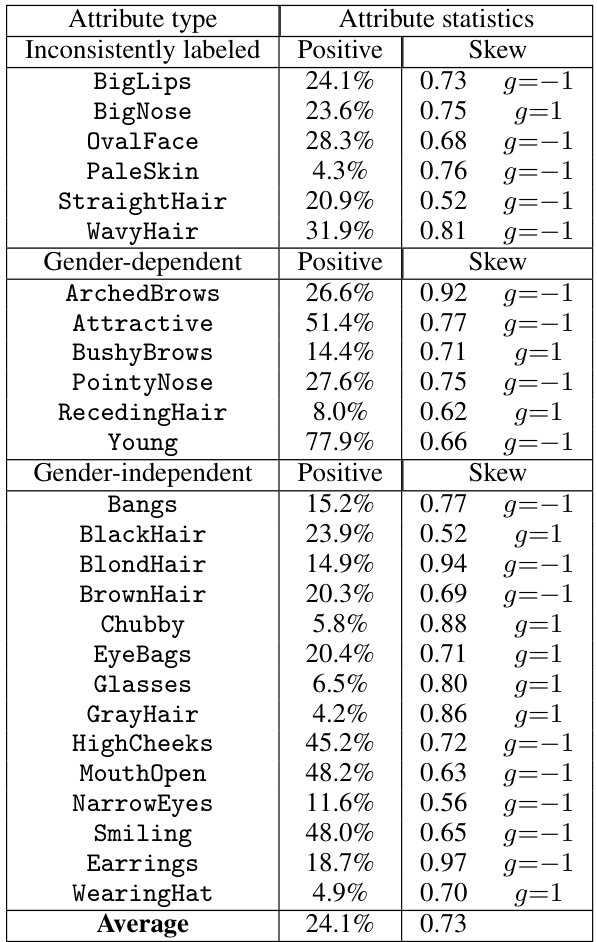
This table presents attribute-level information for the CelebA dataset, extracted from the work of Ranaswamy et al. [28]. Each row represents a different attribute (e.g., BigLips, BlondHair, etc.). The table shows the percentage of positive samples for each attribute and a skew value, which indicates the imbalance of the positive labels for each attribute (g = 1 representing female and g = -1 representing male). For instance, the ‘Earrings’ attribute has a skew of 0.97 towards g=-1, meaning 97% of positive samples have a gender expression label of -1 (male). This table is useful for understanding the characteristics and biases present in the CelebA dataset.

This table presents attribute-level information from the CelebA dataset, focusing on the characteristics of each attribute: name, percentage of positive samples, and skew. The skew indicates the distribution of positive samples with respect to a gender expression label (g=1 for female, g=-1 for male). This information helps in understanding the dataset’s composition and potential biases.

This table presents a detailed comparison of various algorithmic fairness methods on the CelebA test set. It expands on Table 2 by providing a more comprehensive evaluation, including the mean accuracy, difference in equal opportunity (DEO), and the minimum group minimum label accuracy across multiple attributes within the dataset. The comparison helps to illustrate the effectiveness of different methods in addressing fairness challenges in computer vision tasks.

This table compares the performance of several fairness methods (Baseline, Adaptive g-SMOTE, g-SMOTE, OxonFair-DEO, and OxonFair-MGA) on a training set with 4 protected groups, measuring accuracy, minimum group accuracy and difference in equal opportunity. The results are averages across 32 labels. Methods marked with * are from a cited paper.

This table presents the number of samples used for training, validation, and testing in the Multilingual Twitter corpus experiment. The data is further broken down by gender (0 and 1), country (0 and 1), ethnicity (0 and 1), and age (0 and 1) for each language included in the experiment (English, Polish, Spanish, Portuguese, Italian).

This table presents the results of various fairness methods on the CelebA dataset. It compares the performance of OxonFair against other methods (ERM, Uniconf, Domain Adv, Domain Disc, Domain Ind, g-SMOTE, g-SMOTE Adaptive, FairMixup), measuring accuracy and difference in equal opportunity (DEO). OxonFair shows superior performance across different metrics compared to other fair methods.

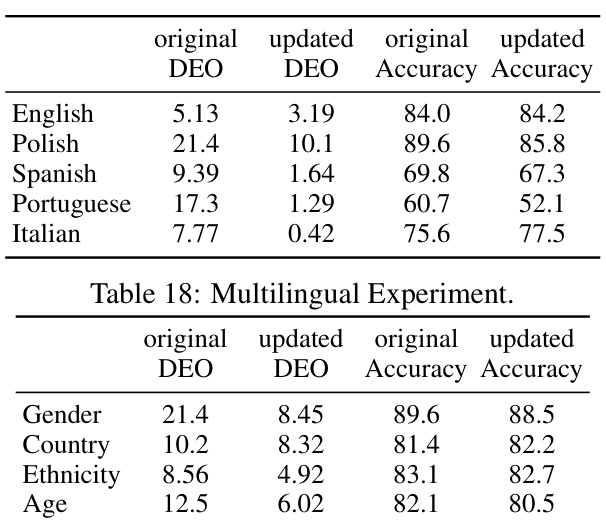
This table shows the results of a multilingual experiment. The experiment evaluated the performance of OxonFair across five languages (English, Polish, Spanish, Portuguese, and Italian) for hate speech detection. The table displays the original and updated values of Difference in Equal Opportunity (DEO) and Accuracy for each language. The updated values represent the performance after applying OxonFair’s fairness-enhancing techniques.

This table presents the number of positive and total samples for the Jigsaw religion dataset, categorized into three groups: Christian, Muslim, and Other (all other religions). The data is split into training, validation, and test sets.

This table shows the number of negative and positive samples for the training, validation, and testing sets for the Jigsaw dataset, broken down by race (Black and Asian). It is used in the NLP experiments to evaluate the performance of the OxonFair toolkit in handling hate speech detection with multiple protected groups.

This table provides attribute-level information for the CelebA dataset, sourced from the work of Ramaswamy et al. [28]. Each row represents a different attribute, offering details on its type (gender-dependent, gender-independent, inconsistently labeled), the percentage of positive samples for that attribute, and its skew. The skew metric indicates the imbalance in the positive samples, relative to the gender expression label. For instance, a skew value of 0.97 towards g=-1 means 97% of positive samples have a gender expression label of -1. This table is valuable for understanding the characteristics and potential biases within the CelebA dataset, especially regarding gender representation.

This table presents the results of a fairness experiment on the Jigsaw dataset, focusing on the race attribute with two groups: Black and Asian. It compares several bias mitigation methods against a baseline model, evaluating performance using F1 score, balanced accuracy, and difference in equal opportunity (DEO). The table shows how OxonFair performs compared to other methods in terms of accuracy and fairness.
Full paper#


