↗ OpenReview ↗ NeurIPS Proc. ↗ Chat
TL;DR#
Estimating epistemic uncertainty in GNNs, especially for graph data, is challenging due to its multi-scale nature. Existing methods either ignore this or only differentiate between structure-aware and -agnostic uncertainty, lacking a unified measure. This leads to unreliable predictions, particularly under distribution shifts.
The paper introduces GEBM, a novel energy-based model, which addresses these limitations. GEBM leverages graph diffusion to aggregate energy at different structural scales (local, group, and independent), providing a single, theoretically grounded uncertainty measure. GEBM incorporates a Gaussian regularizer, ensuring integrability and mitigating overconfidence, and offers an evidential interpretation that significantly boosts predictive robustness. Extensive experiments demonstrate GEBM’s superior performance in out-of-distribution detection across various datasets and distribution shifts.
Key Takeaways#
Why does it matter?#
This paper is crucial for researchers working with graph neural networks (GNNs) and uncertainty quantification. It addresses a critical limitation in existing methods by proposing a novel approach that accounts for uncertainty at multiple structural levels within graphs. This work is highly relevant to the growing field of reliable machine learning, opening new avenues for improving GNN robustness and safety in various applications. The new energy-based method, GEBM, significantly improves predictive robustness and achieves state-of-the-art performance in out-of-distribution detection.
Visual Insights#

The figure illustrates the architecture of the Graph Energy-based Model (GEBM) for estimating epistemic uncertainty in Graph Neural Networks (GNNs). It shows how graph-agnostic uncertainty from a pre-trained GNN is processed through three levels: local, group, and independent. Each level uses graph diffusion and energy marginalization to capture uncertainty at different structural scales. Finally, these uncertainty estimates are combined using a ‘softmax’-like aggregation to produce a single measure of epistemic uncertainty sensitive to various anomaly types.

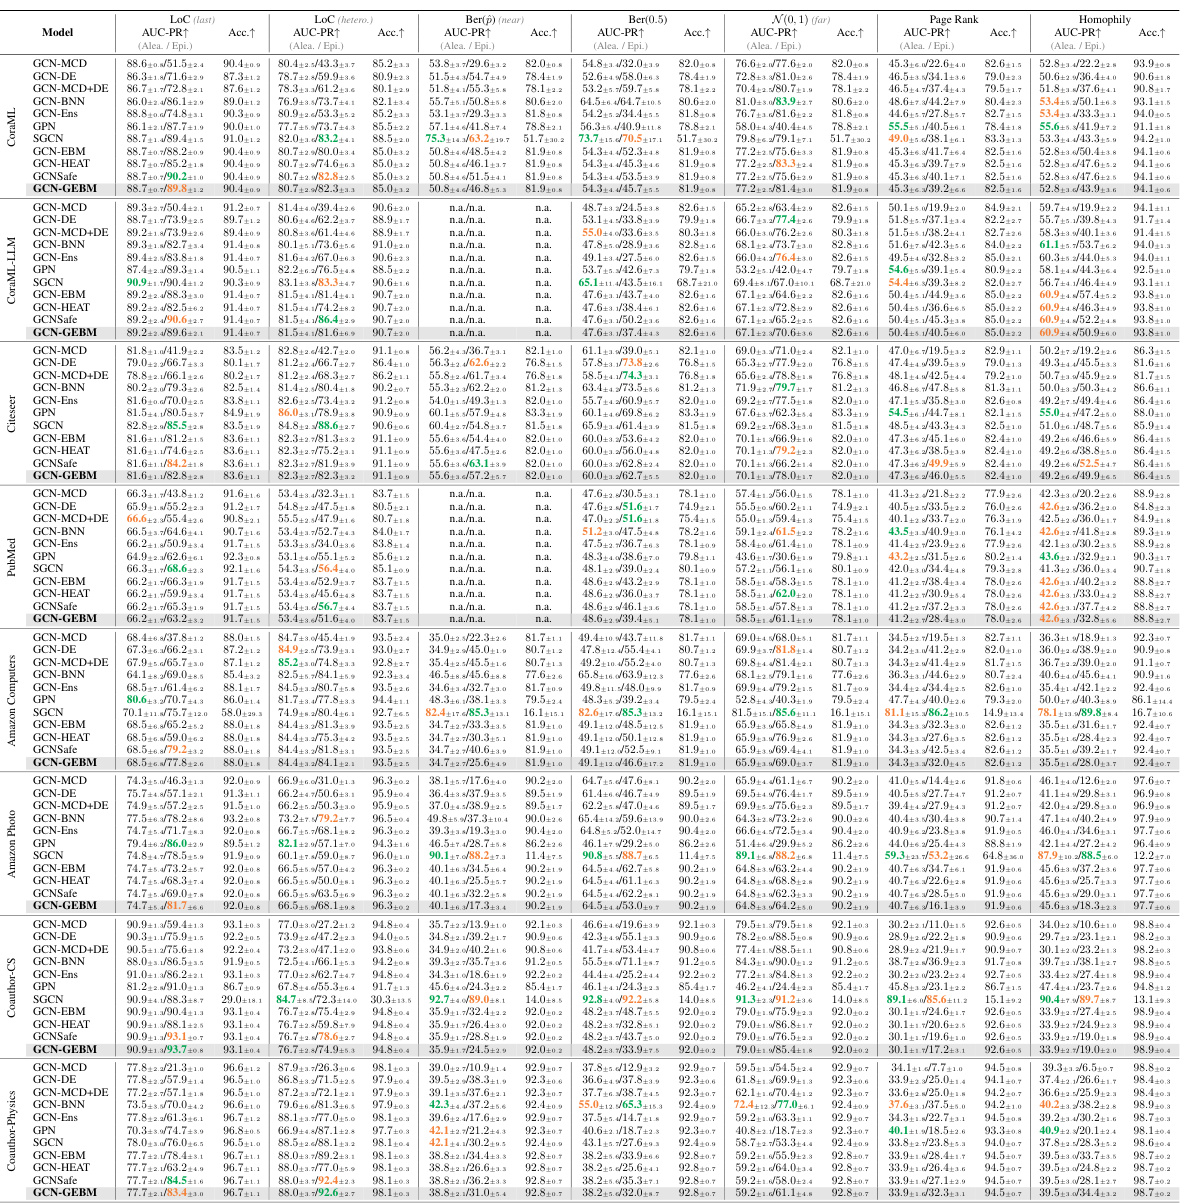
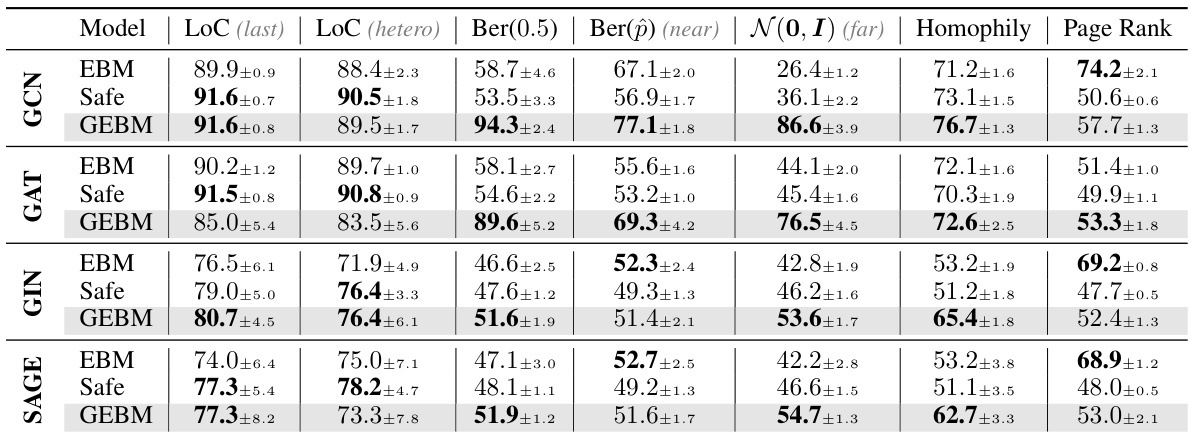
This table presents the results of out-of-distribution detection using both aleatoric and epistemic uncertainty measures. It compares the performance of several models (GCN-DE, GCN-Ens, GPN, GCN-EBM, GCN-HEAT, GCNSafe, and GCN-GEBM) across seven datasets and various types of distribution shifts. The AUC-ROC (Area Under the Receiver Operating Characteristic curve) and accuracy are reported for each model under each distribution shift. The table highlights that the proposed GCN-GEBM model consistently demonstrates the best or second-best performance in separating in-distribution and out-of-distribution data across most of the datasets and shift types.
In-depth insights#
GEBM: Graph Uncertainty#
The heading ‘GEBM: Graph Uncertainty’ suggests a focus on using the Graph Energy-Based Model (GEBM) to quantify uncertainty within graph neural networks (GNNs). A key aspect would likely be GEBM’s ability to capture uncertainty at multiple structural scales within the graph, unlike previous methods. The model probably incorporates energy functions at node, cluster, and global levels, combining these via a sophisticated aggregation method (e.g., a soft maximum) to yield a single uncertainty estimate. Theoretical guarantees on the integrability of the resulting probability density, possibly achieved through regularization techniques (e.g., Gaussian regularization), would likely be a core component of the work. The evidential interpretation of GEBM could be highlighted, implying that the model’s output not only estimates uncertainty but also improves the model’s robustness to distribution shifts. Therefore, the section would likely detail the model architecture, emphasizing structure-awareness and the mathematical foundation underpinning GEBM’s ability to provide reliable uncertainty estimates in complex graph-structured data.
Energy Aggregation#
Energy aggregation in the context of epistemic uncertainty estimation for graph neural networks (GNNs) involves combining uncertainty measures from different structural levels within a graph. The core idea is that uncertainty isn’t solely localized to individual nodes but can emerge at various scales, from local neighborhoods to entire graph structures. Effective energy aggregation methods must capture this multi-scale nature of uncertainty. A straightforward approach might involve simply summing energies from different levels, while more sophisticated techniques could employ weighted averaging, or even more complex schemes such as soft-max or weighted averages to combine energies from different granularities. The choice of aggregation method significantly impacts the final uncertainty estimate, influencing its sensitivity to different types of distribution shifts and its overall accuracy. Therefore, a well-designed energy aggregation strategy is crucial for robust and reliable uncertainty quantification in GNNs, particularly in domains where data interdependence is high.
Evidential GEBM#
The concept of “Evidential GEBM” suggests a powerful extension of energy-based models (EBMs) for uncertainty quantification in graph neural networks (GNNs). It leverages the inherent multi-scale nature of graph data by aggregating energy estimates from different structural levels (local, group, and global) within a unified framework. The evidential interpretation is crucial, offering a robust approach to uncertainty quantification that goes beyond simple confidence scores. This is achieved by connecting the model’s energy function to the evidence parameter of an evidential model, leading to predictions that are more resilient to distribution shifts and out-of-distribution data. The Gaussian regularization further enhances the robustness, addressing the common overconfidence issue in logit-based EBMs and ensuring a well-behaved probability density. This approach is post-hoc, requiring no retraining of the GNN, and applicable to a wide range of GNN architectures making it a practical tool for reliable uncertainty estimation in various applications. The model’s sensitivity to different structural scales promises higher accuracy and better reliability compared to methods that focus only on global or structure-agnostic uncertainty.
Distribution Shifts#
The concept of distribution shifts is crucial in evaluating the robustness of machine learning models, especially in real-world applications where data is rarely stationary. Distribution shifts refer to changes in the underlying data distribution between training and deployment phases. This can manifest as changes in feature statistics, class proportions, or the relationships between features, impacting a model’s performance. The paper likely investigates various types of distribution shifts and how a graph neural network (GNN) handles them, assessing the model’s sensitivity and robustness under these shifts. The authors likely use multiple benchmark datasets and introduce controlled shifts to quantify the extent of the effect on predictive uncertainty. A key focus might be on how the model’s uncertainty estimates change in response to out-of-distribution data, and how well the GNN identifies these instances, showcasing its ability to handle real-world unpredictability.
GEBM Limitations#
The GEBM model, while demonstrating strong performance in many scenarios, exhibits certain limitations. Its post-hoc nature prevents it from directly improving the underlying GNN’s aleatoric uncertainty or calibration. The reliance on graph diffusion may limit GEBM’s effectiveness in non-homophilic graphs, where structural information is less reliably captured through diffusion processes. The framework’s current focus on node classification in homophilic networks necessitates further research for extending its applicability to other graph tasks and structural settings. The hyperparameters require careful tuning, though the authors suggest default values. The Gaussian regularization, while crucial for mitigating overconfidence, may affect performance relative to vanilla EBMs. Overall, while promising, GEBM’s applicability might be restricted depending on the specific characteristics of the graph data and the desired task.
More visual insights#
More on figures

This figure illustrates the GEBM (Graph Energy-Based Model) framework for estimating epistemic uncertainty in Graph Neural Networks (GNNs). It begins with a pre-trained GNN that produces graph-agnostic energy representing uncertainty. This energy is then regularized to address overconfidence issues. Next, the energy is aggregated at three different structural scales: local (fine-grained, sensitive to conflicting evidence), group (evidence smoothing, highlighting clusters), and independent (structure-agnostic, based on individual nodes). Graph diffusion is interleaved with energy marginalization at each level to capture different granularities of patterns. Finally, the aggregated energies from all three levels are combined to produce a single, comprehensive measure of epistemic uncertainty for each node. The figure visually represents the process with nodes, edges, and illustrative energy distributions.

This figure illustrates the architecture of the Graph Energy-based Model (GEBM). It shows how graph-agnostic energy (uncertainty) from a pre-trained Graph Neural Network (GNN) is first regularized to reduce overconfidence, then aggregated across different scales (local, cluster, and global) using graph diffusion and energy marginalization. The different energy types are combined using a soft-maximum function to produce a single uncertainty score that is sensitive to anomalies at various structural levels.

This figure illustrates the architecture of the Graph Energy-based Model (GEBM). It shows how graph-agnostic uncertainty from a pre-trained Graph Neural Network (GNN) is processed through regularization to reduce overconfidence. The model then aggregates this uncertainty across three different scales: local, cluster, and graph-agnostic. Local uncertainty is highly granular and can detect inconsistencies in local neighborhoods; cluster uncertainty considers broader evidence smoothing; and graph-agnostic uncertainty is fully structure-agnostic. By combining these levels of uncertainty via soft maximum selection, GEBM produces a single uncertainty measure that is sensitive to various anomaly types.

This figure illustrates the architecture of the Graph Energy-based Model (GEBM). It starts with a pre-trained Graph Neural Network (GNN) which produces graph-agnostic energy. This energy is then regularized to reduce overconfidence. After regularization, the energy is aggregated at different structural scales: local (fine-grained, sensitive to neighborhood disagreements), group (evidence smoothing, highlighting cluster anomalies), and independent (structure-agnostic, considering individual nodes). The aggregation uses soft minimum selection to combine these energy types. The result is a single measure of epistemic uncertainty. The figure highlights that GEBM handles different anomaly types.

This figure illustrates the architecture of the Graph Energy-based Model (GEBM). It shows how graph-agnostic energy (uncertainty) from a trained Graph Neural Network (GNN) is processed in three stages: regularization to reduce overconfidence, aggregation of energy at different structural levels (local, cluster, and global), and combining these levels via soft maximum selection. Different aggregation methods are used at each level to capture different levels of granularity in the uncertainty. The resulting GEBM provides a single uncertainty measure sensitive to multiple anomaly types.

This figure illustrates the GEBM (Graph Energy-based Model) framework. It begins with a pre-trained Graph Neural Network (GNN) that provides graph-agnostic energy (uncertainty). This energy is then regularized to reduce overconfidence. The core of the model involves aggregating the energy at three different levels: local, cluster, and graph-agnostic. This aggregation is achieved by combining graph diffusion with energy marginalization at each level. The different levels capture uncertainty at different structural scales within the graph. Ultimately, GEBM combines these three energy levels into a single uncertainty measure that is able to detect anomalies of different types simultaneously.
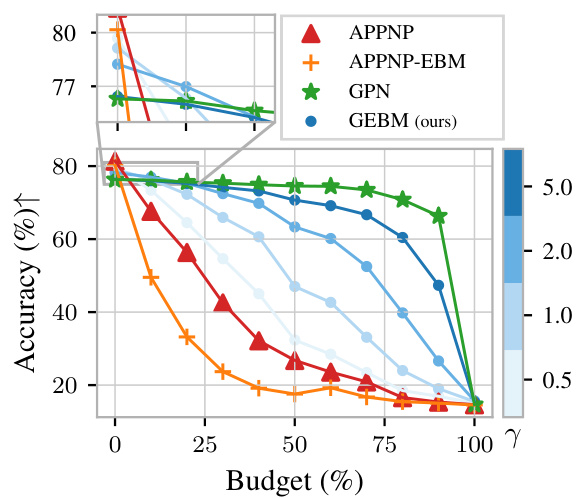
This figure illustrates the GEBM (Graph Energy-based Model) framework. It shows how graph-agnostic energy, representing uncertainty from a pre-trained Graph Neural Network (GNN), is processed. The process involves three steps: regularization to reduce overconfidence, aggregation of energy at different scales (local, cluster, and global), and the combination of these energy scales into a single uncertainty estimate. The figure highlights that the GEBM method considers uncertainty arising at various levels of graph structure, leading to improved anomaly detection.

The figure illustrates the architecture of the Graph Energy-based Model (GEBM) for estimating epistemic uncertainty in Graph Neural Networks (GNNs). It shows how graph-agnostic uncertainty from a pre-trained GNN is regularized to handle overconfidence. Then, this uncertainty is aggregated across different structural scales (local, cluster, and global) using a process involving energy marginalization and graph diffusion. The different scales of aggregation are meant to capture uncertainty at different granularities in the graph structure. The resulting GEBM combines these different levels of uncertainty into a single measure, which is shown to be effective at identifying various types of anomalies.
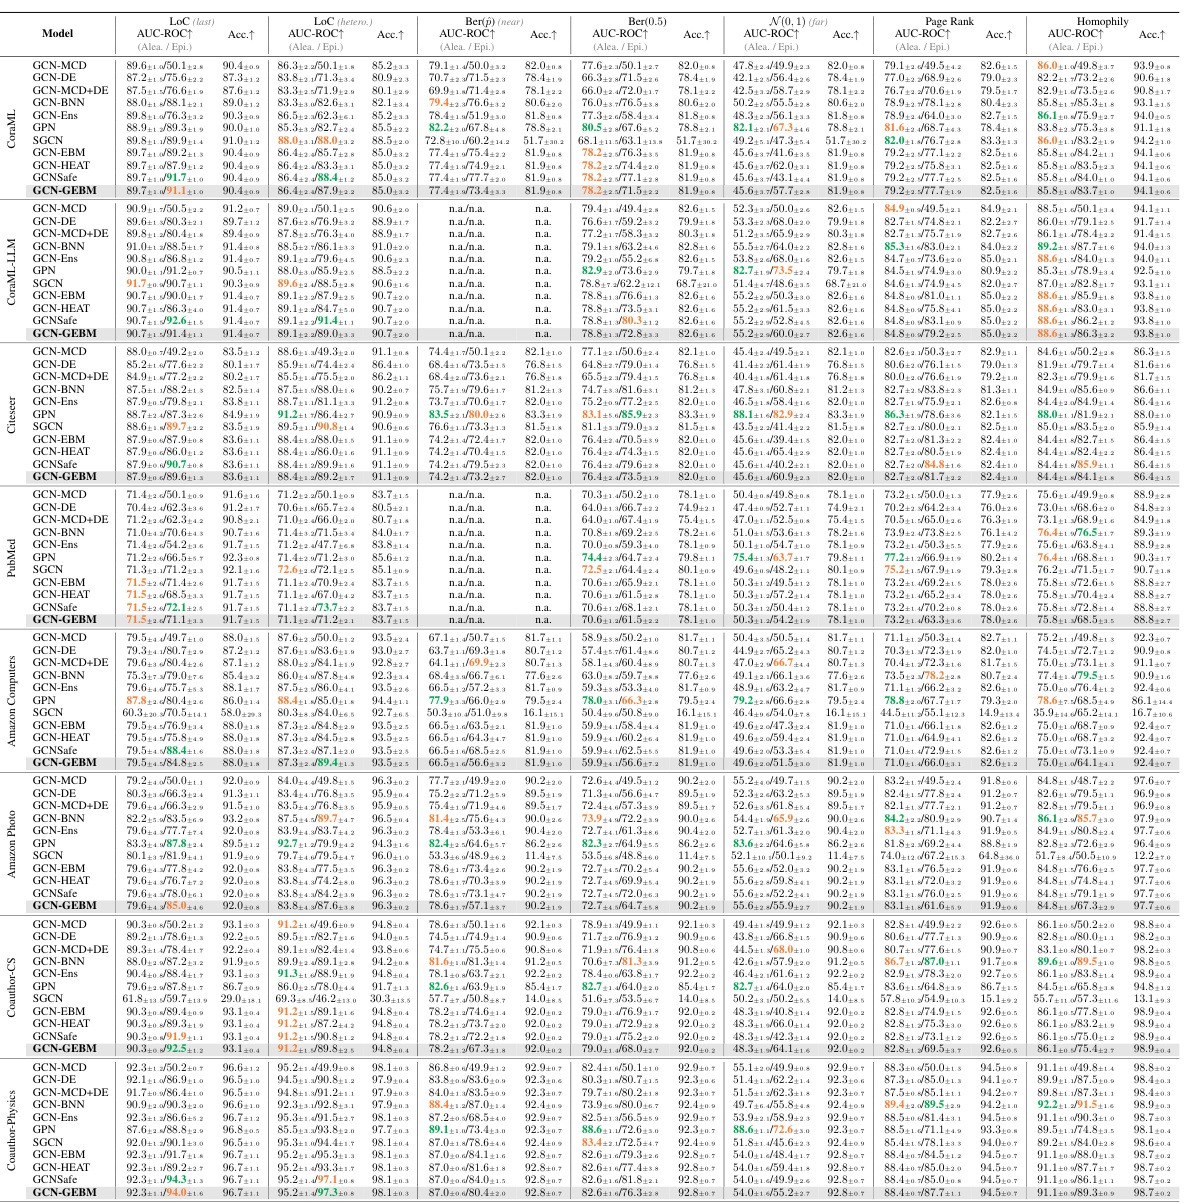
This figure illustrates the architecture of the Graph Energy-based Model (GEBM). It shows how graph-agnostic energy (uncertainty) from a trained Graph Neural Network (GNN) is processed. The process involves regularization to address overconfidence, and then aggregation of energy at different scales (local, cluster, and structure-independent) by combining energy marginalization and graph diffusion. The different energy types are shown in separate boxes, highlighting how the model integrates information from various structural levels in the graph. Finally, the figure emphasizes that GEBM is effective at detecting multiple types of anomalies simultaneously by assigning high uncertainty.
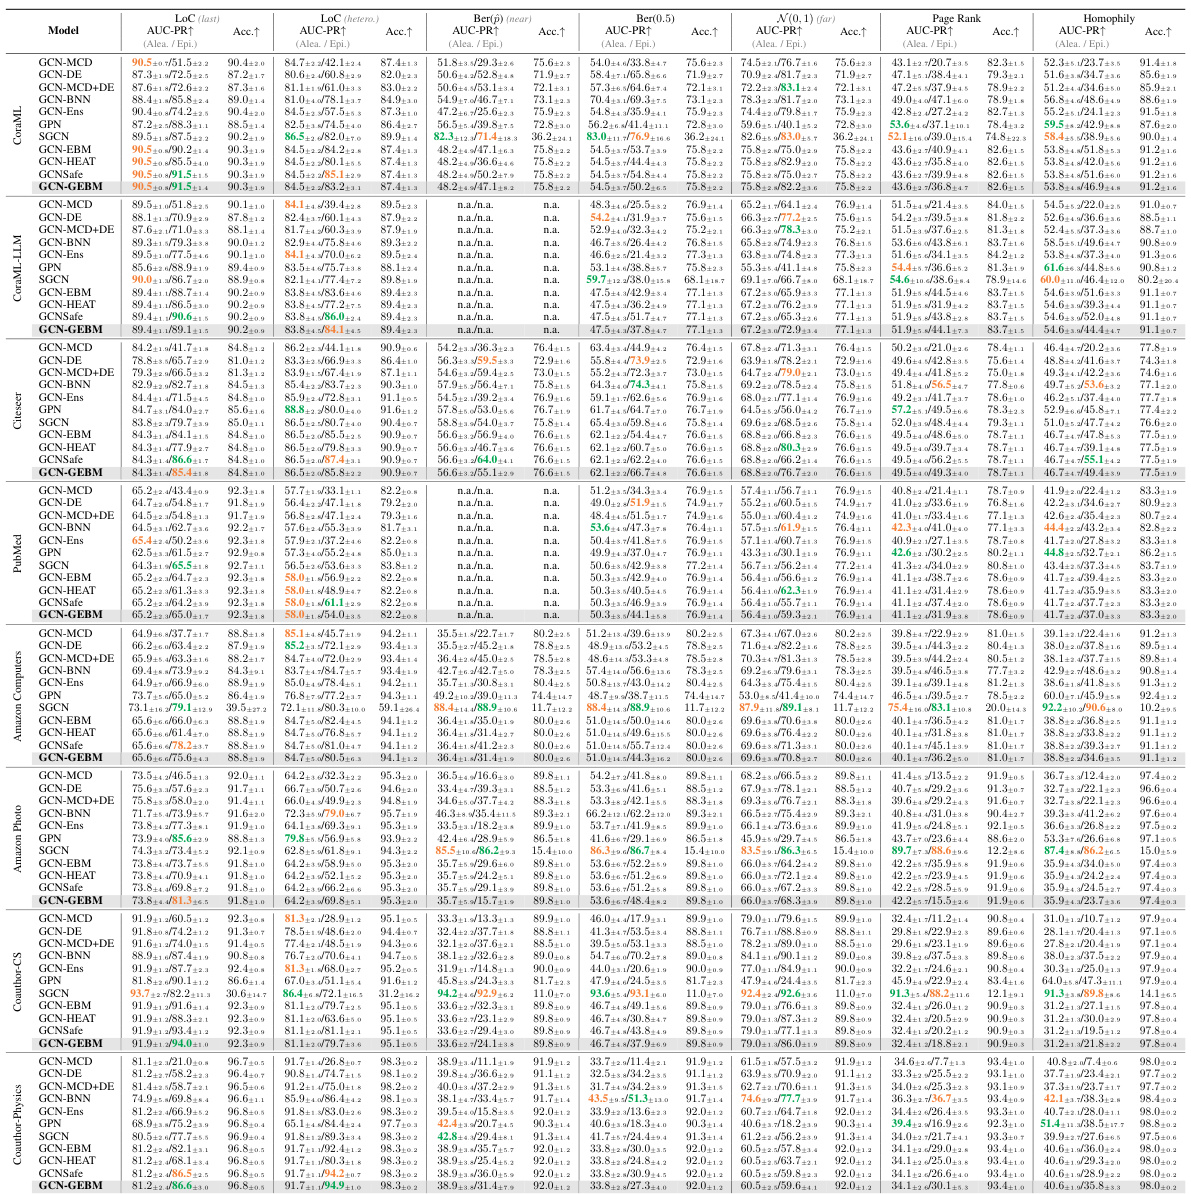
This figure illustrates the architecture of the Graph Energy-based Model (GEBM). It starts with a pre-trained Graph Neural Network (GNN) that produces graph-agnostic energy representing uncertainty. This energy is then regularized to reduce overconfidence. Next, the energy is aggregated across different structural scales: local (fine-grained, sensitive to neighborhood disagreements), group (evidence smoothing emphasizing anomalous clusters), and independent (structure-agnostic, considering individual nodes). The aggregation process interleaves graph diffusion to capture patterns at different granularities. Finally, the combined energy represents the overall epistemic uncertainty assigned by GEBM, showing its ability to detect various anomaly types.
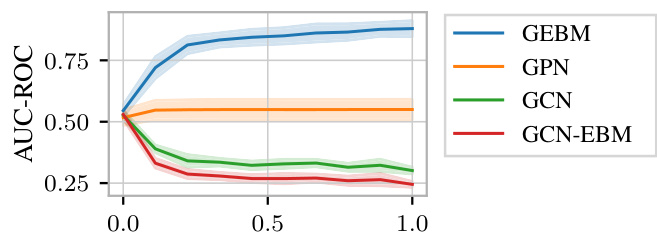
This figure illustrates the Graph Energy-based Model (GEBM) and its process. Graph-agnostic energy, representing uncertainty from a trained Graph Neural Network (GNN), is first regularized to avoid overconfidence. Then, this energy is aggregated across different scales (local, cluster, and global) by combining energy marginalization and graph diffusion. The different energy types (group, local, and independent) are shown, highlighting how they’re combined using a soft maximum. The final output is a single uncertainty estimate which considers uncertainty at different structural levels, ultimately making GEBM more robust and accurate in identifying various types of anomalies.
This figure illustrates the architecture of the Graph Energy-based Model (GEBM) which aggregates uncertainty from different structural levels using graph diffusion and energy marginalization. It begins with graph-agnostic energy from a pre-trained Graph Neural Network (GNN), which is then regularized to reduce overconfidence. This energy is then aggregated at three levels: local (fine-grained), group (cluster-level), and independent (structure-agnostic). The aggregation process uses softmin operations and interleaves graph diffusion steps to capture patterns at various scales, ultimately assigning a high uncertainty score to instances exhibiting anomalies across various scales.
The figure illustrates the GEBM framework, which consists of three main components: graph-agnostic energy, local energy, and group energy. Graph-agnostic energy represents the uncertainty of the GNN without considering the graph structure, local energy considers the uncertainty of individual nodes based on their neighbors’ information, and group energy considers uncertainty at the cluster level. The three types of energy are combined using a softmax function to produce a final uncertainty measure. The regularization step reduces overconfidence in the base GNN. The figure showcases how GEBM uses graph diffusion and energy marginalization to capture uncertainty from different structural levels and assigns high uncertainty to various anomaly types.
The figure illustrates the architecture of the Graph Energy-based Model (GEBM). It shows how graph-agnostic uncertainty from a pre-trained Graph Neural Network (GNN) is processed through regularization to reduce overconfidence. This uncertainty is then aggregated at three different levels: local (fine-grained, sensitive to neighborhood disagreements), group (smooths energy within graph clusters), and independent (structure-agnostic, based on individual nodes). The integration of these different levels of uncertainty provides a more comprehensive measure, particularly for complex anomaly scenarios.
This figure illustrates the architecture of the Graph Energy-based Model (GEBM). It shows how graph-agnostic energy, representing uncertainty from a trained Graph Neural Network (GNN), is processed through a series of steps: regularization to address overconfidence, aggregation at different structural scales (local, cluster, and global) via energy marginalization and graph diffusion, and finally combination of these scales. Different energy types capture patterns at different granularities, allowing GEBM to effectively detect anomalies across various structural levels within the graph.
The figure illustrates the architecture of the Graph Energy-based Model (GEBM). It starts with a pre-trained Graph Neural Network (GNN) that outputs graph-agnostic energy. This energy is then regularized to address overconfidence. The core of GEBM is the aggregation of this energy at multiple structural levels (local, group, and independent). This aggregation is achieved by using graph diffusion and energy marginalization. The combination of these methods enables the model to capture uncertainty at different scales and assign high uncertainty to various anomaly types.
The figure illustrates the architecture of the Graph Energy-based Model (GEBM) for estimating epistemic uncertainty in Graph Neural Networks (GNNs). It shows how graph-agnostic energy (uncertainty) from a pre-trained GNN is processed through three stages: regularization to mitigate overconfidence, aggregation at different structural levels (local, group, and global), and finally combination of these levels using a soft maximum function. Each stage uses graph diffusion techniques to incorporate structural information into the uncertainty estimation. The figure highlights that GEBM is designed to capture uncertainty at various granularities, achieving better separation of in-distribution and out-of-distribution data.
More on tables

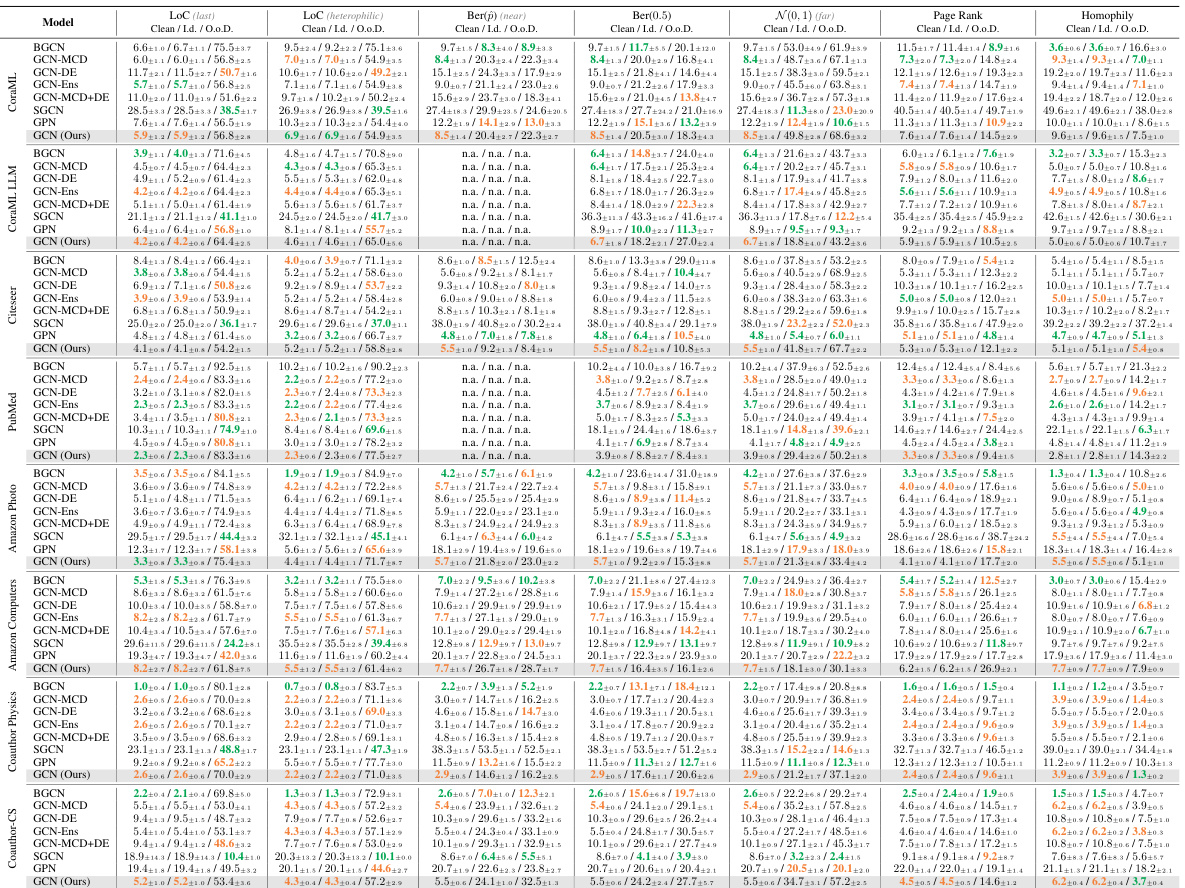
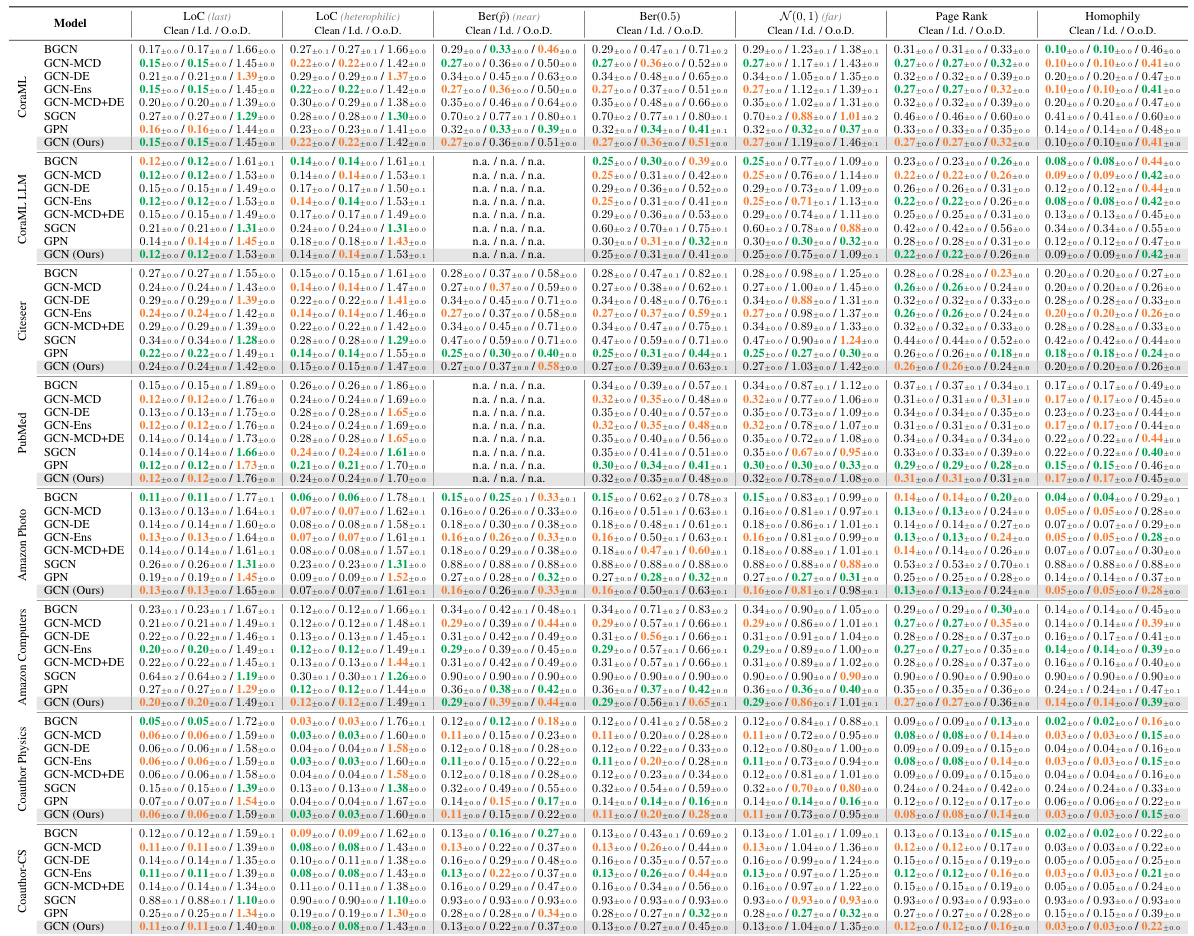
This table presents the results of out-of-distribution detection experiments using various methods for both aleatoric and epistemic uncertainty estimation. The AUC-ROC (Area Under the Receiver Operating Characteristic curve) and Accuracy metrics are shown for seven datasets and multiple types of distribution shifts. The table highlights that the proposed GEBM model consistently achieves the best or second-best separation of out-of-distribution (o.o.d.) data from in-distribution (i.d.) data, while maintaining high classification accuracy. The best and runner-up results are indicated for each dataset and shift.

This table presents the results of out-of-distribution detection experiments using both aleatoric and epistemic uncertainty measures. The AUC-ROC (Area Under the Receiver Operating Characteristic Curve) metric is used to evaluate the performance of various models in distinguishing between in-distribution and out-of-distribution data. The table shows that the proposed epistemic uncertainty measure consistently achieves the best performance across multiple datasets and different types of distribution shifts. Importantly, the model maintains high classification accuracy, indicating that the uncertainty estimation does not negatively impact the predictive capabilities of the underlying GCN (Graph Convolutional Network) model.

This table presents the Area Under the Curve for Receiver Operating Characteristic (AUC-ROC) scores for out-of-distribution detection, comparing the performance of aleatoric and epistemic uncertainty methods. The AUC-ROC is a measure of the ability of a model to distinguish between in-distribution and out-of-distribution data. Higher scores indicate better performance. The table shows that the proposed epistemic uncertainty measure consistently achieves the best or second-best results across different datasets and distribution shifts while maintaining the classification accuracy.

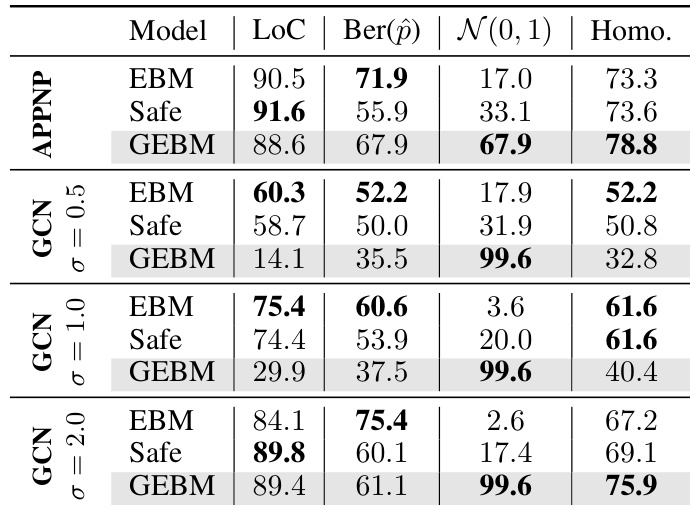
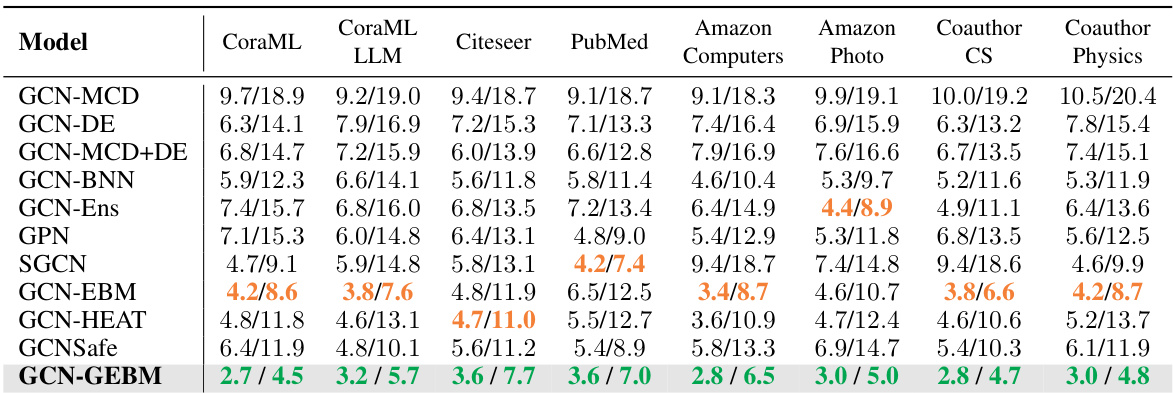
This table presents the characteristics of the eight datasets employed in the paper’s experiments. For each dataset, it shows the number of nodes (‘Nodes n’), the number of edges (‘Edges m’), the number of features (‘Features d’), the number of classes (‘Classes c’), the average feature density (‘Avg. Feature Density (%)’), the homophily (‘Homophily (%)’), the edge density (‘Edge Density m/n² (%)’), the number of left-out classes (‘Left-out-Classes’), and the number of in-distribution nodes (’#Nodes-i.d. (Loc) nid’). These metrics offer a comprehensive overview of the datasets’ structural properties and class distributions, which are crucial factors for evaluating the proposed model’s performance on various node classification tasks.

This table presents the results of out-of-distribution detection experiments using various uncertainty estimation methods. The AUC-ROC (Area Under the Receiver Operating Characteristic curve) metric is used to evaluate the performance of separating in-distribution from out-of-distribution data. The table shows that the proposed epistemic uncertainty method (GCN-GEBM) achieves the highest AUC-ROC scores on most datasets and distribution shifts, maintaining the classification accuracy of the underlying GCN model. The results are compared against several baselines including aleatoric uncertainty estimates and other epistemic uncertainty methods.

This table presents the results of out-of-distribution detection experiments using various methods. It compares the Area Under the ROC Curve (AUC-ROC) and accuracy for different anomaly detection methods, including aleatoric and epistemic uncertainty approaches. The table highlights the superior performance of the proposed Graph Energy-based Model (GEBM) in separating in-distribution and out-of-distribution data across multiple datasets and shift types, while preserving the classification accuracy of the underlying GCN model.
This table presents the results of out-of-distribution detection experiments using various methods. It compares the Area Under the Receiver Operating Characteristic curve (AUC-ROC) and accuracy for each method across seven datasets under seven different distribution shifts. The shifts include changes in graph structure, class distribution, and node features. The table highlights that the proposed GEBM method (epistemic uncertainty measure) consistently achieves the best or second-best performance, demonstrating improved effectiveness in distinguishing between in-distribution and out-of-distribution data, while maintaining the accuracy of the original classification model.

This table presents the results of out-of-distribution detection experiments using various methods. The AUC-ROC (Area Under the Receiver Operating Characteristic curve) metric is used to evaluate the performance of both aleatoric (irreducible uncertainty) and epistemic (reducible uncertainty) uncertainty estimation methods. The table shows that the proposed epistemic uncertainty measure (GCN-GEBM) consistently outperforms other methods across different datasets and types of distribution shifts, while maintaining the classification accuracy of the base GCN model. The results are presented as AUC-ROC scores and accuracy for each method on each dataset for various distribution shifts.

This table presents the results of out-of-distribution detection using both aleatoric and epistemic uncertainty measures. The AUC-ROC (Area Under the Receiver Operating Characteristic Curve) and accuracy are reported for seven benchmark datasets across several types of distribution shifts. The table highlights that the proposed epistemic uncertainty measure (GCN-GEBM) consistently achieves the best or second-best performance, indicating its effectiveness across different scenarios. The model maintains the classification accuracy of the GCN backbone, suggesting it effectively improves predictive uncertainty without impacting prediction accuracy.

This table presents the results of out-of-distribution detection experiments using both aleatoric and epistemic uncertainty measures. The AUC-ROC metric is used to evaluate the performance of various models in distinguishing in-distribution (ID) data from out-of-distribution (OOD) data. The table highlights that the proposed epistemic uncertainty measure consistently achieves the best performance across most datasets and various types of distribution shifts, while maintaining the original classification accuracy of the underlying GCN model. This indicates the superiority of the proposed method in quantifying epistemic uncertainty in graph neural networks.
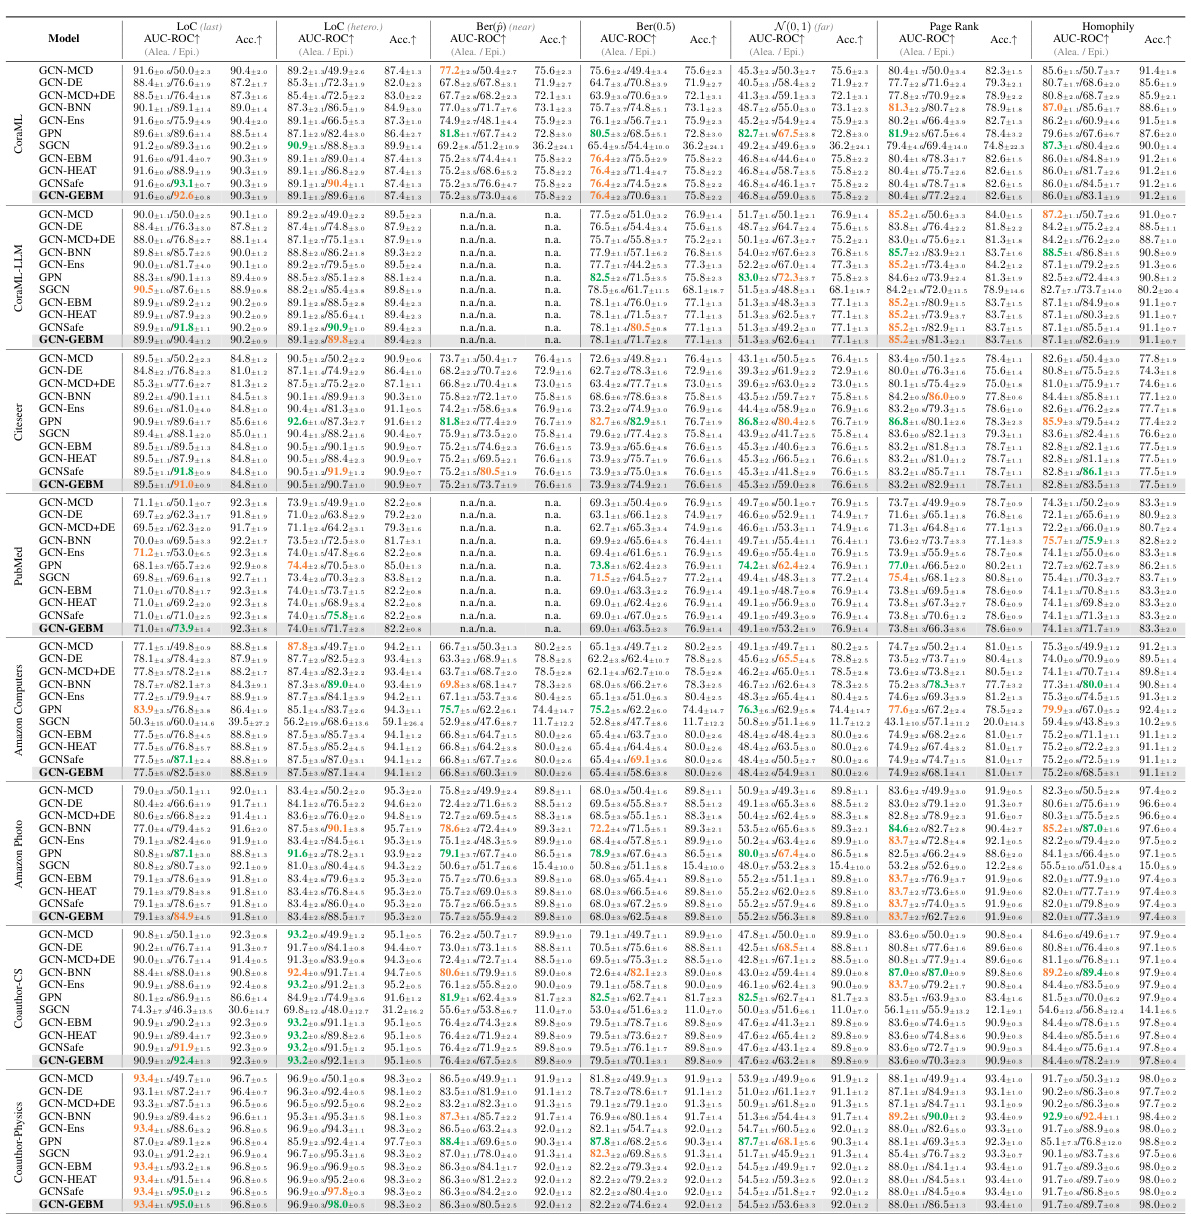
This table presents the results of out-of-distribution detection experiments using both aleatoric and epistemic uncertainty measures on seven benchmark datasets. The AUC-ROC (Area Under the Receiver Operating Characteristic Curve) and accuracy are reported for various distribution shifts (structural, leave-out-class, and feature perturbations). The table compares the performance of Graph Energy-based Model (GEBM) against other methods, highlighting GEBM’s superior performance in separating in-distribution and out-of-distribution data while maintaining good classification accuracy.
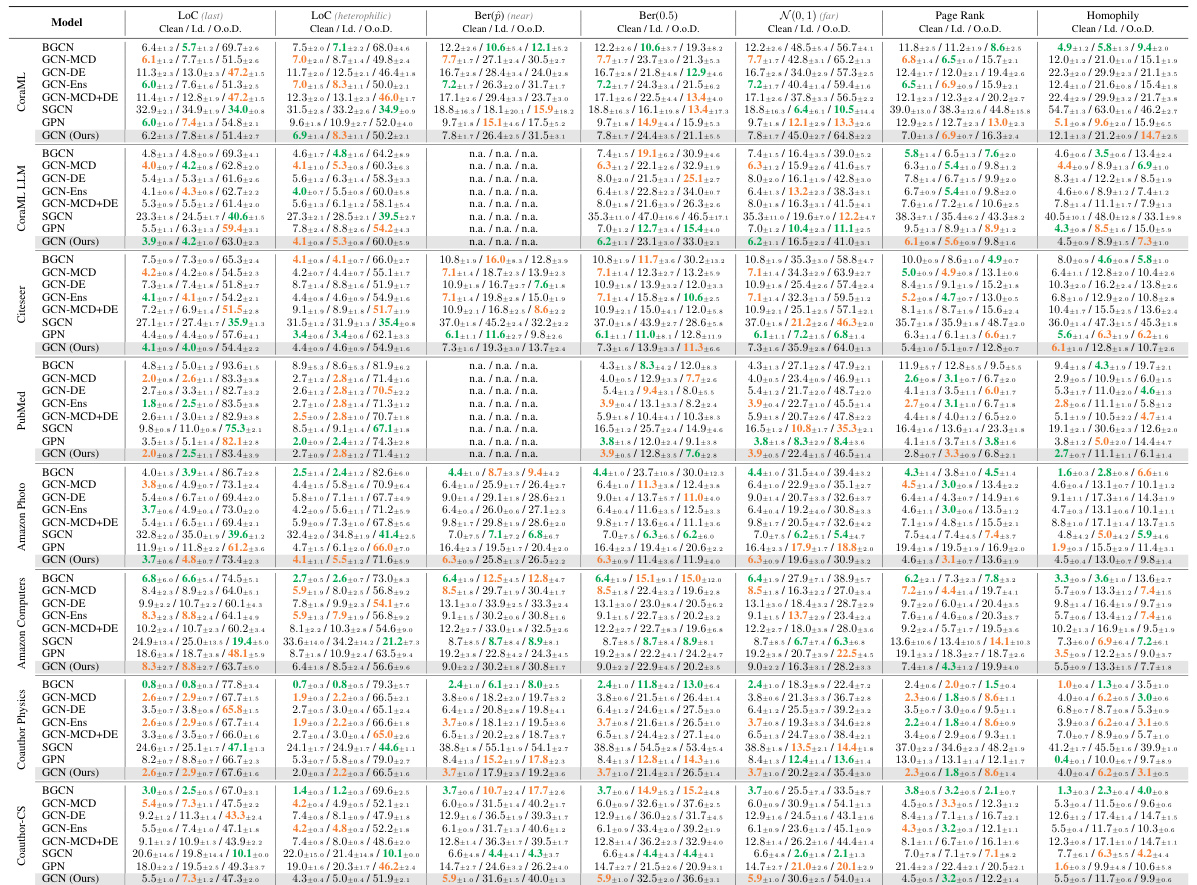
This table presents the results of out-of-distribution detection experiments using both aleatoric and epistemic uncertainty measures. The AUC-ROC metric is used to evaluate the performance of different methods in distinguishing in-distribution from out-of-distribution data across various datasets and types of distribution shifts (structural, leave-out-class, feature perturbations). The table highlights that the proposed epistemic uncertainty measure consistently achieves the best separation of in-distribution and out-of-distribution data in most cases while maintaining the accuracy of the underlying GCN backbone.
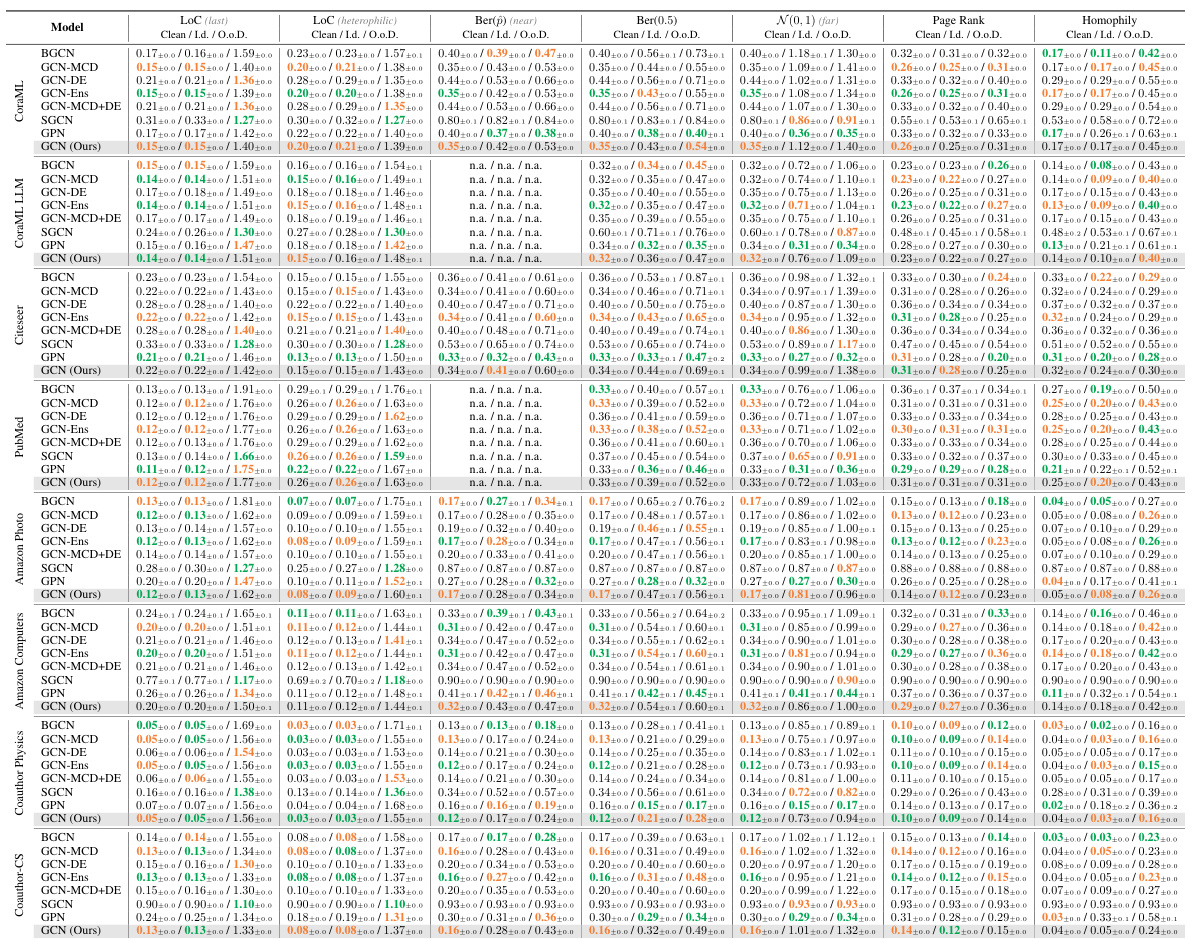
This table presents the results of out-of-distribution detection experiments using both aleatoric and epistemic uncertainty measures. The AUC-ROC (Area Under the Receiver Operating Characteristic curve) and accuracy are shown for various node classification datasets and different types of distribution shifts (structural, leave-out-class, and feature perturbations). The table highlights the performance of the proposed Graph Energy-based Model (GEBM) compared to other methods, demonstrating GEBM’s superior ability to distinguish between in-distribution and out-of-distribution data, while maintaining high classification accuracy.
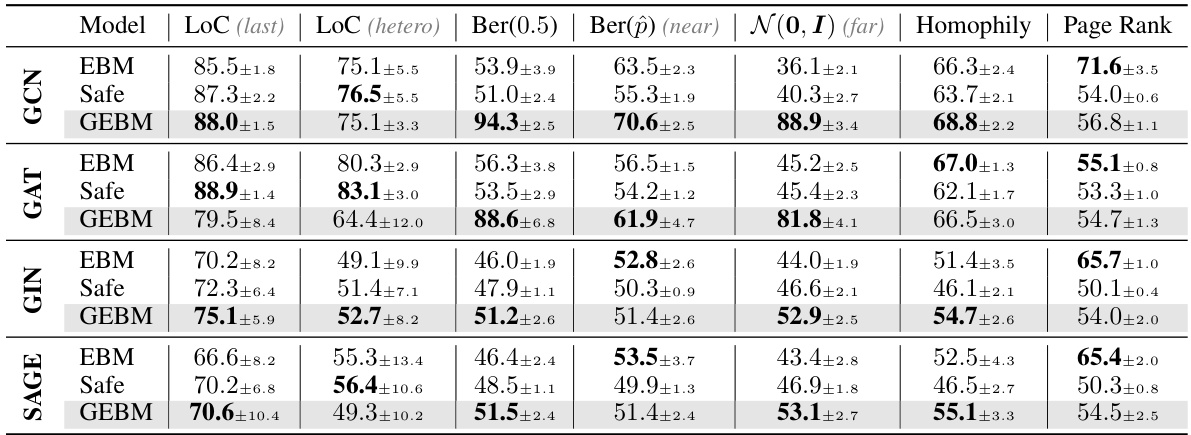
This table presents the results of out-of-distribution detection experiments using different uncertainty estimation methods. The AUC-ROC (Area Under the Receiver Operating Characteristic curve) metric is used to evaluate the performance of both aleatoric (irreducible) and epistemic (reducible) uncertainty methods in distinguishing in-distribution data from out-of-distribution data across several datasets. The table highlights the superior performance of the proposed epistemic uncertainty measure (GEBM) compared to baselines, demonstrating its effectiveness in various distribution shifts while maintaining high classification accuracy.
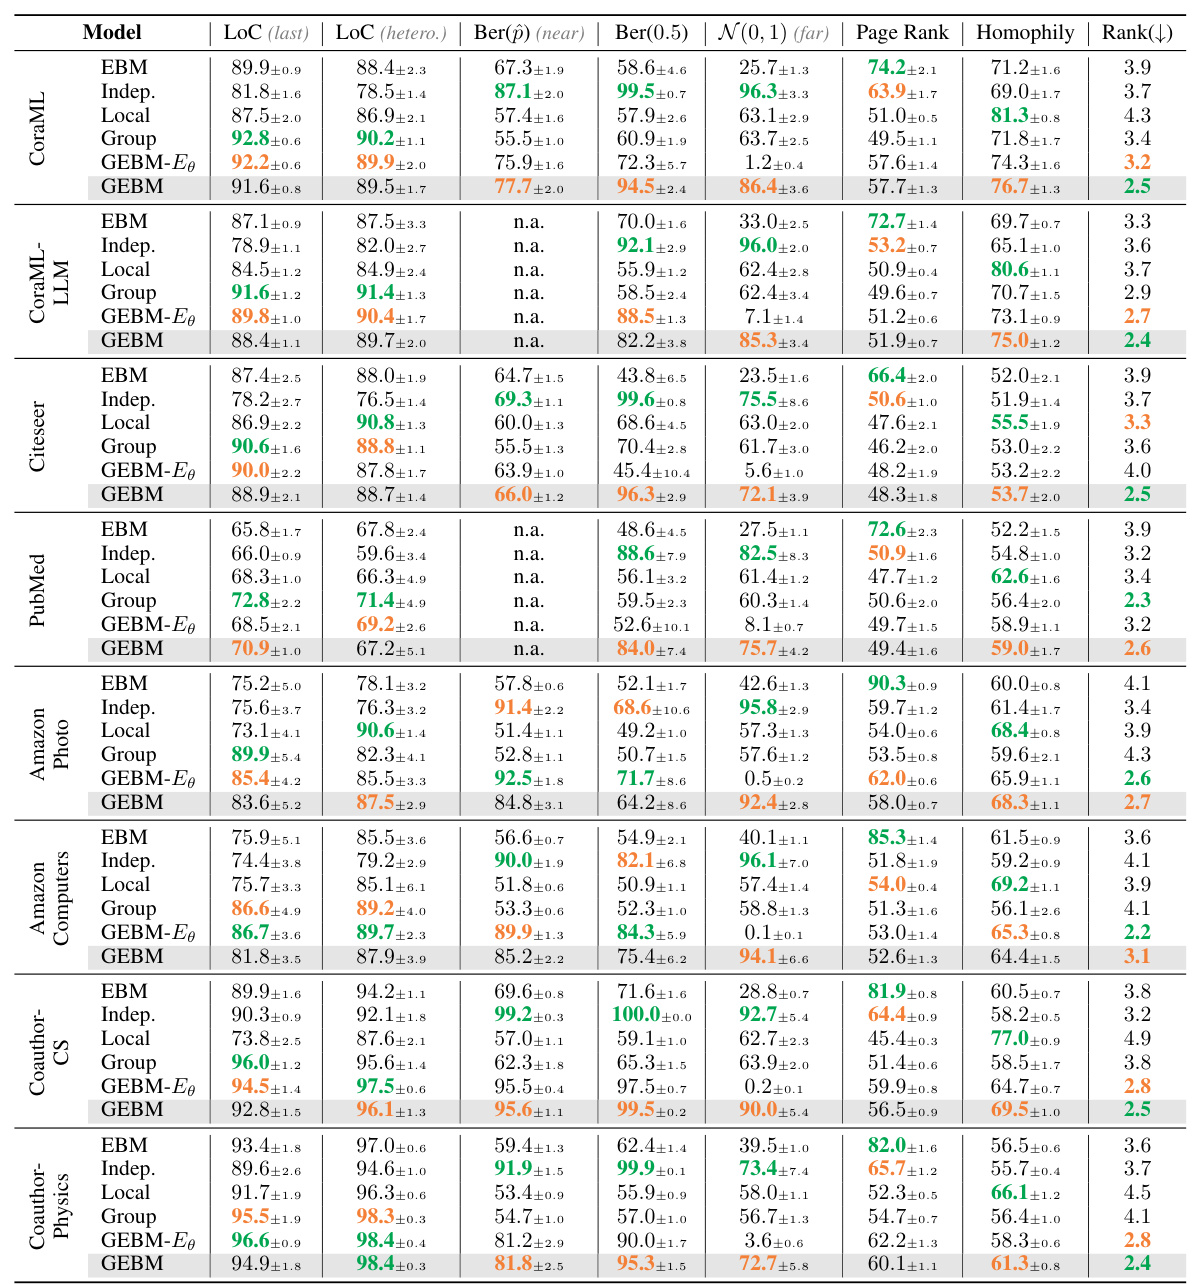
This table presents the results of out-of-distribution detection experiments using both aleatoric and epistemic uncertainty measures. The AUC-ROC (Area Under the Receiver Operating Characteristic curve) metric is used to evaluate the performance of different methods across various datasets and distribution shifts. The table highlights that the proposed epistemic uncertainty measure achieves the best performance on most datasets and shifts.
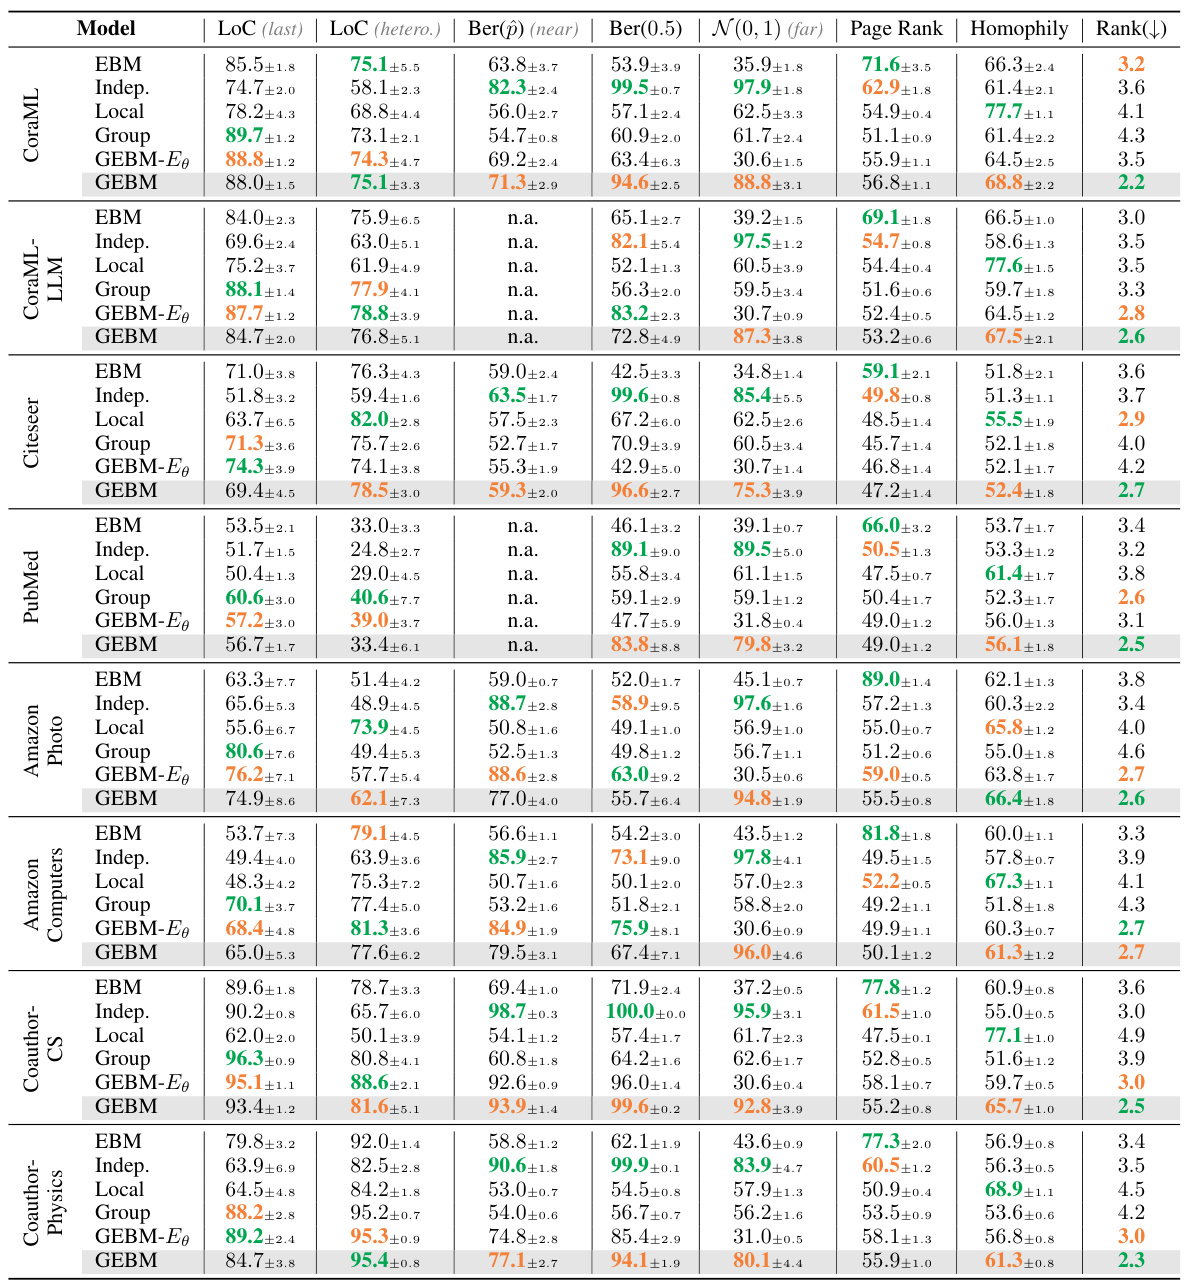
This table presents the results of out-of-distribution detection experiments using various uncertainty estimation methods. The AUC-ROC metric is used to evaluate the performance of each method in separating in-distribution from out-of-distribution data. The table shows the results for several datasets and different types of distribution shifts and compares the proposed Graph Energy-based Model (GEBM) with other state-of-the-art methods. The ‘best’ and ‘runner-up’ performances are indicated for both aleatoric and epistemic uncertainty measures. The results demonstrate GEBM’s superior performance, especially regarding the consistency of its effectiveness across various anomaly types.
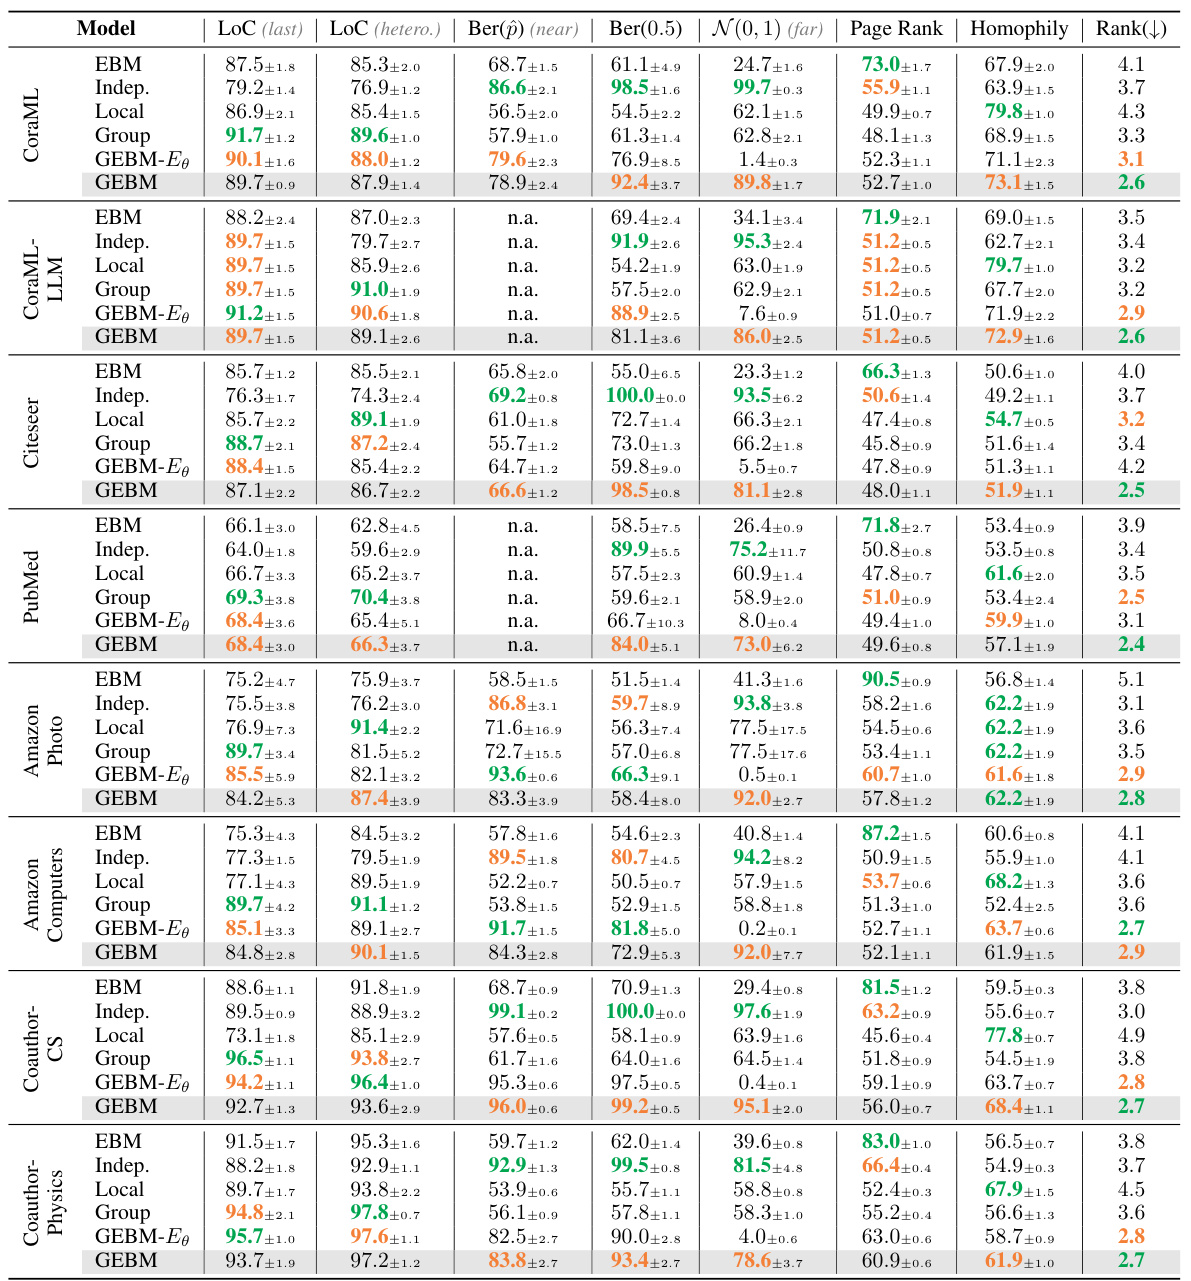
This table presents the results of out-of-distribution detection experiments using various methods. The AUC-ROC metric is used to evaluate the performance. The table compares the performance of aleatoric and epistemic uncertainty methods across multiple datasets and various types of distribution shifts. The goal is to identify which methods best distinguish between in-distribution and out-of-distribution data. The results show that the proposed epistemic uncertainty measure consistently achieves the best separation of in-distribution and out-of-distribution data across various scenarios.
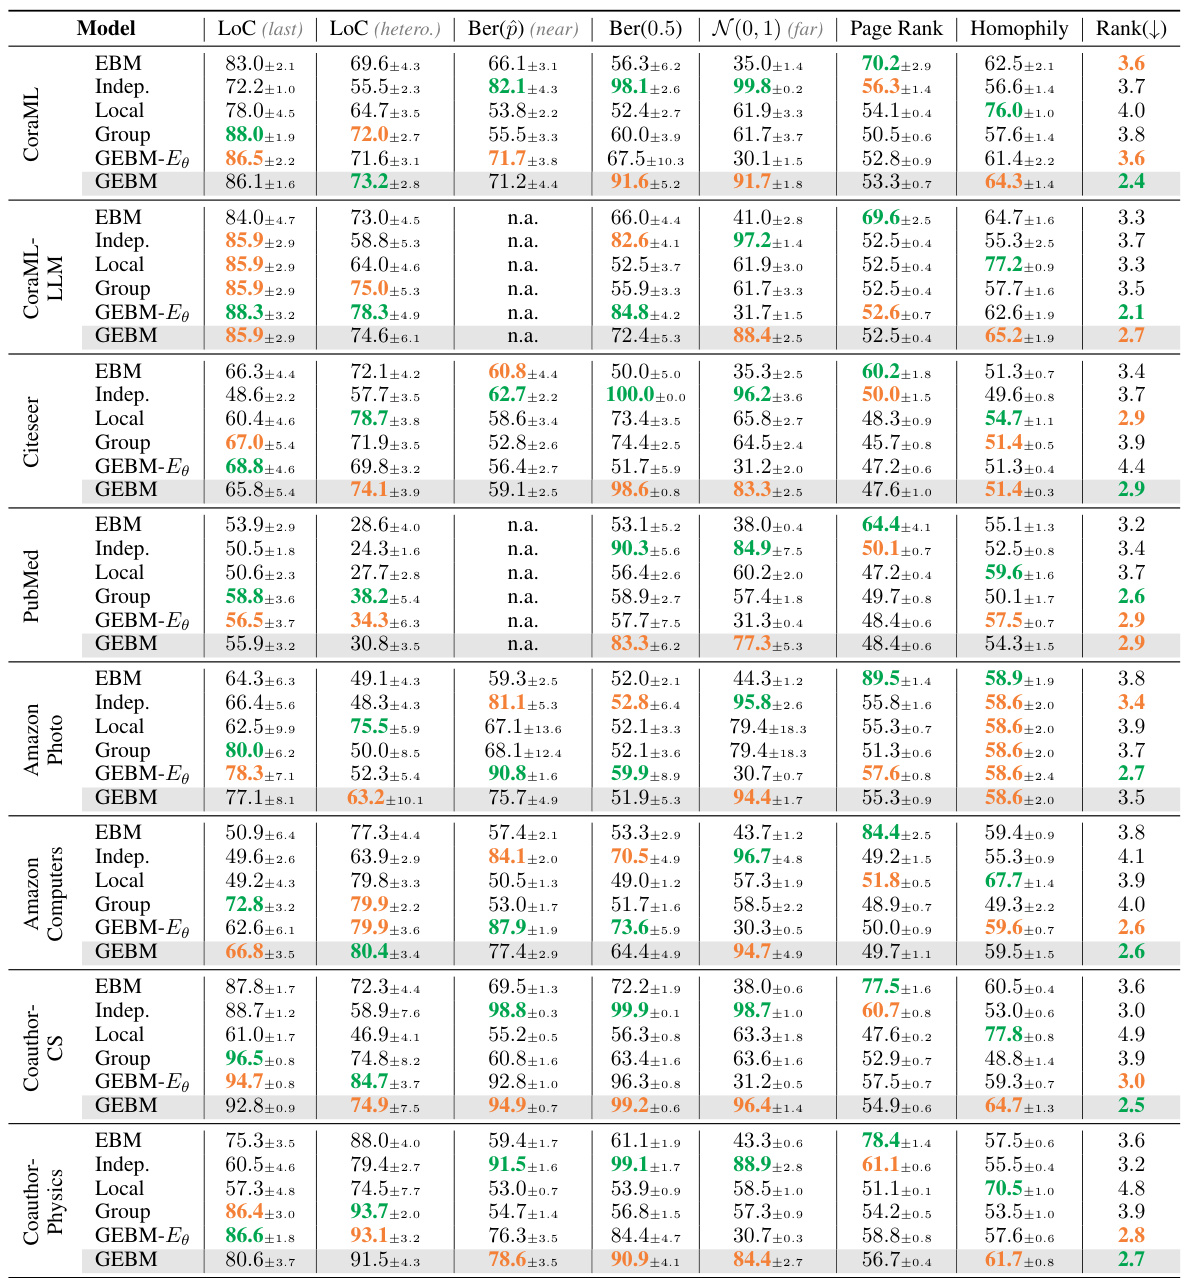
This table presents the Area Under the Curve for Receiver Operating Characteristic (AUC-ROC) scores for out-of-distribution detection, comparing different uncertainty estimation methods across seven benchmark datasets. The AUC-ROC scores are shown separately for aleatoric and epistemic uncertainty, and the best and second-best performing methods for each are highlighted. The results illustrate the superior performance of the proposed epistemic uncertainty measure in separating in-distribution from out-of-distribution data while preserving the classification accuracy of the original GCN model.
Full paper#


